Session T2G HOW TO IMPROVE A VIRTUAL PROGRAMMING COURSE? Veijo Meisalo1, Erkki Sutinen2 and Sirpa Torvinen3
Abstract – The University of Joensuu started to offer virtual Computer Science studies to high school students in the surrounding rural area of Joensuu beginning in fall 2000. We evaluated the first programming course and modified the course based on the analyzed feedback of the students who dropped out. In fall 2001, we branched out to the rural region of a neighboring province and evaluated the differences between the new and old areas. The percentage of dropouts is somewhat larger in the new area. The course arrangements are the same in both areas, but we found factors, such as the knowledge of the course standards, the experience and attitudes of tutor-teachers, the students' own activities, as well as the students’ earlier experience in programming, which may have influenced the dropout phenomenon. We are using stepwise dropout treatment during the first programming course. Index Terms – computer science education, distance learning, dropouts, programming, virtual learning
INRODUCTION The Finnish Ministry of Education is funding a three-year project during 2001-2003 to establish the Virtual University of Finland. One of the particular goals in the project is to develop new Computer Science education methods [5]. In the fall of 2000, the Department of Computer Science at the University of Joensuu began offering, within the framework of that project, a university-level Introductory Computer Science Curriculum (22.5 European Credit Transfer System credits, cps) to high school students in the surrounding rural region of the province of Pohjois -Karjala. Almost half of the Curriculum concerned programming in Java. We evaluated in this action research oriented case study the first programming course. We focused on students who dropped out either during the course or right after it. On the basis of the analyzed feedback, the curriculum was modified for the following academic year to better suit the students' potential. In the fall of 2001, we extended this teaching experiment to a rather similar rural region in the neighboring province of Etelä-Savo. We now have students from a total of 21 rural high schools. In this report, we present the contents and 1 2 3
arrangements of this virtual course, the feedback collected during the first year, and describe the changes made. We also analyze the percentage of dropouts both in the old and new areas, and discuss the factors that might help decrease the number of dropouts.
STUDYING THE VIRTUAL COURSE The Curriculum of the Virtual University Course (22.5 cps) includes nine different courses that will give students a basic knowledge of three main domains: Introduction to Computer Science (7.5 cps), Basics of Programming (10.5 cps) and Preliminaries of Computer Architecture and Operating Systems (4.5 cps). Students study independently via the Internet, but each high school has one tutor-teacher, who helps students especially at the beginning of the studies. He or she may, for example, advise on the use of WebCT or how to install the Java compiler. However, the main responsibility for all the courses lies with a supervisor, who is a staff member in University’s Computer Science department. Most of the courses have a similar structure: students work from both printed and web-material, they do weekly assignments, and their learning outcome is evaluated through an exam. Almost all teaching is carried out via the Internet using a WebCT learning environment. One of the design principles was to link the printed learning material with a learning environment on the Web [5], designed to activate students. Each student learns in his or her own personal way and the learning environment should offer a rich assortment of learning tools for different kinds of students [3]. Our Web material is composed mainly in HTML and it supports the printed material. The Web material brings the most essential parts of the course to the learners and quickly shows the student the structure of the domain. Additionally, the Web material includes examples and optional exercises, visualizations using MacroMedia Flash 4.0 or Jeliot2000 [1], and offers an opportunity for interactive experimentation.
THE DROPOUT PHENOMENON During the fall semester, some students decided to drop out, some without even passing any of the courses. The high
Veijo Meisalo, University of Helsinki, Department of Teacher Education, P.O. Box 9, FIN-00014, Helsinki,
[email protected] Erkki Sutinen, University of Joensuu, Department of Computer Science, P.O. Box 111, FIN-80100, Joensuu,
[email protected] Sirpa Torvinen, University of Joensuu, Department of Computer Science, P.O. Box 111, FIN-80100, Joensuu,
[email protected]
0-7803-7444-4/02/$17.00 © 2002 IEEE November 6 - 9, 2002, Boston, MA 32 nd ASEE/IEEE Frontiers in Education Conference T2G-11
Session T2G school students studied for their matriculation examinations at the same time as they did the Virtual University course, and they may have been rather stressed during school exam periods, for example, even if they had not had the extra studies. Students had obvious difficulties scheduling their parallel studies [8]. It is well known that first-year Computer Science students have difficulty learning to program, so the number of dropouts in Table I is not surprising. TABLE I P ERCENTAGE OF DROPOUTS IN OUR COURSES
Title of course
Scheduling
Percentage of dropouts
Preliminaries of Computer Architecture and Operating Systems (4.5 cps): Computers, operating systems, and networking (1.5 cps) Practical uses of computers, essential applications, and networks (1.5 cps) Introduction to the ethics of computing (1.5 cps)
Fall 2000
6.1 %
Fall 2000
*)
Fall 2001
0.0 %
Introduction to Computer Science (7.5 cps): Design of algorithms (1.5 cps) Fall 2001 Hardware, structure of computers Spring 2001 and operating system (3 cps) Research fields of Computer Fall 2001 Science (3 cps)
8.0 % 32.5 % 0. 0 %
Programming (10.5 cps): Programming, part 1 (3 cps) Programming, part 2 (4.5 cps) Laboratory project (3 cps)
Fall 2000 Spring 2001 Summer 2001
39.5 % 42.9 % 0.0 %
*) Data not available
Naturally, a possible explanation for the smaller percentage of dropouts in some courses might be that courses like “Introduction to ethics of computing” or “Practical uses of computers, essential applications, and networks” have a much easier content than the programming courses. Be that as it may, the difference between the percentage of dropouts from the programming courses and the other courses is conspicuous. The other interesting point in Table I is that so many students dropped out during the fall of 2000 and in the beginning of the second programming course, Programming, part 2, Spring 2001, but very few later. According to Cornell & Martin [2], it is very common that as many as 30–50% of students drop out during virtual courses. They also found out that a student, who has passed at least some distance
courses, will probably also pass others in the future. Our experiences are very similar to the above. When we look in more detail at the Summer or Fall 2001 courses, we find that every one who actively started a course also passed it.
Feedback and Course Evaluation Since so many dropouts gave up during the first programming course, we focused on the problems with learning the programming basics and the most difficult topics therein. We wished to be able to pinpoint the main reasons for dropping out. We also analyzed the need for various support measures. We use the Java programming language. There are several evaluations of the use of Java for introductory programming courses [4], [6] and [7]. We can agree with these reports regarding the difficulties using Java as the first programming language. On the other hand, we find many benefits in the use of Java when teaching high school students from 16 to 19 years old. These benefits include Java’s general popularity as a programming language and its graphical features that seem to motivate students to learn programming. One major aspect of our case study was to listen to the students and further develop our courses on the basis of the analyzed feedback. We analyzed the course from two viewpoints: • Learning outcome: the examination papers and exercise portfolios of all the students were inspected. • Student attitudes: students who dropped out, either during the first programming course or right after passing it, were enquired. The questionnaire sent to the dropouts consisted of ten questions. • The first two questions focused on the learning environment: usability of WebCT and the virtual course material. • The following six questions dealt with the study process: which programming fields did the students regard as difficult; the benefit of online support given by supervisors (such as advice given by email, discussion forum, or feedback from exercises); was there a need for support measures like face-to-face sessions, videoconferencing, or a chat-room in WebCTenvironment. The students were also asked when and why they dropped out. • The last two questions were open questions: what would the students like to change in the course and were there any ideas on how to improve the quality of the material or course arrangements, etc.
0-7803-7444-4/02/$17.00 © 2002 IEEE November 6 - 9, 2002, Boston, MA 32 nd ASEE/IEEE Frontiers in Education Conference T2G-12
Session T2G A total of 25 students completed the original questionnaire and a more detailed follow-up questionnaire was sent to six volunteers by email. We found the main reasons for dropping out were lack of time, exercises too difficult, and failing the re-exam. We also found the dropout students did not benefit from the support given by supervisors via Internet. Instead, students found the support of their peers very important. Many students found it difficult to study independently via Internet, particularly learning programming. They wished for traditional face-to-face lessons on the difficult topics of programming. Such topics include arrays, methods, applets, and animations. The exam results indicate that loops were more difficult for students than they themselves evaluated.
CHANGES M ADE IN THE COURSE ARRANGEMENTS On the basis of the analyzed feedback, we have modified our curriculum to better suit the students' potential. The major changes are as follows: • Re-scheduling within Programming, part 1: In order to give more time for the difficult topics of programming, we re-arranged the weekly assignments giving more time for difficult topics. For example, there is now twice the time for learning arrays. • Re-scheduling of courses: we looked at the scheduling of all the courses and modified it so as to avoid having several hard courses going on simultaneously. • Examples and optional exercises: we added new examples and easy optional exercises to the Web material to support individual learning processes and make it easier to pass the weekly exercises. In this way students were supposed to feel successful at programming thus motivating and helping them with their learning process. • Individual feedback: we gave more individual feedback on submitted exercises since some students clearly benefit from more detailed comments. • Visualization: we offered more Jeliot animations particularly on difficult topics (like arrays). The main point was to offer different ways of learning to the students who had difficulty understanding the basics of programming. Our observation confirms the earlier findings [1] that average performers, in particular, found visualizations useful. • Encouraging the use of support measures offered in the learning environment: we encouraged students to communicate with each other, for example, using team activities like dis cussion forums or email, and to ask for help with their learning difficulties.
In virtual courses students learn on their own in a responsible fashion. Students also need the support of tutorteachers, supervisors, and their peers. We found the role of instructional intervention important in our virtual programming course. [8]
INFLUENCE OF CHANGES Let us then look at how the above changes influenced the dropout phenomenon. When we look at the percentage of dropouts, we see the following figures in Table II. The data in Table II show the relative percentage of dropouts compared with the students who started the studies when seen right after the first programming course (Programming, part 1). In the first year, there were no relevant statistics for the students so the percentage 37% is calculated comparing the number of students who did not participate in the exam in December 2000 with those who started their studies in August 2000. TABLE II T HE P ERCENTAGE OF DROPOUTS
Year 2000 2001
Total 37.0% 26.0%
Old area 37.0% 22.7 %
New area 29.5%
In the school year 2001-2002, students have an opportunity to pass only part of the Virtual University course in the first year and the rest with a new group the following academic year. In the first school year 2000-2001 such an opportunity did not exist because it was a pilot project and we did not know whether this Virtual University course would be arranged again the following academic year. This may influence the apparent dropout percentages. In the school year 2001-2002, students are obliged to inform us if they drop out. So the figure of 26% is calculated by comparing the announced dropouts with those who started studying in August 2001. But when we look at these announcements more closely, we see that there is a difference between those who did not participate in the exam and those who have announced they were dropping out. This means that we have not been informed of all the dropouts or that the students are going to complete the programming course later. We wondered whether we could compare these two numbers, 37% and 26%, with each other and so we examined the number of dropouts from a different point of view. In Table III, we can see the percentage of dropouts calculated comparing those who did not participate in the course exam in December with those who started the course in August. The figures shown in Table III show that the relative number of dropouts is decreasing and the number of students who passed is increasing.
0-7803-7444-4/02/$17.00 © 2002 IEEE November 6 - 9, 2002, Boston, MA 32 nd ASEE/IEEE Frontiers in Education Conference T2G-13
Session T2G TABLE III P ARTICIPATION IN P ROGRAMMING, P ART 1 2000 Started course (Step 2) 76 Took part in exam (Step 4) 73.7 % Passed course (Step 5) 60.5 % Dropped out 39.5 %
2001 146 71.2 % 64.4 % 35.6 %
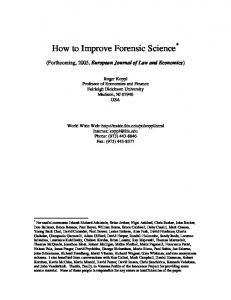
Let us then compare the percentage of dropouts in the new area to the old area. If we look at Table II, we can see that the percentage of dropouts in the new area (29.5%) is clearly higher than in the old area (22.7%). These figures were calculated by comparing the number of dropouts to those who started the Course. We discuss later the factors that might influence the differences between the new and the old area. We were interested in finding out what might influence to the dropout phenomenon and found that students drop out step by step as follows: • Step 1: Students who sign in the Virtual University course. • Step 2: Students who start the Programming, part 1. • Step 3: Students who submit the compulsory number of exercises. • Step 4: Students who take part in the exam. • Step 5: Students who pass the course. We have illustrated this phenomenon in Figure 1. Our target is to reduce the differences between Steps 1 and 2, and between Steps 3 and 4. The first goal means that we hope that all those who become inspired by our virtual curriculum would take part in at least the first programming course even if they do not initially intend to take further courses. Our goal is to show students that they do not know what programming is if they do not even try to study it. We are especially interested in how to encourage female students to try programming. There are few females who sign in the Virtual University and in the school year 2000-2001 the percentage of female dropouts (79%) was clearly larger than that of males (59%). We hope that female students become more enthusiastic towards programming and computer science studies generally. In Figure 1 we can see that for the second year (circles on the right) the differences between Steps 1 and 2 are slightly larger than for the first year (circles on the left). One explanation may be that students have scheduled their studies differently: Many students in 2001 decided to study all the other courses during the first academic year and left programming to the second year. So there might be some students who started in August 2001 and who will pass the course later. When we look at Steps 3 and 4, we can see that in 2000 there were many students who did not take part in the exam although they had returned the compulsory number of
exercises (Step 3 minus Step 4). The second year only two students who had the right to take part in the exam did not do so. We can see this in Figure 1: the dark gray circle (Step 3) on the right has almost disappeared behind the white (Step 4). 2000 2001
Step 1 Step 2 Step 3 Step 4 Step 5
2000 89 85.4 % 81.6 % 73.7 % 60.5 %
2001 184 79.3 % 72.6 % 71.2 % 64.4 %
FIGURE 1 T HE DROPOUT P HENOMENON I LLUSTRATED STEPWISE BY P ERCENTAGES OF P ARTICIPATING STUDENTS
On the other hand, when we look at the figures in Step 4 and Step 5, we can see that the most interesting difference between these two years may have an obvious reason. In 2000 there were as many as 13.2% of students who took part in exam but did not pass the course (Step 4 minus Step 5). In 2001 the analogous percentage is 6.8%. This means that in 2001 students who started the Programming, part 1, passed it better than in the first year. Let us then look the dropout numbers in the new and old areas shown in Table IV. TABLE IV T HE DROPOUT P HENOMENON IN THE NEW AND OLD AREAS DESCRIBED BY P ERCENTAGES OF P ARTICIPATING STUDENTS
Steps Step 1 Step 2 Step 3 Step 4 Step 5
Old area 97 81.4 % 58.8 % 58.8 % 53.6 %
New area 87 77.0 % 56.3 % 54.0 % 48.3 %
When we look at Table IV we can see that in total the participants percentages in the new area are somewhat lower than figures in the old area. This may explain a major part of the difference quoted above.
DIFFERENCES BETWEEN THE NEW AND OLD AREAS
It has been interesting to see that there really is a big difference between the dropout percentages of the old and 0-7803-7444-4/02/$17.00 © 2002 IEEE November 6 - 9, 2002, Boston, MA 32 nd ASEE/IEEE Frontiers in Education Conference T2G-14
Session T2G the new areas, although the areas themselves appear rather similar. We found some factors that may have similarly influenced dropouts in both areas: • Common arrangements: the course arrangements are exactly the same for students in both areas. Same timing, same courses, same information, etc. • Course material: the web-material, visualizations, and exercises are the same for students in both areas. • Individual feedback: there is no difference in feedback for students in the new or old areas. The feedback from exercises or advice concerning email questions or the discussion forum are the same. • Student experience in programming: almost half of the dropouts (40%) in 2000 had no earlier experience programming and the rest of the dropouts had very little relevant experience. So there seems to be a clear negative correlation between earlier experience in programming and a disposition to drop out. Because the percentage of dropouts differs in the new and old areas, there must be some other factors that influence these figures. We suggest the following: • Knowledge that courses are demanding: the old area students have heard comments about courses from the first-year students and have some preconceptions about the courses. Thus, students in the old area are better prepared for the virtual studies. • Experience of tutor-teachers: tutor-teachers in the old area can tell more about arrangements and courses. They can give more useful advice because they have had one year’s experience of the same virtual courses. • Activities: if a student has a problem, any help he or she may receive depends entirely on what he or she does about it. For example, using the discussion forum or email are very good ways of getting help. There were no significant differences between the old and new area students' behavior when discussing in the forum or by email. We assume that the experience of tutor-teachers and knowledge about courses might explain the better figures in the old area shown in Table IV. Furthermore we propose the following factor that has influence to the dropout phenomenon: • Attitudes: both tutor-teachers' and students’ attitudes are very important. If a tutor-teacher has a negative attitude, it has an obvious correlation to the number of dropouts. Similarly, if peers have positive (or negative) attitudes toward virtual studies, it is clearly seen in increasing (or reducing) motivation.
THE ROLE OF TUTOR-TEACHERS We found the role of tutor-teachers to be quite important for success in virtual studies. We sent a questionnaire to 21 tutor-teachers: 10 of them in the new area and 11 in the old area. 18 returned the questionnaire. We wanted to know how a tutor-teacher feels about the role of tutoring in virtual courses, whether a tutor-teacher has some need for support and whether he or she feels that students need more support than he or she can give. We also asked whether he or she has arranged regular meetings in the high school with the Virtual University students. We also asked whether there are any ideas for developing our course arrangements. We assumed that the answers of the first-year tutorteachers might differ from those of the second-year tutorteachers. The differences were actually quite minimal, although some were found. Tutor-teachers in the new area are more qualified and some of them even had quite a negative attitude towards all the tasks given them. It was very clearly seen that tutoring was an uncomfortable task, and comments like “Giving advice is not tutors’ duty” say much about the attitude of some tutors. The percentage of dropouts was correlated with negative attitude of tutorteachers in our data. On the other hand, the reverse situation is also clearly seen: a large number of dropouts reduces the motivation of a tutor-teacher and some tutor-teachers feel really sorry about the dropouts. The tutor-teachers mostly had correct preconceptions about tutoring, based on our tutor-guide and the information meeting. Only two tutors in the new area felt surprised by the tasks to be done. It was very clearly seen that students studied quite independently in both areas and mainly asked the tutor-teacher for help with problems in programming. Then it was not surprising that almost one quarter of the tutor-teachers hoped for an introduction course for Java as well. The tutor-teachers’ programming skills differ from “not at all” to expert. So the support given to the students by a tutor-teacher particularly during programming courses differs very much from school to school. In some schools, the tutorteacher can only encourage students to continue, but in some others he or she can even help with difficult problems in programming. It was also interesting to see that some of the tutorteachers expected students to come and ask them for help. Others asked students how they were getting along with virtual studies and were there any problems. It seems that few tutor-teachers have organized weekly meetings with students. Most of them found it difficult because both the teacher and the students were too busy.
0-7803-7444-4/02/$17.00 © 2002 IEEE November 6 - 9, 2002, Boston, MA 32 nd ASEE/IEEE Frontiers in Education Conference T2G-15
Session T2G CONCLUSIONS In our case study we have focused on developing an improving mechanism for our virtual programming courses. It consist of gathering data by multi-faceted ways like questionnaires to the students and tutor-teachers, analyzing the feedback submitted via the learning environment or email, observing activities of students in the learning environment by supervisors and analyzing data about students’ behavior. Based on all this feedback and data, we managed to improve our virtual programming courses, and the whole Virtual University course as well so that the dropout percentages grew much lower. Stepwise treatment that we have built up helps us to pay our attention to certain groups of students and we look forward to developing an adaptive learning environment to our courses. We aim at improving not only the course materials but also the adaptive observation of students’ learning skills in order to get help for students in their learning difficulties at an appropriate time. While it is well known that first programming courses suffer from serious dropout problems, it is most important to focus research effort in this field. Our case study shows that there are many ways of cutting down the number of dropouts by improving practical arrangements during a virtual computer science course. It also shows that the number high-school dropouts may not be relatively higher than university-student dropouts on courses of a similar level. However, one must be very cautious in generalizing the results of our case study. The action research type of effort will continue, and we hope to show further results in due course.
[5] Haataja, A., Suhonen, J. , Sutinen, E. & Torvinen, S., “High School Students Learning Computer Science over the Web”, Interactive Multimedia Electronic Journal of ComputerEnhanced Learning (IMEJ), 3(2), October 2001. [6] Kluit, P. G., Sint, M. & Wester, F., “Visual Programming with Java: Evaluation of an Introductory Programming Course”, Proceedings of the 6th annual conference on the teaching of computing / 3rd annual conference on integrating technology into computer science education on Changing the delivery of computer science education, Dublin, Ireland, 1998, pp. 143-147. [7] Roberts, E., “An Overview of MiniJava”, Proceedings of the Thirty Second SIGCSE Technical Symposium on Computer Science Education, Charlotte, North Carolina, Feb 21-25, 2001, pp. 1-5. [8] Sutinen, E. & Torvinen, S. “The Instructional Intervention in a Web-based programming course”, Proceedings of the first annual Finnish/Baltic Sea conference on Computer Science Education, Report A-2002-1, October 19-21, Koli, Finland, 2001, pp. 5360.
REFERENCES [1] Ben-Bassat Levy, R., Ben-Ari, M. & Uronen, P.A, “An Extended Experiment with Jeliot 2000”, Proceedings of the First Program Visualization Workshop, Joensuu, Finland, 2001, pp. 131-140. [2] Cornell, R. & Martin, B.L, “The Role of Motivation in WebBased Instruction”, In Khan, B. H. (Eds.), Web-Based Instruction. Educational Technology Publications, New Jersey, USA, 1997, pp. 93-106. [3] Ellis, A., Lowder, J., Robinson, J., Hagan, D., Doube, W., Tucker, S., Sheard, J. & Carbone, A., “A collaborative strategy for developing shared Java teaching resources to support first year programming”, Proceedings of the 4th annual SIGCSE/SICCUE on Innovation and technology in Computer Science Education, Krakow, Poland, 1999, pp. 84-87. [4] Fleyry, A, E., “Programming in Java: Student-Constructed Rules”, Proceedings of the thirty-first SIGCSE technical symposium on Computer Science Education, Austin, TX USA , 2000, pp. 197-201.
0-7803-7444-4/02/$17.00 © 2002 IEEE November 6 - 9, 2002, Boston, MA 32 nd ASEE/IEEE Frontiers in Education Conference T2G-16