emergency response, engineering, planning, training, and public education ... stations online and nearly 400 CGS dialup stations statewide in the CISN.
SMIP02 Seminar Proceedings SHAKEMAP: ITS ROLE IN PRE-EARTHQUAKE PLANNING AND POST-EARTHQUAKE RESPONSE AND INFORMATION
David J. Wald, C. Bruce Worden, and Vincent Quitoriano United States Geological Survey Pasadena, California James Goltz California Governor’s Office of Emergency Services Pasadena, California Abstract ShakeMap was designed primarily as a rapid response tool to portray the extent and variation of ground shaking throughout southern California immediately following significant earthquakes. The system now runs throughout California as well as in the Salt Lake City and Seattle areas, and it is being expanded to populated, seismically active regions nationally as resources permit. For rapid response, ShakeMap ground motion values are used for emergency response and loss estimation, assessment of damage to the lifeline and utility networks, and for providing information to the general public. However, ShakeMap can also be used as a pre-earthquake planning tool by generating ground motion estimates for a suite of potential earthquake scenarios. Estimates based on earthquake scenarios can provide a firm basis for loss estimation on a regional scale as well as provide utilities and other users a means of evaluating their emergency response capabilities. This paper will examine the practical applications of ShakeMap in emergency response, engineering, planning, training, and public education considering both current and future applications. Introduction ShakeMap™ is one of the first and, for emergency management, most significant products of the TriNet project. The TriNet project is named for the three organizations that have collaborated to build a new digital seismic network in southern California: the California Institute of Technology, the State of California, Division of Mines and Geology (now the California Geological Survey, CGS) and the United States Geological Survey. The five- year project to develop, install, and operate the network was completed at the beginning of 2002. In addition to ShakeMap, the “real- time information” products from TriNet are direct results of the new digital seismic and strong motion networks and include the rapid broadcast and web posting of accurate and reliable information on magnitude, location, and aftershock distribution. For more information on TriNet, see both Mori et al. (1998) and Hauksson et al. (2000).
1
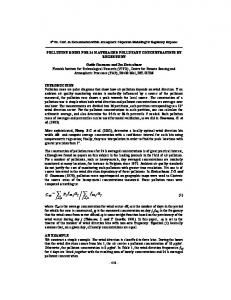
SMIP02 Seminar Proceedings As TriNet funding from FEMA ended at the beginning of 2002, TriNet continued, but under the auspices of the California Integrated Seismic Network (CISN) as a region of the Advanced National Seismic System (ANSS). Funding from the USGS continues, and the State of California Office of Emergency Services (OES) is providing additional funds. CISN statewide coordination inc ludes the three TriNet partners as well as the Menlo Park office of the USGS and the Berkeley Seismological Laboratory (BSL) at the University of California at Berkeley and the OES. Figure 1 shows the distribution of seismic stations for the CISN. As of April 2002, there were approximately 200 real-time stations online and nearly 400 CGS dialup stations statewide in the CISN.
Figure 1. CISN seismic station map. Circles are broadband (yellow), real-time and dialup ShakeMap quality strong- motion (red), non-ShakeMap quality (orange), and weak motion velocity (green) seismometers. Figure courtesy of D. Oppenheimer.
2
SMIP02 Seminar Proceedings A key requirement of the OES funding for CISN is the integration of both northern and southern California seismic networks into a unified sys tem with statewide reporting of earthquakes and built in redundancy, including backup generation of ShakeMap. Currently however, ShakeMap operates and is reported separately in southern and northern California. Ongoing development of ShakeMap is under the auspices of the U.S. Geological Survey’s Advanced National Seismic System (ANSS). Under this program, ShakeMap now runs in southern and northern California, as well as the Seattle and Salt Lake City areas. It will be available in other seismically active regions of the country as sufficient numbers of real-time strong motion stations are installed as outlined in the ANSS strategic plan (U.S. Geological Survey, 2000), if funds become available. Making a ShakeMap ShakeMap relies primarily on observed ground motion shaking levels determined rapidly from free- field strong motion seismic instruments. Within the first minute following an earthquake, ground- motion parameters are available from the real-time component of the network and within several minutes most of the important near-source dial-up stations contribute. Initial maps are made with just the real- time (continuouslytelemetered) component of CISN, but they are updated automatically as more data are acquired. Parametric data from the stations include peak ground acceleration (PGA), peak ground velocity (PGV), and peak response spectral amplitudes (at 0.3 sec, 1 sec, and 3 sec). At the same time, maps of instrumental intensity are generated through relationships between recorded ground- motion parameters and expected shaking intensity values (Wald et al., 1999a) developed specifically for ShakeMap. Production of the maps is automatic, triggered by any significant earthquake in California (see Wald et al., 1999b, for more details). Figure 2 presents an example of the data and processing that produce a ShakeMap, in this case for the 1999 Hector Mine, California earthquake. The first panel of the figure shows an sample of the variety of site soil conditions in southern California, and the variability of seismic station distribution depending on proximity to urban areas. Estimation of shaking over the entire affected region is obtained by the spatial interpolation at sites in between the measured ground motions with geologically based frequency- and amplitude-dependent site corrections. Site conditions become an important part of the ShakeMap pattern, particularly where the network is sparse and fewer data are available. We use CGS maps of National Earthquake Hazard Reduction Program (NEHRP) classification site conditions as the basis for our site corrections. These site condition maps have coverage throughout the state at 1:250,000 scale (Wills et al., 2000). Since this event was centered in a remote area there were few near- fault seismic stations. Initially, ShakeMap ground motions in the near-source region, and other areas without seismic stations, were estimated using an empirical ground motion regression with distance measured from the epicentral location. Later, as information about fault
3
SMIP02 Seminar Proceedings dimensions became available (in the form of aftershocks, source rupture models, and observed surface slip), the fault location and rupture dimensions were employed as the basis for ground motion estimation in the near-source region. The second panel shows the results of interpolated data and estimated amplitudes to produce a map of peak ground motions.
Figure 2. Making a ShakeMap. The example is based on the TriNet ShakeMap for the 1999 Hector Mine, California, earthquake. Triangles show station locations; the epicenter is show with a star, and contours show peak ground acceleration in percent “g”. Red lines depict faults; black lines indicate highways. See text for details.
4
SMIP02 Seminar Proceedings Note that while the near-source ground motions relied on the ShakeMap system’s built in predictive tools, well populated areas had good station coverage, so the observed level of shaking there was well-established and available within 4 minutes of the earthquake. That is, while the predictive component of the map improved with time as additional information became available about the earthquake source, shaking reported for the urban areas was well constrained and did not change from the initial maps. The third panel shows the estimate of seismic intensity throughout the region based on the relations established for computing instrumental intensity from peak ground acceleration and velocity as provided by Wald et al. (1999a).
Figure 3. Peak ground acceleration ShakeMap for the 1999 Hector Mine, California Earthquake. Triangles are real- time USGS/Caltech (blue), dial- up CGS (orange), and USGS National Strong Motion Instrument Programs (NSMP) stations (green). Contours of acceleration are given in percent “g”. The epicenter is depicted with a red star, mapped faults are shown in red, and the major roadways are given in black. Note there are few stations in the epicentral region.
5
SMIP02 Seminar Proceedings ShakeMap Examples In this section we highlight ShakeMaps made for significant earthquakes in each of the past three years. These and other examples are best viewed interactively online on the ShakeMap Web pages (http://www.shakemap.org). Links found on the ShakeMap Web pages contain an archive of all ShakeMaps made to date as well as for major events that occurred prior to the advent of TriNet. These earlier events, e.g., the 1994 Northridge earthquake, were produced with the existing analog data recorded then but processed using the current ShakeMap tools and methodology.
Figure 4. Instrumental Intensity ShakeMap for the October 16, 1999 magnitude 7.1 Hector Mine, California Earthquake.
6
SMIP02 Seminar Proceedings 1999 Hector Mine, California Earthquake ShakeMaps have been generated in southern California since March 1997. The largest event to be recorded by the new TriNet system and mapped using ShakeMap was the October 16, 1999, magnitude 7.1 Hector Mine earthquake (see Fig. 4). Fortunately, the earthquake occurred in a remote area of the Mojave Desert, so little damage and few injuries were reported. Nevertheless, it was a good opportunity to evaluate the network and test the timeliness and quality of its products. Since the event occurred in a sparsely populated region, the spacing of seismic stations in the near- fault region was also sparse. The performance of ShakeMap could be assessed under conditions that might prevail in a more urban earthquake for which near- fault stations might not immediately report due to power or communications failures. The TriNet real-time system determined a magnitude (energy magnitude) of 7.0 within 1 minute of the event, and ShakeMap was successfully produced and distributed within 4 minutes. The ground motion from the Hector Mine event was widely felt in urban Los Angeles and, based on past experience, responders, the media and public had legitimate concerns regarding its source and potential damage. The ShakeMap provided rapid evidence that large-scale emergency response mobilization was unnecessary. The ShakeMap also highlighted areas of amplified ground motion in the Coachella Valley and focused attention on numerous triggered events under the Salton Sea that were within 2 km of the San Andreas fault. 2000 Napa Valley (Yountville), California Earthquake While moderate in size at magnitude 5.1, the September 3, 2000 Yountville earthquake caused significant damage in the city of Napa. The event occurred in the mountains 6 miles northwest of the city of Napa, near Yountville, California. As shown in Figure 5, the strongest shaking recorded was just north of the city of Napa. The recorded acceleration there was 50 percent of the force of gravity, rather high for this magnitude, but consistent with the significant damage that the city suffered. Although earthquake shaking levels depend predominantly on the distance from the earthquake source, the high level of ground shaking in Napa appears to have been controlled by two other factors: first, the amplification of shaking by young sediments along the Napa River which shows as a topographic low on the ShakeMap intensity Map (Figure 5) and second, the focusing of strong motion to the southeast, the direction the earthquake rupture appears to have propagated. The offset of the strongest shaking to the southeast from the epicenter, and the amplification within the basin of sediments underlying Napa and along the northern shore of San Pablo Bay are also clear on the map of instrumental intensity. ShakeMap quality strong motion instrumentation coverage in the San Francisco Bay area has also substantially improved since the 2000 Napa earthquake, so future earthquakes will have better station control.
7
SMIP02 Seminar Proceedings
Figure 5. Instrumental Intensity ShakeMap for the magnitude 5.1 Napa Valley (“Yountville”) earthquake on September 3, 2000. 2001 Seattle (Nisqually), Washington Earthquake Figure 6 shows an example of a ShakeMap for the largest event to date to occur in a region of the country outside of California making ShakeMaps. While the 2001 Nisqually, Washington earthquake was of comparable magnitude to the 1994 Northridge earthquake, the depth of the rupture was much greater—near 50 km. In contrast, the Northridge earthquake rupture was as shallow as 5 km. Primarily as a result of this greater depth, the Nisqually earthquake caused approximately $1/2 billion of damage compared to $40 billion in losses due to the Northridge earthquake.
8
SMIP02 Seminar Proceedings
Figure 6. Example ShakeMap in the Pacific Northwest ANSS Region for the 2001 Nisqually, Washington (M6.8) earthquake. Open triangles depict station locations. Note correspondence of intensity of shaking and basin and lowland areas as revealed by the topographic basemap. The Nisqually earthquake occurred shortly after a major upgrade to the seismic network in the ANSS Pacific Northwest region, and the ShakeMap system in the Seattle region was installed but not fully operable at the time of the quake. Nonetheless, with substantial efforts, ShakeMaps were made available within a day of the event. The
9
SMIP02 Seminar Proceedings ShakeMap in Figure 6 highlights the utility of comparing shaking intensity atop topographic relief. Since the topography serves as a proxy for site conditions (basins are typically flat, low- lying areas and steep mountains typically are rock), areas of amplified shaking usually correlate well with areas of low relief. Current Applications of ShakeMap ShakeMap originated primarily as an Internet-based system for real-time display (see http://www.shakemap.org). While the maps on the Web site are the most visible result of ShakeMap system, they are just one representation of the ShakeMap output. ShakeMap produces grids of acceleration and velocity amplitudes, spectral response values, instrumental intensities, GIS files and a host of other products for designed specific users. In this section, we describe these other products and show how they are being distributed and utilized by different user groups. A summary of the products available on the ShakeMap Web pages for each earthquake is shown in Figure 7. Emergency Response The distribution of shaking in a large earthquake, whether expressed as peak acceleration or intensity, provides responding organizations a significant increment of information beyond magnitude and epicenter. Real-time ground shaking maps provide an immediate opportunity to assess the scope of an event, that is, to determine what areas were subject to the highest intensities and probable impacts as well as those which received only weak motions and are likely to be undamaged. These maps will certainly find additional utility in supporting decision- making regarding mobilization of resources, mutual aid, damage assessment, and aid to victims For example, the Hector Mine earthquake of October 16, 1999 provides an important lesson in the use of ShakeMap to assess the scope of the event and determine the level of mobilization ne cessary. This earthquake produced ground motion that was widely felt in the Los Angeles basin and, at least in the immediate aftermath, required an assessment of potential impacts. It was rapidly apparent, based on ShakeMap, that the Hector Mine earthquake was not a disaster and despite an extensive area of strong ground shaking, only a few small desert settlements were affected. Thus, mobilization of a response effort was limited to a small number of companies with infrastructure in the region and brief activations of emergency operations centers in San Bernardino and Riverside Counties and the California Office of Emergency Services, Southern Region. Had a magnitude 7 earthquake occurred in urban Los Angeles or another urban area in California, ShakeMap could have been employed to quickly identify the communities and jurisdictions requiring immediate response. A ShakeMap driven calculation of estimated regional losses would provide focus to the mobilization of resources and expedite the local, state, and federal disaster declaration process, thus initiating the response and recovery machinery of government. ShakeMap, when overlaid on maps featuring critical facilities (e.g. hospitals, police and fire stations, etc.), highways and bridges and vulnerable structures, provides an important means of prioritizing response. Such response activities include: shelter and mass care, search and rescue, 10
SMIP02 Seminar Proceedings medical emergency services, damage and safety assessment, utility and lifeline restoration and emergency public information.
Figure 7. Example of the ShakeMap Download web page. A separate page like this is available for each earthquake. To help facilitate the use of ShakeMap in emergency response, ShakeMap is now provided to organizations with critical emergency response functions automatically through the Internet with “push” technology. These organizations and utilities include the State of California OES, the Los Angeles County Office of Emergency Management, Southern California Edison and the Metropolitan Water District. ShakeMap ground motion maps are now also customized and formatted into Geographic Information Systems (GIS) shapefiles for direct input into the FEMA’s U.S. (HAZUS) loss estimation software. These maps are rapidly and automatically distributed to the California Office of Emergency Services (OES) for computing HAZUS loss estimates and for coordinating
11
SMIP02 Seminar Proceedings State and Federal response efforts. This is a major improvement in loss estimation accuracy since actual ground motion observations are used directly to assess damage rather than relying on simpler estimates based on epicenter and magnitude alone as was customary. In addition to GIS formatted maps specifically design for HAZUS, we also make shapefiles for more general GIS use. These layers are fundamental as base maps upon which one can overlay a user’s infrastructure or inventory. For example, ShakeMaps are also being distributed to regional and state utility providers to enable them to determine areas of their networks that may have sustained damage. Using GIS systems, quick analyses of the situation is possible, and decision- making is greatly facilitated. These GIS maps for both recent and past earthquakes are now routinely used by Insurance, Engineering, Financial institutions, and others. Public Information and Education The rapid availability of ShakeMap on the Internet combined with the urgent desire for information following a significant earthquake makes this mapping tool a compelling source of emergency public information and education. In instances in which an earthquake receives significant news coverage, the ShakeMap site as well as the Community Internet Intensity Map 1 (which poses the question, “Did you feel it?”) may receive an enormous increase in website visitors. On October 16, 1999, local television stations devoted considerable airtime to the Hector Mine earthquake. During live news briefings, Caltech and USGS scientists employed ShakeMap to discuss the event, invited viewers to visit the ShakeMap website and posted the web address prominently above the podium in the Media Center. By the end of the day, the ShakeMap website had received over 300,000 visitors. Even for small events rapid and reliable earthquake information is important. For instance, on January 13, 2001, when two magnitude 4 events, centered in the northeast San Fernando Valley area of Los Angeles, were followed by local news coverage, web visits peaked at 233 hits per second. Acknowledging the importance of ShakeMap as a tool for public information and education, we developed a “TV” ShakeMap in cooperation with regional news organizations. This version of ShakeMap represents a substantial simplification of the “official” map that appears on the ShakeMap website. Based on recommendations of news representatives, acceleration and velocity were omitted from the TV version of ShakeMap. Concern that magnitude and intensity might be confused prompted removal of Roman numerals representing intensity and intensity was depicted using only the color bar. Magnitude and location were enlarged and posted at the top of the map (see Figure 10). 1
Invites web visitors (http://pasadena.wr.usgs.gov/shake) to record their observations on a questionnaire and the data obtained are aggregated to establish a zip code-based intensity profile for the event (See Wald et al., 1999c, for more details). 12
SMIP02 Seminar Proceedings The ShakeMap for television audiences was developed specifically to encourage broadcast journalists to provide a more accurate depiction of earthquakes in news reports. Prior to ShakeMap, the typical visual representation of an earthquake consisted of a map overlay with the epicenter and radiating concentric rings to represent ground motion. The patterns of ground motion are not symmetrical as suggested by these illustrations and represent an underutilization of available technology by the news media. Use of ShakeMap to discuss an earthquake that has just occurred not only provides a more accurate image of earthquake ground motion patterns, it also provides important additional information regarding the potential severity of shaking that is useful both to residents of the area impacted and those outside the area who are concerned about friends and family. ShakeMaps are now reaching a much wider audience through television broadcasting than would be possible through the Internet alone. As an example, a recent magnitude 4.2 earthquake near Valencia on January 28, 2002, was felt throughout the San Fernando Valley and northern Los Angeles basin, occurred at 9:54 pm. At least one local news organization lead the 10 o’clock News with a ShakeMap image providing information about the distribution of shaking to millions of viewers only six minutes after the shaking. Earthquake Engineering and Seismological Research For potentially damaging earthquakes, ShakeMap also produces response spectral values for use not only in loss estimation as mentioned earlier, but also for earthquake engineering analyses. Response spectra for a given location are useful for portraying the potential effects of shaking on particular types of buildings and structures. Following a damaging earthquake, ShakeMaps of spectral response will be key for prioritizing and focusing post-earthquake occupancy and damage inspection by civil engineers. In additio n to providing information on recent events, ShakeMap Web pages provide maps of the shaking and ground motion parameters for past significant earthquakes. Engineers can use these maps to understand the maximum and cumulative effects of seismic loading for the life of any particular structure. This is particularly relevant given the recent discovery of the potential damage to column/beam welds in steel buildings following the 1994 Northridge earthquake. In seismological research, ShakeMap has been proven particularly effective in gaining a quick overview of the effects of geological structure and earthquake rupture processes on the nature of recorded ground motions. ShakeMaps showing the distribution of recorded peak ground acceleration and velocity overlain on regional topography maps allow scientists to gauge the effects of local site amplification since topography is a simple proxy for rock versus deep basin soil site conditions. This can lead to more detailed investigations into the nature of the controlling factors in generating localized regions of damaging ground motions.
13
SMIP02 Seminar Proceedings Planning and Training: ShakeMap Earthquake Scenarios In planning and coordinating emergency response, utilities, local government, and other organizations are best served by cond ucting training exercises based on realistic earthquake situations—ones that they are most likely to face. Scenario earthquakes can fill this role. The ShakeMap system can be used to map ground motion estimates for earthquake scenarios as well as real data. Scenario maps can be used to examine exposure of structures, lifelines, utilities, and transportation conduits to specific potential earthquakes. ShakeMap automatically includes local effects due to site conditions. The ShakeMap Web pages now have a special section under the Map Archives pages that display selected earthquake scenarios (www.trinet.org/shake/archive/scenario/html). Additional scenario events will be supplied as they are requested and generated. To contact the ShakeMap Working Group, please use the comment form available on the Web site.
Figure 8. Northridge Earthquake ShakeMap (Left) and scenario earthquake (Right) for the Northridge earthquake made by assuming the correct magnitude and fault rupture area shown projected to the surface (black rectangle). Given a selected event, we have developed tools to make it relatively easy to generate a ShakeMap earthquake scenario. First we need to assume a particular fault or fault segment will (or did) rupture over a certain length or segment. We then determine the magnitude of the earthquake based on assumed rupture dimensions. Next, we estimate the ground shaking at all locations in the chosen area around the fault, and then represent these motions visually by producing ShakeMaps. The scenario earthquake ground motion maps are identical to those made for real earthquakes---with one exception: ShakeMap scenarios are labeled with the word “SCENARIO” prominently displayed to avoid potential confusion with real earthquake occurrences (see Figure 9). At present, ground motions are estimated using empirical attenuation relationships to estimate peak ground motions on rock conditions. We then correct the amplitude at that location based on the local site soil (NEHRP) conditions as we do in the general 14
SMIP02 Seminar Proceedings ShakeMap interpolation scheme. Finiteness is included explicitly, but directivity enters only through the empirical relations. As an example of the effectiveness of the scenario generation process, Figure 8 shows both the observed ShakeMap for the 1994 Northridge earthquake (left) and a estimated ShakeMap scenario (right) computed with the same earthquake source information assumed in the typical scenario calculations: the magnitude and geometry of the fault that slipped. In this case the dimensions of the Northridge rupture are known from analyses of the earthquake source (e.g., Wald et al., 1996). In the current ShakeMap scenarios, we do not explicitly include the effects of rupture directivity, which has been shown to concentrate energy and the strongest shaking away from the hypocenter and in the direction that the fault rupture progresses. In Figure 8, the observed shaking from the Northridge earthquake (left) has more energy in the region northwest of the epicenter than the scenario version (Figure 8, right). This is due to the fact that the earthquake indeed exhibited northwestward directivity, and ShakeMap includes this only in an average sense in the predictions for the scenario. However, much of the shaking pattern is recovered just by knowing the dimensions of the fault that ruptured. In the case of strike slip earthquakes like the Newport-Inglewood and San Andreas fault (Ft. Tejon) scenarios, directivity can be quite severe, so depending on where the actual epicenter is, the shaking pattern might be skewed toward stronger shaking away from the epicenter than is shown in are scenarios. Likewise, the ground motion estimates we use for the scenarios are median values, and real data will have greater amplitude variations, potentially over small spatial scales. Our ShakeMap earthquake scenarios are an integral part of emergency response planning. Primary users include city, county, state and federal government agencies (e.g., the California Office of Emergency Services, FEMA, the Army Corp of Engineers) and emergency response planners and managers for utilities, businesses, and other large organizations. Scenarios are particularly useful in planning and exercises when combined with loss estimation systems such as HAZUS and the Early Post-Earthquake Damage Assessment Tool (EPEDAT), which provide scenario-based estimates of social and economic impacts. Depending on the level of complexity needed for the scenario, event-specific factors such as directivity and variable slip distribution could also be incorporated in the amplitude estimates fed to ShakeMap. Scenarios are of fundamental interest to scientific audiences interested in the nature of the ground shaking likely experienced in past earthquakes as well as the possible effects due to rupture on known faults in the future. In addition, more detailed and careful analysis of the ground motion time histories (seismograms) produced by such scenario earthquakes is highly beneficial for earthquake engineering considerations. Engineers require site-specific ground motions for detailed structural response analysis of existing structures and future structures designed around specified performance levels. In the near future, these scenarios will also provide synthetic time histories of strong ground motions that include rupture directivity effects.
15
SMIP02 Seminar Proceedings The U.S. Geological Survey has evaluated the probabilistic hazard from active faults in the United States for the National Seismic Hazard Mapping Project. From these maps it is possible to prioritize the best scenario earthquakes to be used in planning exercises by considering the most likely candidate earthquake fault first, followed by the next likely, and so on. Such an analysis is easily accomplished by hazard disaggregation, in which the contributions of individual earthquakes to the total seismic hazard, their probability of occurrence and the severity of the ground motions, are ranked. Using the individual components ("disaggregations") of these hazard maps, a user can properly select the appropriate scenarios given their location, regional extent, and specific planning requirements.
Figure 9. An example Scenario Earthquake ShakeMap based on a hypothetical magnitude 6.9 rupture on the Newport-Inglewood fault in Los Angeles. Note that the 16
SMIP02 Seminar Proceedings word “Scenario” is featured quite prominently to avoid confusing ShakeMap Scenarios with the real thing. An example of a ShakeMap scenario earthquake is shown in Figure 9 for a hypothetical magnitude 7.1 earthquake on the Newport-Inglewood fault near Los Angeles. Due to the proximity to populated regions of Los Angeles, this scenario represents one the most destructive earthquakes that could impact the region. The U.S. Army Corp of Engineers recently used an event similar to this scenario for evaluating their capacity to respond to such a disaster and to continue to build cooperative relationships with other Federal, State, and local emergency response partners.
Figure 10. Scenario ShakeMap intensity based on a repeat of the great magnitude 7.8 Fort Tejon, California, earthquake which occurred in 1857. This format of the ShakeMap is the “TV” version, with larger text and features and a simplified legend suitable for television broadcasting. The next example of a scenario earthquake represents a repeat of the great 1857 Fort Tejon earthquake. The length of the rupture is well established from paleoseismological studies. This scenario represents a rough estimate of the possible shaking 17
SMIP02 Seminar Proceedings distribution for southern California’s “Big One”. The scenario, shown in Figure 10, is portrayed in the “TV” ShakeMap format, which simplifies the legend for a more general audience as well as accommodates the lower resolution aspects of TV screens compared to comput er monitors. These and other scenarios are available online at the ShakeMap web pages. They are formatted the same as other ShakeMaps, so they too can be easily used in for response planning and loss estimation as well as for educational purposes. They can be found from the Map Archive link at the top of all ShakeMap Web pages.
Figure 11. Scenario ShakeMap Web pages for southern California. Events are added upon request (see Comment link on Web pages). Future Developments Ongoing development involves automatically generated, interactive GIS applications for ShakeMap users who are either familiar with or who have expertise in GIS tools and applications. We are implementing both server-side and client-side applications to ensure both diversity of GIS tools and robust access during the immediate
18
SMIP02 Seminar Proceedings post earthquake time period. Server-side tools allow fully interactive overlays of a variety of ShakeMap parameters and maps with a wide range of regional infrastructure, but their availability cannot be guaranteed in the minutes immediately following a damaging earthquake due extreme demands on the server. In contrast, client-side GIS applications are less versatile, but can be made robust by rapidly and automatically delivering the ShakeMap GIS content (shapefiles) to users. These interfaces will be available in the near future. ShakeMap software has been developed for reliable and robust operation. In addition, the software architecture was designed to be directly portable to other regions of the country. Operating ShakeMap systems now in place cover California as well as the Seattle and Salt Lake City areas. As more seismometers are installed under the Advanced National Seismic System, ShakeMap coverage will be expanded. Regions that will likely come online in the near future include the environs of Memphis Tennessee, Anchorage Alaska, Reno Nevada, and Puerto Rico. Conclusions ShakeMap is a powerful tool that provides a detailed, graphical summary of ground shaking due to earthquakes. Following a major earthquake, it can be put to use by emergency responders to identify the areas most likely to have suffered heavy damage. Efforts are being made to add dedicated links to more government agencies and utilities providers to ensure that the data are received and to provide data in formats that enable them to utilize the information in existing response systems. In connection with probabilistic hazard maps, ShakeMaps based on earthquake scenarios can also be used to identify points of exposure in lifelines and major structures and to evaluate emergency response plans. By producing a wide range of products and maps, ShakeMap is also of value to earthquake engineers and earth scientists, as well as the general public through the Internet and the News media. Acknowledgements ShakeMap is one important end product of a very sophisticated seismic network. It can only be produced within the context of a robust, real-time seismic operation. It is to the credit of all involved with the networks including those within the CGS, Caltech, USGS, U.C. Berkeley, and other contributors. References Hauksson, E., P. Small, K. Hafner, R. Busby, R. Clayton, J. Goltz, T. Heaton, K. Hutton, H. Kanamori, J. Polet, D. Given, L. M. Jones, and D.J. Wald (2001). Southern California Seismic Network: Caltech/USGS Element of TriNet, submitted to Seismological Research Letters.
19
SMIP02 Seminar Proceedings Mori, J., H. Kanamori, J. Davis, E. Hauksson, R. Clayton, T. Heaton, L. Jones, and A. Shakal (1998). Major improvements in progress for southern California earthquake monitoring, EOS, 79, 217-221. U.S. Geological Survey (2000). Requirement for an Advanced National Seismic System U.S. Geological Survey Circular 1188, 55 pages. Wald, D. J., T. Heaton, and K. W. Hudnut (1996). Rupture history of the 1994 Northridge, California earthquake from strong-motion, GPS, and leveling data, Bull. Seism. Soc. Am., 86, S49-S70. Wald, D. J., V. Quitoriano, T. Heaton, and H. Kanamori (1999a). Relationships between Peak Ground Acceleration, Peak Ground Velocity and Modified Mercalli Intensity in California, Earthquake Spectra, 15, 557-564. Wald, D. J., V. Quitoriano T. Heaton, H. Kanamori, C. W. Scrivner, and C. B. Worden (1999b). TriNet ‘ShakeMaps'’: Rapid Generation of Instrumental Ground Motion and Intensity Maps for Earthquakes in Southern California, Earthquake Spectra, 15, 537-556. Wald, D. J., V. Quitoriano, L. Dengler, and J. W. Dewey (1999c). Utilization of the Internet for Rapid Community Intensity Maps, Seism. Res. Letters, 70, No.6, 680697. Wills, C. J., M. D. Petersen, W. A. Bryant, M. S. Reichle, G. J. Saucedo, S. S. Tan, G. C. Taylor, and J. A. Treiman (2000). A Site Conditions Map for California Based on Geology and Shear Wave Velocity, Seism. Res. Lett., 71, 248.
20