experimentally observed (through shaking table tests) dynamic behaviors of two scaled models of steel frame buildings structures: one symmetric and one ...
13th World Conference on Earthquake Engineering Vancouver, B.C., Canada August 1-6, 2004 Paper No. 1248
SHAKING TABLE TESTING OF SYMMETRIC AND ASYMMETRIC THREE-STOREY STEEL FRAME STRUCTURES T. Trombetti1, P. Barrasso1, A. Crewe2, M. De Stefano3, G. Gasparini1, R. Nudo3, A. Rutenberg4, S. Silvestri1, C. Taylor2
SUMMARY This paper presents the results of a comparison study performed between the numerically predicted and experimentally observed (through shaking table tests) dynamic behaviors of two scaled models of steel frame buildings structures: one symmetric and one asymmetric in plan. The shaking table tests were carried out at the Earthquake Engineering Center of the University of Bristol. The models were designed and built to be representative of steel buildings designed according to the Eurocodes 3 and 8 (EC3 and EC8). Both 1/5 scale models have a rectangular layout of 2000mm (xdirection) by 1500mm (y-direction). The models consist of two three-storey frames arranged lengthways along the plan. Interstorey height is 700mm. Additional masses (made up of lead bars) were placed on each storey in order to simulate the appropriate mass distributions, to obtain the desired symmetric and asymmetric models. The eccentricity between the center of mass and center of stiffness is about 10% of the side length along the longitudinal (x-) direction. The models were tested using as base inputs the EW and NS components of the El Centro 1940 earthquake ground motion simultaneously applied along the xand y- directions respectively. These seismic excitations were scaled at various levels in order to first test the model in its linear elastic behavior and then to bring it to its non linear behavior. The results obtained experimentally are compared with their numerical counterparts, obtained through a three-dimensional linear and non-linear modeling, performed using 3-node quadratic spatial beam elements for the columns, 2-node linear spatial beam elements for the girders, and 4-node doubly curved shell elements for the floor slabs. The numerical and experimental comparison indicates that a careful numerical modeling of the structure (especially of the connections between columns and floor slabs) is necessary to correctly simulate and understand the experimental data.
1
DISTART – Università degli Studi di Bologna – viale Risorgimento, 2 40136 Bologna BO Italy University of Bristol – UK 3 DICOS – Università degli Studi di Firenze – Piazzale Brunelleschi, 4 Firenze FI Italy 4 Technion - Israel Institute of Technology, Haifa, Israel. 2
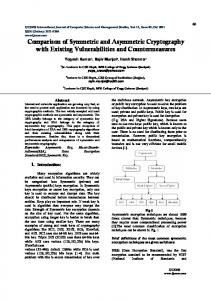
INTRODUCTION In past earthquakes, collapse or severe damage to many buildings was due to asymmetry in the lateral load resisting system, or horizontal irregularity. For example, damage statistics from the September 1985 Mexico Earthquake show that up to 50% of failures could be attributed, directly or indirectly to asymmetry. During the last two decades extensive research effort has been devoted to studying the effects of asymmetry which, in brief, lead to lateral-torsional coupling of the buildings response, and to concentration of damage in some resisting elements, mainly the ones located at the edges [1]. According to a report of the European Association of Earthquake Engineering (EAEE) Task Group (TG) 8 most of the available studies present parametric numerical analyses of the seismic response of simple one-storey building models in the elastic as well as in the inelastic range. The more recent studies following this approach, consider the inelastic response of one-storey building models under bi-directional excitation. Up to date, only a few studies have presented analyses of the seismic response of simple multi-storey building models. Fig 1 shows the number of scientific papers published, per year, regarding the dynamic response of asymmetric structures; most of these studies are numerical investigations. The results of the large number of analytical studies have not been practically validated by experimental testing programs using either scale models or full scale testing. The only significant experimental program that has been carried out is the one conducted at the shaking table facility of the Earthquake Engineering Research Center of the University of Bristol early in the nineties. A series of parametrically defined small scale models were tested under different earthquake records, that were exciting the models in the elastic range of behavior. The capability of modal analysis and of time history analysis to predict test response was checked. The lack of experimental validation of theoretical research is a serious limitation of present design approaches, and unless resolved is likely to hamper the updating process of earthquake design provisions of irregular structures. The recognition that lack of experimental validation of theoretical research findings was hampering progress in understanding the seismic response of irregular structures led to the study described in this paper. Several shaking table tests on scale models of multistorey steel buildings have been initiated by the EAEE TG8 and carried out on the shaking table in the Earthquake Engineering Research Center of University of Bristol (UK) within the framework of the EU Capital and Mobility Programme for the Access to Large Facilities. The following were the main goals of the test program: 1) understanding the behavior of asymmetric steel frame buildings; 2) comparing the response of symmetric and asymmetric building models; 3) assessing the applicability of the torsional provisions of major seismic codes; 4) verify the predictive capabilities (for maximum rotations) of a simplified approach to the torsional phenomena referred to as “alpha” method.
Fig. 1: Number of scientific papers regarding the response of asymmetric structures published per year.
BUILDING MODELS Two building models were designed and constructed. The first one was a symmetric three storey 1/5 scale model with respect to its prototype. Shaking table tests of a symmetric building model were needed in order to provide a reference to which results from the asymmetric building model could be compared. Fig. 2 shows the geometrical characteristics of the building model (and prototype) and Fig. 3 shows the actual model of the shaking table. The symmetric model The mass distribution, corresponding to the presence of a composite steel-concrete floor slab and to the live loads specified by the Eurocode 8 is characterized by the parameters reported in Table 1. The value of these parameters were matched in the laboratory by using a steel plate (1500 x 2000 mm2) with thickness of 10 mm and by properly distributing 100 lead blocks, each of them weighing 25 Kg, as shown in Fig. 4, where SC and MC denote stiffness and mass centre, respectively. By design they are both at the geometric center of the floor. Model design The building model was designed according to the Eurocode (EC) 3 (design of steel structures) and Eurocode (EC) 8. It was decided to design the building model using the EC8 design spectrum for medium-stiff soil (soil type B). The following parameters were selected in order to define the design spectrum: • PGA/g = normalized peak ground acceleration = 0.35; • q = behavior factor = 6; • S = soil parameter = 1; It was also decided, for the sake of simplicity in model construction, that the column sections remain constant along the height. Members were sized as follows: All beams were squared hollow sections 40x40, with t = 3.0 mm; All columns sections are constant along the height, with the following characteristics: • corner columns: rectangular hollow sections 60x40, t = 3.0 mm; • central columns: square hollow sections 50x50, t = 3.0 mm. Preliminary numerical evaluations of the dynamic properties of this model were performed using the computer program SAP 2000 and led to the results presented in Table 2. Connections Welded connections were used, as shown in Figure 5. In particular: • 4 mm welds for beams of frames 1,2 and 3 (L = 1.5 m); • 3 mm welds for beams of frames 5 and 5 (L = 1.0 m). The first storey columns are strengthened at the bottom end and bolted to the steel plate of the shaking table (bolts Φ 12 mm), as shown in figure 6. The accurate modeling of both connections and welds will prove fundamental for the correct interpretation of the experimental results. Asymmetric model The second building model was asymmetric. Asymmetry was obtained by shifting the mass center (MC) from the stiffness center (SC) by a distance “e” equal to 10 % of the plan dimension along the x-direction: that is 20 cm.
In order to obtain the fixed value of mass eccentricity, while keeping the total mass and mass radius of gyration about MC constant, the mass distribution shown in Fig. 4 was made. As it can be seen from Table 3 (which reports the characteristics of the asymmetric model), this mass distribution closely matches the target mass eccentricity and mass radius. In order to investigate the effects of mass asymmetry in the absence of torsional provisions, it was decided to size the structural members as for the symmetric building model. In other words, this second model was tested with the aim of assessing the effects of mass asymmetry per se, i.e., without including the effects of code torsional provisions. Results obtained from this model can form a reference to which the response improvements provided by torsional provisions of the code could be fully evaluated. Preliminary numerical evaluations of the dynamic properties of this model were performed using the computer program SAP 2000 and led to the results presented in Table 4. Table 1: characteristics of the symmetric model
Mass Eccentricity Total Story Weight Translational Mass Rotational Mass
26.84 [KN] 0.02736 [KN x sec2 / cm] 142.5 [KN x sec2 / cm]
Table 2: Dynamic characteristics of the symmetric model (from preliminary evaluations) MODE Frequency (Hz) Period (sec) 1 1.851 0.540 2 2.084 0.480 3 3.288 0.304 4 7.090 0.141 5 11.66 0.086 6 13.13 0.076 Table 3: characteristics of the asymmetric model
Mass Eccentricity Total Story Weight Translational Mass Rotational Mass
- 29.56 cm 26.84 [KN] 0.02736 [KN x sec2 / cm] 142.9 [KN x sec2 / cm]
Table 4: Dynamic characteristics of the symmetric model (from preliminary evaluations) MODE Period (sec) 1 0.550 2 0.480 3 0.299 4 0.142 5 0.084 6 0.076
Fig. 2: Characteristics of prototype and model
Fig. 3: Three-dimensional representation of the model
Modello simmetrico Symmetric Model
Modello asimmetrico Asymmetric Model
CM = CR
CR
200 cm
200 cm
blocco 25kg Single singolo block = w 25=kg
blocco singolo w =kg25kg Single block = 25
blocco w 50 = 50kg Doubledoppio blodk = kg
blocco = 50kg Doubledoppio blodk =w50 kg blocco triplo = 75 w =kg75kg Triple block
Fig. 4: Distribution of blocks: symmetric and asymmetric models
3 mm Saldatura welds 3 mm
4Saldatura mm 4 mm welds
Frames 1, 3 1,2,3 Saldatura per2,i telai
Frames 4, 5
Saldatura per i telai 4,5
Fig. 5: Weldings in the model
150 cm
150 cm
CM = 20cm
10 30 10
10
30 15
40
30
50
10
10
10 30 10
29
92
29
150
150
150
foro Ø12.5 Hole Φ 12.5 mm
150
Fig. 6: Column connections to the steel base (shake table plate)
MODEL INSTRUMENTATION The model and the table were instrumented with 10 accelerometers, 12 displacement transducers and 25 strain gauges. Each floor of the model was instrumented according to the schematic representation of Fig. 7. All instruments represented in Fig. 7 (with the exception of the displacement transducer attached to column 4) were installed at all three floors; the displacement transducer attached to column 4 was applied to the third floor only. Two displacement transducers and three accelerometers were also attached to the shaking table in order to measure the displacements along the X and Y directions and the accelerations along the X, Y and Z (vertical) directions. Two additional accelerometers, measuring the table response along the X direction were adopted for the testing of the asymmetric model only. Displacement transducers It was decided to use wire transducers, instead of L.V.D.T. (Linear Variable Displacement Transducers), since displacements to be measured were not one-directional. The displacements transducers used in the test were linear potentiometers, each one specifically calibrated for the test (their sensitivity varying between 40 and 50 mm / V). In order to measure the model deformation with respect to the base (shaking table) special (very stiff) mounts were attached to the table next to the model. Fig. 8 shows the positions of these mounts. Accelerometers Two accelerometers – one measuring the accelerations along the X direction and the other (orthogonal to it) measuring the acceleration along the Y direction – were attached to column 1 at the connection with each floor. The accelerometer sensitivity was about 1V/g.
Strain Gauges Strain gauges were applied to columns 1, 2 and 3, both at the model base (referred to as bottom gauges) and at their connection with the first floor (referred to as top gauges), and at the north, south, east, and west sides of the columns. Table 5 provide a complete information about the columns instrumentation. Strain gauges were applied to beams 1, 2, 3 and 5. All beams are support for the first floor, beam 1 connects column 1 to column 6; beam 2 connects column1 to column 2; beam 3 connects column 2 to column ; beam 5 connects column 3 to column 4. The strain gauges were attached both to the top and bottom parts of these beams (Figure 9). Table 5: characteristics of the instrumentation
EARTQUAKE ENGINEERING RESEARCH CENTRE UNIVERSITY OF BRISTOL Department of Civil Engineering TEST INSTRUMENTATION RECORD ch.
type
location
Ger n°
ch.
type
location
Ger n°
1 2 3 4 5 6 7 8 9 10 11 12 13 14 15 16 17 18 19 20 46 48 49
setra setra setra setra setra setra setra setra setra celesco celesco celesco celesco celesco celesco celesco celesco celesco celesco celesco celesco celesco setra
Tablex Tabley Tablez F1-x F1+y F2-x F2+y F3-x F3+y Tablex Tabley F1C1+x F1C1+y F2C1+x F2C1+y F3C1+x F3C1+y F1C3+y F2C3+y F3C3+y F1C4-X F2C4-X Tablesx+x
1402 1407 1408 1409 1410 1411 1413 1414 1404 1729 1719 1727 1722 1726 1730 1725 1720 1730 1728 1721 1733 1732 1405
21 22 23 24 25 26 27 28 29 30 31 32 33 34 35 36 37 38 39 40 41 42 43 44 45
strain gauges strain gauges strain gauges strain gauges strain gauges strain gauges strain gauges strain gauges strain gauges strain gauges strain gauges strain gauges strain gauges strain gauges strain gauges strain gauges strain gauges strain gauges strain gauges strain gauges strain gauges strain gauges strain gauges strain gauges strain gauges
F4C4-X C1BW C1BN C1BE C1BS C1TW C1TN C1TE C1TS B1B B1T B2B B2T C2BW C2BN C2BE C2BS B3B B3T C3BW C3BN C3BE C3BS B5B B5T
1723 1 2 3 4 5 6 7 8 9 10 11 12 1 2 3 4 5 6 7 8 9 10 11 12
col. 5
col. 4
col. 6
D
Y
X
D A
col. 1
A
col. 2
col. 3
D
D
Fig. 7: Schematic representation of the instrumentation or each floor of the model (D= displacement transducer, A = accelerometer)
Mounts Montanti
Mounts Montanti
sez. b-b
sez. a-a
Tavolatable vibrante Shake
sez. a-a
Mounts Montanti
sez. b-b
Tavola vibrante Shake table
Fig. 8: Schematic representation of the mounts for the displacement transducers
c.39
c.31 c.33
c.44
c.45
c.27
c.26
c.28 c.29
c.38
c.32
c.23
c.25
c.41
c.35 c.24
c.22
c.34 c.37
c.36
c.40 c.43
Fig. 9: Scheme of the strain gauges location on beams and columns
c.42
DYNAMIC TESTS Both models were subjected to the historical records of the Imperial Valley 1940 earthquake (El Centro record). Both East west and North south components were reproduced simultaneously (scaled at various amplitude in order to perform at least 3 tests within the elastic behavior of the model and 2 test runs with the model pushed beyond the elastic limit). Fig. 10 shows the time history of the inputs. Structural damping (at low level of excitation) was estimated through analysis of time decay response in snap back tests (represented in Fig 11) to be equal to about 1.5 % for the symmetric model and about 2.4% for the asymmetric model (the results obtained form transfer functions were not doomed reliable enough to allow estimation of damping through half power bandwidth). The period of vibration of the first mode of vibration was determined (in free vibration, for both models) to be equal to about 0.53 sec.
Fig. 10: Dynamic input used in the shaking table tests. Displacements (mm)
Free vibration
Displacements (mm)
Free vibration
Asymmetric model
Symmetric model
Time (sec)
Time (sec)
Fig. 11: Free vibration response in snap-back tests
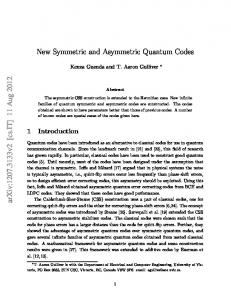
NUMERICAL MODELING OF THE TEST An extensive research work was performed (before interpretation of the experimental results data) in order to calibrate a numerical model (developed using the ABAQUS software) capable of capturing the experimentally determined behavior, providing at the same time insight on the test results. It was found that special attention had to be paid to the modeling of the welded connections between the steel plates used as bases for the lead brick and for the bolted connections at the base of the model. Fig 12 shows a schematic representation of the model developed to account for the discontinuous welds. The calibrations regarding the number of connection (welding) points in the model (at the plate/beam intersection) and the flexibility of the base was performed through least square fitting of the time history rather than least square fitting of the transfer functions that were found to be too noise to be of any help.
A number of least square fittings were performed using the different records obtained from various tests (both in the elastic and plastic range). It was possible, how ever to identify a numerical model capable of capturing the experimental behavior recorded under various tests. Figure 13 shows few comparisons between the experimental results and numerically simulated counterparts (using the same numerical model). Fig 14 shows the first and second period of vibration as determined from the correlation study between experimental results and numerical simulations.
Welding Punto di point
saldatura
Beam Trave Steel Plate di Diaframma piano
Fig. 12: Discrete welding modeling
First storey
Second Storey
Third storey
Fig. 13: Experimental time histories (red lines) and numerical counterparts (green lines)
T1-T2 FOR DIFFERENT MODELING
period T (sec)
0,6000 0,5500 0,5000 0,4500 0,4000 0,3500 0,3000
0
0r
1
1r
2
2r
NUMERICAL MODELo FIRST MODE OF VIBRATION
SECOND MODE OF VIBRATION
Fig. 14: Numerically identified first and second period of vibration for different numerical models (best performance offered by model referred to as 2r)
FINDINGS
It has been found that the response of asymmetric building model is characterised by significant torsional coupling, as maximum displacements at the flexible edge are remarkably larger than those at the stiff edge. Namely, percent increase in displacements at the flexible edge with respect to the stiff edge was almost constant along the model height, as it was 55.8%, 58.8% and 51.3 % at the first, second, and third floors respectively. Furthermore, test results have shown that edge displacements induced by maximum rotations are: 27%, 31% and 29% of maximum displacements at the center of stiffness of first, second and third floor. Figures 15 and 16 represents the envelope of the maximum displacements (along the Y direction – perpendicular to the eccentricity) at the three floors for the symmetric and asymmetric building model respectively. The experimental tests conducted on the Bristol shaking table were also used to check the validity and the effectiveness of the simplified alpha method [2]. The alpha parameter (a structural parameter only) which is identified as the ratio of the maximum rotational to the maximum longitudinal displacement response developed by a one-story eccentric system in free vibration, is here compared to the value of the same ratio, as obtained experimentally with the shaking table tests. As it can be seen from Figure 17 the analytical value of the alpha parameter is always higher than the results provided by the asymmetric model on the Bristol shaking table, both with El Centro earthquake time history and with ABAQUS simulations as dynamic excitations. This comparison show that the alpha ratio is stable also under forced vibration and is accurate enough to estimate the maximum rotational response of eccentric structures. St1
St2
St3 22.53
21.92
15.40
21.36
St3
15.61
St3
15.84
St2
St2
2000
1° piano
First storey
2000
2° piano
Second storey
CR=CM
1500
CR=CM
1500
CR=CM
1500
5.88
St1
6.72
5.82
St1
2000
3° piano
Third storey
Fig. 15: Envelope of the maximum displacements (along the Y direction – perpendicular to the eccentricity) at the three floors for the symmetric building model
CR=CM
2000
2000
3° piano
2° piano
1° piano
First storey
St3
1500
21.92
CR=CM
2000
St2
1500
CR=CM
St3
0.72
St3
15.62
St2
1500
2.18
5.88
St1
St2
1.08
St1 St1
Second storey
Third storey
Fig. 16: Envelope of the maximum displacements (along the Y direction – perpendicular to the eccentricity) at the three floors for the asymmetric building model
Comparison between "alpha" values Simulation AE400800 1 0,8 0,6 0,4 0,2 0
Sperimentale
Modello 1
Modello 2
First floor
0,2125
0,1892
0,1908
Second floor
0,2212
0,1791
0,1773
Third floor
0,241
0,1731
0,17
Analytical value
0,282
0,282
0,282
Fig. 17: Comparison between the experimentally determined alpha parameter and its analytical value.
CONCLUSIONS
Several shaking table tests of scale models of multi-storey steel buildings have been initiated by the EAEE TG8 and carried out in the Earthquake Engineering Research Center of University of Bristol (UK) within the framework of the EU program for shaking table research. Two building models were designed and constructed; the first one was a symmetric three storey 1/5 scale model with respect to its prototype. Shaking table tests of a symmetric building model were needed in order to provide a reference to each result from the asymmetric building model so that both results could be compared. The asymmetric building model was characterized by mass eccentricity equal to about 10% of the model larger plan dimension; it was not designed according to any torsional specification in order to isolate effects of asymmetry. Numerical simulations of test behavior was carried out by means of a computer code which allows inelastic dynamic response of three dimensional building frames to be analyzed. The results show a consistent increase in the maximum deformations at the flexible edge (+ about 30%) with respect to the deformations observed at the center of stiffness.
Analytical-experimental correlation study has shown the crucial importance of a correct modeling of the connections in order to correctly capture the experimental results. The test results also confirm the validity of a simplified method for maximum rotational response estimation (alpha method).
REFERENCES
1.
2.
Rutenberg, A. Behavior of irregular and complex structures: State-of-the-art report - seismic nonlinear response of code-designed asymmetric structures. EAEE Task Group (TG) 8, CD-ROM Proceedings of the Eleventh European Conference on Earthquake Engineering, A.A. Balkema, Rotterdam, 1998. Trombetti, T., Gasparini, G. and Silvestri S. A new simplified approach to the analysis of torsional problem in eccentric systems: the “alpha” method. Third European Workshop on the Seismic Behaviour of Irregular and Complex Structures. 16-17 September 2002, Firenze, Italy.