South African Journal of Animal Science 2009, 39 (2) © South African Society for Animal Science
163
Short communication Estimation of growth curve parameters in Konya Merino sheep 1
I. Keskin1#, B. Dag1, V. Sariyel1 and M. Gokmen2 Department of Animal Science, Faculty of Agriculture, Selçuk University, 42075, Konya, Turkey 2 Directorates of Agriculture and Rural Affairs of Balıkesir Province, Turkey
________________________________________________________________________________
Abstract The objective of this study was to determine the fitness of Quadratic, Cubic, Gompertz and Logistic functions to the growth curves of Konya Merino lambs obtained by using monthly records of live weight from birth to 480 days of age. The models were evaluated according to determination coefficient (R2), mean square prediction errors (MSPE) and Durbin Watson (DW) statistics. The R2 values of the models ranged from 0.96 to 0.99 for females and from 0.96 to 0.99 for males. The Cubic model gave the best R2 value of 0.99 in females, while the Logistic model gave the lowest R2 value of 0.96 in females. The results indicated that the Quadratic and Gompertz models showed the best fit to growth of Konya Merino ewe lambs by having higher R2 values, lower MSPE and non autocorrelation. By using these models live weights at later ages could be predicted from early partial live weight data. Further studies should be carried out on growth curve characteristics at later ages including adult age.
________________________________________________________________________________ Keywords: Growth, Quadratic, Cubic, Gompertz, Logistic, Konya Merino lambs #
Corresponding author. E-mail:
[email protected]
Growth is one of the most important characteristics of farm animals and has been investigated for many years (Moore, 1985; Blasco & Gomes, 1993; Bathaei & Leroy, 1996; 1998; Topal et al., 2004). Increase in live weight or dimension against age has been described as growth. Changes in live weight or dimension for a period of time are explained by the growth curves. Animal breeders are interested in the genotypic and phenotypic relationships during all phases of growth. Knowledge of genotypic and phenotypic relationships among live weights, degree of maturity and growth rate during all phases of growth is necessary to formulate breeding programmes to improve lifetime efficiency (Smith et al., 1976). Growth curves are also used for investigating optimum feeding programmes, determining optimum slaughtering age and the effects of selection on curve parameters and on live weight at a certain age (Blasco & Gomes, 1993). The shape of growth curves has been reported to vary according to the species of animal, the environment and the trait (Efe, 1990; Akbaş et al., 1999; Topal et al., 2004). Moore (1985) studied the growth curves of domesticated mammals. He reported that linear and cubic models fitted the data of cattle, pigs, sheep, goats, rabbits, mice and rats sufficiently, and supplied a standard growth curve for these mammals. Akbaş et al. (1999) studied live weight changes of Kıvırcık and Dağlıç male lambs from birth to 420 days using growth curve models. They reported that the simple linear model gave the best fit for Dağlıç and the quadratic model for Kıvırcık lambs. Also, nonlinear Brody, Negative exponentials, Gompertz, Logistic and Bertalanffy models fitted the body weight data of Kıvırcık and Dağlıç male lambs well (models’ R2 values were above 0.98). Esenbuğa et al. (2000) reported that R2 values for the Brody model in Morkaraman, Awassi and Tushin lambs were 0.99, 0.99 and 0.98, respectively and the fitness of this model was found to be sufficient. The Gompertz function was found to be appropriate for describing the growth curve of Suffolk sheep (Lewis et al., 2002). Growth from birth to 360 days of age in ewe lambs of the Morkaraman and Awassi breeds was estimated using Brody, Gompertz, Logistic and Bertalanffy functions (Topal et al., 2004). In this study, the Gompertz function gave the best fit for the Morkaraman breed while the Bertalanffy function was the best for the Awassi breed.
The South African Journal of Animal Science is available online at http://www.sasas.co.za/sajas.asp
South African Journal of Animal Science 2009, 39 (2) © South African Society for Animal Science
164
No previous studies have been conducted on growth curve characteristics of the Konya Merino sheep. The objective of the present investigation was to determine the fitness of the Quadratic, Cubic, Gompertz and Logistic functions to the growth curves of Konya Merino lambs. Data from 162 Konya Merino lambs born in 2002 (57 males and 105 females) were used. The sheep were maintained at the Bahri Dağdaş Agricultural Research Institute farm in the Konya Province in central Turkey (37o, 51' N and 32o, 48' E). This province has approximately 1.6 million head of sheep, which represents 6% of the sheep population of Turkey. The province’s average annual rainfall is between 250 - 400 mm; the mean temperature 11.5 °C; and the average elevation 1016 m. The flock consisted of 400 ewes and 25 rams. Animals were maintained under semi-intensive conditions. Age at first lambing was approximately 24 months. Ewes lambed between 1 January and 15 February. The lambs were weaned at 75 days of age. Ewes were grazed from April to December and kept indoors throughout the winter. Live weight data were recorded monthly from birth to 16 months of age. After 16 months the animals were kept for breeding purposes and no further weights were recorded. The Quadratic, Cubic, Gompertz and Logistic growth curve models were fitted to weight-age data of each animal to describe the growth curve. The models are as follows: Quadratic model: Wt = A 0 + BT + CT 2 Cubic model: Wt = A 0 + BT + CT 2 + DT 3 Gompertz model: Wt = Ae − Be
− CT
Logistic model: Wt = A / 1 + Be − CT where Wt is the weight at time t, A is the asymptotic live weight for Gompertz and Logistic models and indicates initial live weight (A0) for the Quadratic and Cubic models. Initial live weight is converted to asymptotic live weight (A) by the following equations:
A = A0 −
B2 4C
for the Quadratic model;
and 2 3 A = A 0 + BTmax + CTmax + DTmax
for the Cubic model.
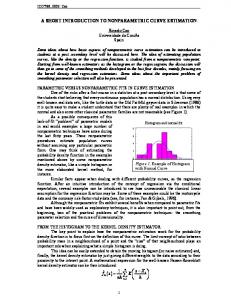
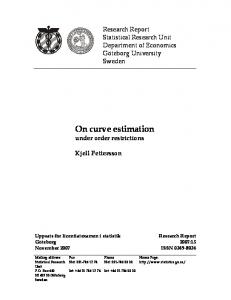
where A0 is the initial live weight; B, C, and D are the model parameters which characterize the shape of the curve and were estimated from a nonlinear regression analysis using the NLIN procedure of SAS (1996). The Durbin-Watson (DW) statistics (Durbin & Watson, 1951) was used as a measure of first-order positive autocorrelation to test whether the residuals were randomly distributed (Grossman & Koops, 1988). First, it was estimated for each growth curve, and then the average value of DW was calculated for each model. The main criteria used to compare models were the relative size of the MSPE and the DW statistics. Models resulting in smaller MSPE and with less cases of positive autocorrelation were considered to be superior, because less residual variation remained in the data and the residuals were more randomly distributed (Papajsik & Bodero, 1988; Ruiz et al., 2000). Coefficient of multiple determination (R2) adjusted by the number of parameters in each model was also calculated and used as selection criteria. Duncan’s (1955) multiple range test was used to determine significance of the A, B and C coefficients and MSPE values across models. Growth curve parameters in Konya Merino lambs according to the Quadratic, Cubic, Gompertz and Logistic models are given in Table 1. Parameter A shows initial live weight in Quadratic and Cubic models and asymptotic live weight in Gompertz and Logistic models. Estimates of initial live weight in males and females for Gompertz and Logistic models were higher than for the other models (Figures 1 and 2). Similar results were observed by Akbaş et al. (1999).
The South African Journal of Animal Science is available online at http://www.sasas.co.za/sajas.asp
South African Journal of Animal Science 2009, 39 (2) © South African Society for Animal Science
165
80
Live Weight (kg)
70 60 50 40 30 20 10 0 1
30
60
90
120
150
180
210
240
270
300
330
360
390
420
450
480
Age (day) Data
Quadratic
Cubic
Gompertz
Logistic
Figure 1 Prediction curves obtained from four different growth curve models in males.
60
Live Weight (kg)
50 40 30 20 10 0 1
30
60
90
120
150
180
210
240
270
300
330
360
390
420
450
480
Age (day) Data
Quadratic
Cubic
Gompertz
Logistic
Figure 2 Prediction curves obtained from four different growth curve models in females. Estimates of the A parameter for Gompertz and Quadratic models in males were similar (78.0 vs.79.3) and higher than for the other model parameters (P