tions (cohorts) of an introductory Computation Lab course sequence. This course .... MATLAB, which is a scientific computation software. For both of the sections ...
Should the first course in computational problem solving and programming be Student-Centered or Teacher-Centered? Cem Sahin∗ and Pramod Abichandani† ∗ Drexel † Assistant
Wireless Systems Lab, ECE Department, Drexel University Teaching Professor, College of Engineering, Drexel University {cem.sahin, pramod}@drexel.edu
Abstract—Computational problem solving and programming are foundational skills for engineers. The first undergraduate level course that covers these topics is critical to laying these foundations. As instructors strive to incorporate the spirit of inquiry in their courses, an important question that comes forth is whether the teaching methodology should be student-centered or teachercentered. This paper adds helpful information in the ongoing debate on this question. The paper reports on the student performance results obtained by teaching two sections (cohorts) of an introductory Computation Lab course sequence. This course sequence aims to teach new engineering students MATLAB scripting and programming in the context of technical problem-solving using mathematical models. Cohort A was taught using a traditional teachercentered approach, while Cohort B employed an openended student-centered approach. Our results indicate that the teacher-centered approach has the potential of creating polarized grade distributions with relatively more A grades in the class compared to the student centered approach. On the other hand, the student-centered approach provided a smoother grade distribution, indicating that a higher number of students demonstrate noticeable progress as compared to the teacher-centered approach. Keywords—Student-Centered, Teacher-Centered, Computational Problem Solving, Programming, First Year Course
I.
I NTRODUCTION
Computational problem solving and programming are foundational skills for most engineers. The first undergraduate level course that covers these topics is critical to laying these foundations. As instructors strive to incorporate the spirit of inquiry in their courses, an important question that comes forth is whether the teaching methodology should be student-centered or teachercentered.
In the past two decades, there has been an increasing interest in shifting the center of instruction from the teacher towards the students. There have been studies conducted using student-centered teaching methodologies, where the students were at the center of learning. Research shows that learning is triggered optimally if the course is set up correctly and is complemented with student-centered learning [1], [2]. It was also suggested that when student-centered learning technique is integrated with technologies, it provides students novel opportunities to try things and gain hands-on experience as they progress with the course [4]. On the other hand, research also shows that not every course can be taught using a student-centered approach. In [3], the authors provide insights into why students might need more than just the minimal guidance. In this paper, we present the tradeoffs between student-centered learning and instructor-centered teaching techniques as applied to introductory computational problem solving and programming courses. We analyze two different sections (cohorts A and B) of a first-year (freshmen level) programming course, where each section was instructed using different teaching techniques. This paper is organized as follows: In Section II, we present the experimental methodology used in this research. Section III summarizes the results using numeric data collected and presents the statistics observed within the two cohorts. We then conclude this paper in Section IV. II.
E XPERIMENTAL M ETHODOLOGY
A. Course Sequence and Technical Topics This first-year course sequence ran for 3 academic terms at Drexel University’s College of Engineering. For the purpose of this study, we report on results from the
first two terms. Technical topics that were covered in the class during the first term included MATLAB basics and plotting to illustrate fundamental software engineering and computational problem solving concepts, introductory data analytics: procuring, analyzing, and visualizing data, data visualizations - 2-D plots and animations, and string manipulation. For the second term, technical topics that were covered in the class include MATLAB functions, mathematical modeling and simulation of physical processes (static and dynamic), 3-D visualizations, and numerical integration and differentiation. B. Student Demographics The two cohorts were run back-to-back and were taught by the same instructor (Abichandani) and teaching assistant (Sahin). Cohort A had 33 students and Cohort B had 34 students at the beginning of the year. The students were assigned into one of the two sections either by the college advising team or by online registration based on student schedule availability only. There were no intentional grouping of the majors of the students. Although the majority of the class (71%) was enrolled as freshmen, about 24% of the students were at sophomore level. The remaining 5% of the class population were pre-juniors (third-year students). There were no juniors or seniors enrolled in any of the sections. Out of the two sections, there was only one female student.
passwords, which enabled the students to save their work into their own workspace. All of the laptops had the exact same configuration (internet connectivity, installed programs etc.). The program used in this course was MATLAB, which is a scientific computation software. For both of the sections, the teaching materials were projected onto two different screens to ensure optimal visibility. D. Pedagogy In Cohort A, the problem solving techniques and programming exercises were demonstrated by the instructor in detail. The instructor introduced a problem and explained the logic behind solving the problem. Subsequent to this, the instructor demonstrated the complete solution process using MATLAB.
Both cohorts featured several engineering majors. Cohort A was dominated by Computer Science majors, where they occupied about 44% of the total enrollment. About 29% of Cohort B was comprised of Mechanical Engineering students, whereas the rest of the class was distributed relatively equally between the various engineering areas (Computer Engineering, Electrical Engineering, Civil and Architectural Engineering, Software Engineering, and Business and Engineering). Between the two sections, there were 5 still deciding students (who are enrolled in Engineering but did not declare a specific Engineering major yet). No race and country of origin data was collected for the purposes of this experiment.
Cohort B was instructed using a student-centered approach that featured elements of guided discovery; specifically, the instructor introduced a technical topic very briefly, and then encouraged the students to explore the topic using problem-solving approaches and MATLAB programming with little guidance. Students were presented the basics of the topics and were asked to experiment and explore with their knowledge and to build up on them to self-learn some of the more advanced topics. Students were also shown external resources (e.g. the help file, useful websites) to encourage self-learning. Cohort B featured discussions among students, generation of ideas, and a convergence to a verifiable solution. This methodology allowed for students’ independent and bold thought processes and decision-making to flourish while simultaneously honing their technical skills. The teaching assistant was asked to walk around the room throughout the whole lab session to monitor the progress of the students and to clarify any questions that might arise. The teaching assistant was directed to not give out any answers but, instead, to lead the students by asking them the right questions towards the correct answer. Students demonstrated their work and shared their solution approaches during lab sessions. No lecture notes given to the students in both cohorts.
C. Classroom and Computing Resources
E. Assignments
The classes met for two hours every week in a computer laboratory, where the layout of the room encouraged collaboration and ideation. The students were given Macbook pro laptops at the beginning of the lab. They were asked to login with their own usernames and
Each term consisted of 10 weeks of lectures and an additional week dedicated for final project submission. The two cohorts received the same assignments (5 in total), exams (2 in total), and project statements (1 at the end of the term) each term. Throughout the term,
TABLE I: Grading rubric for second term project Item 1. Idea and justification
Points Total: 15
1a. Submitted project idea
5
1b. Project idea has intellectual merit
5
1c. Project idea has broad impact
5
2. Creativity in implementing the idea
Total: 10
3. Functionality of implementation
Total: 30
3a. Submitted code works as promised 3b. Submitted code is efficient 4. Readability of the code 4a. Code comments explain the functionality clearly 4b. Code structure follows good programming practice 5. Design
20 10 Total: 10
The term projects were graded based on in-class student demonstrations and the final submission. It was noticed that there were students in both cohorts who came up with ideas worth mentioning. Some examples include train timetable lookup application, battleship game, 50 states game, and maze solver. A majority of students also included final projects with rich 2-D and 3-D visualizations.
5 5
III.
Total: 10
5a. General GUI Appearance
5
5b. General flow of project
5
6. In-class demonstration
student might present during their work submission. All submitted materials were evaluated twice to ensure the order of grading didn’t cause any bias.
Total: 25
6a. Project Impact and Merit and Technical Challenges
10
6b. Solution Approaches and Overall presentation
10
6c. Q&A
5
the assignments were posted online (using the college’s online course management system) within 24 hours after the lecture. They were due the morning of the next lecture. All work that needed to be graded was submitted by students using the online course management system. The instructor and the teaching assistant had full access to the course page. The assignment questions were a mixture of closedended questions that were extensions of material that is covered in class and more open-ended questions. The exams were very similar to the assignments and contained two questions with extra credit opportunities. The final project statements were open ended and ranged from analyzing Twitter feed data of an account of students’ choice to creating applications that featured rich physics based 3-D animations. F. Student Work Evaluation Techniques Grading for the course was done as fairly as possible. In order to remove any grader bias from the grades, the student work was evaluated by hiding the names. These assessment tools consisted of a combination of analytic and summative rubrics, where an example is shown in Table I. Although there were specific tasks that were being asked for, students were allowed to use their knowledge to analyze the data using any method they deemed appropriate. The grading rubrics were created in order to comprehensively cover all scenarios that a
R ESULTS
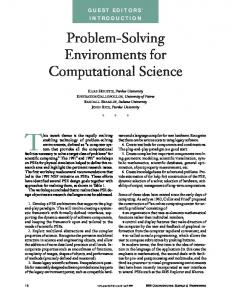
Assessment was performed using rubrics that focused on the following aspects (1) Problem-solving approach (2) Functionality and readability of the MATLAB code and (3) Final project reports. Both sections were graded using the same grading rubric for their assignments and exams. In the following discussions, we present results for both cohorts for the first two terms of the this course sequence. Table II summarizes the average grades obtained from all grading categories from each cohort for the two terms. Table III displays the p-value of Kolmogorov-Smirnov (KS) tests run on the data across the cohorts. In the first term of the course, the teachercentered approach yielded a final grade distribution that is fairly polarized, with approximately 45.5% of class scoring an A grade, and only 33.33% of the class scoring B and C grades. Approximately, 12% of the class failed. This polarization can be corroborated from the low average grade (79.89 points) and relatively high standard deviation (22.78 points). The student-centered approach, on the other hand, had a final grade distribution that is more spread out with only 32% of the class scoring an A grade, and 47% of the class scoring B and C grades. The failure rate was approximately 6%. The smoothness of the distribution can be corroborated from the high
TABLE II: Average grades and p-values for both cohorts for the first and second terms Cohort A
Cohort B
Term 1
Term 2
Term 1
Term 2
Assignments
86.8%
87.8%
83.1%
95.9%
Exams
78.6%
91.4%
86.4%
90.2%
Term Project
68.6%
89.5%
73.4%
93.3%
Avg. Final Grades
79.9%
90.4%
85.0%
93.4%
(a) First Term, Cohort A
(b) First Term, Cohort B
(c) Second Term, Cohort A
(d) Second Term, Cohort B
Fig. 1: First and second term final grade distributions for both cohorts
TABLE III: KS-test p-values Cohort A, Term 1 vs. Cohort B, Term 1
0.3679
Cohort A, Term 2 vs. Cohort B, Term 2
0.8332
average grade (84.95 points) and relatively low standard deviation (14.66 points). These results can be seen as summarized in Fig. 1a and Fig. 1b. A similar analysis was also performed for the second term of the course, where Cohort A (teacher-centered) presented results with approximately 68% class receiving an A grade, an increase from the first term, and about 29% of the class receiving a B or a C. Only one student failed in Cohort A. Although a relatively high number of
students received an A grade, the average grade point was 90.41, where the standard deviation was 15.53, which agrees with the grade distribution observed. For the Cohort B, a very high percentage, 81%, of the students received an A grade and only about 15% received a B or a C grade. There were no failing students. The lowest grade was a D+. These grades correspond to a Cohortwide grade average of 93.44 points, and a tighter standard deviation of 9.90 points, which focused the majority of the students above a grade of 85 points. These results are also summarized in Fig. 1c and Fig. 1d. In order to validate the results, a student-by-student comparison was also run. Each student’s first term final grade was compared against their second term final grade. In Cohort A, 10 students received the same letter
TABLE IV: Grades change across the two terms Cohort A
1.5% increase
Cohort B
6.1% increase
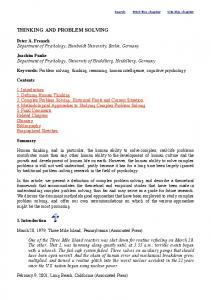
grade in both terms, whereas, for Cohort B, this number was 7. As shown in Table IV and Fig. 2, overall trend for both cohorts was an increase in average final grades. Cohort B demonstrated a higher grade increase. 67% of the students received a higher letter grade, whereas only 7% received a lower letter grade. In Cohort A, the effect was less dramatic, with 39% of the students receiving a higher letter grade and 25% getting a lower letter grade. A. Student Course Evaluations At the end of each quarter, the university asked all students to fill out a course evaluation, which collected feedback from the students regarding the effectiveness of the teaching team in reaching the course goals along with their techniques and the materials used for the course. The students are also given the opportunity to add any comments regarding the teaching team. The students are given 2 weeks to complete the surveys. Participation was voluntary and students did not receive any extra credit if they decided to submit a course evaluation. In addition to the final grades of the students, the course evaluation results provided a more comprehensive picture for the effectiveness of the course. Table V shows the response rate of the course that is of interest. The majority of the respondents indicated that the amount of knowledge they had at the end of the course
TABLE V: Number of respondents and response rate Cohort A
Cohort B
First Term
12 (36.4%)
13 (38.2%)
Second Term
9 (32.1%)
8 (29.6%)
sequence is more compared to what they had before they were enrolled into the course sequence. Fig. 3a and 3b summarize the student responses. The numbers are based on the rating scale between 1 and 5, where 1 corresponds to ”do not agree at all” and 5 corresponds to ”agree completely”. In the first term, there were a total of 6 questions asked regarding the course, whereas, for the second term, the sixth question was dropped, yielding a total of five prompts. These questions below were asked in a ”before the term” and ”after the term” fashion. The questions stemmed from the following learning objectives set for the class: At the end of the class, students should... - Q1: Be able to answer questions about practical technical situations using computation within the framework of mathematical modeling involving pre-calculus algebra. - Q2: Be able to use programming constructs using numerical and symbolic computation, and scientific visualization, to automate sequences of computations of a few steps. - Q3: Acquire a basic repertoire of computational actions and structures, and be able to use them to fashion solutions to simple technical problems. - Q4: Acquire basic terminology of technical computation and be able to follow instructions that use it. - Q5: Experience how numerical and symbolic computation, and scientific visualization, can help gain insight into problems within technical fields. - Q6: Be able to utilize a technical computation tool to perform basic word processing and documentation tasks. In addition to the numeric data collected, some of the written student feedback at the end of Term 2 included: •
”It is a great course, but a basic understanding of programing is required” - Cohort A
•
”we had freedom and the class involved real life scenarios” - Cohort A
•
”I thought the creativity aspect introduced the semester was the extremely helpful in the learning process.” - Cohort B
•
”Being taught Matlab helped me so much in
Fig. 2: Change in the final grades of individual students across the two terms
(a) First Term
(b) Second Term
Fig. 3: First and second term student evaluation results
other classes” - Cohort B •
”It was all good! every class i left wanting to do more programming!” - Cohort B
•
”The course gave me knowledge of using a program completely knew to me and gave me the tools to work independently with it.” - Cohort B
As it can be seen, although the written feedback above are from within Cohort A and Cohort B, the majority of the students, who responded to the survey, thought the open-endedness/freedom, and the inter-disciplinary approach in the topics were suitable for their engineering needs. It can also be observed that Cohort B reported that they felt their knowledge at the end of the term was much more than what they started with at the beginning of the term. This observation is made by comparing the Cohort B (Fig. 3b) evaluation results to the Cohort A (Fig. 3a) evaluation results. The response rates shown in Table V should be kept in mind while analyzing the student feedback data. Although sample biasing is possible with lower response rates, studies show that surveys running for a long period of time but with low response rates provide more accurate measurements compared to those with higher participants [5]. IV.
C ONCLUSIONS AND TAKE -AWAYS
In this paper, we presented the results of running an introductory computational problem solving and programming course using student-centered and teachercentered methodology.
The results indicate the fact that for the class sequence discussed in this paper, the teacher-centered approach has the potential of creating polarized grade distributions, which is indicative of a pronounced divide between students whose problem-solving and programming skills improve substantially over the course of the class, and those whose skills do not improve as much. The analysis points to the fact that the teacher-centered education propels good students to better performance, but leaves the weaker students behind. On the other hand, the student-centered approach provides a smoother grade distribution, indicating that while the relative number of students getting A grades, i.e., demonstrating superior computational problem-solving and programming skills may not be as high as compared to the teacher-centered approach, a relatively higher number of students demonstrate noticeable progress as compared to the teacher-centered approach. The better students achieve less than they would have achieved if educated in the alternative mode, but the weaker students end up with better performance. The average performance is higher but the better student paid a price for the better average. Furthermore, as students were exposed to continued student-centered pedagogy (in term 2), their individual performance increased substantially when compared to the teacher-centered approach. As educators continue to push the boundaries of pedagogical methodologies for computational problem solving and programming courses, these results will help inform their decision making by demonstrating the tradeoffs between different methodologies.
ACKNOWLEDGMENTS The authors would like to thank Drexel University College of Engineering and Computer Science Departments for their support in organizing and running this course. The authors would also like to thank the anonymous reviewer whose suggestions helped improve this paper. R EFERENCES [1] [2]
Elizabeth Aaronsohn, Going against the grain. supporting the student-centered teacher., ERIC, 1996. Mary E Huba and Jann E Freed, Learner centered assessment on college campuses: Shifting the focus from teaching to learning,
Community College Journal of Research and Practice 24 (2000), no. 9, 759–766. [3] Paul A Kirschner, John Sweller, and Richard E Clark, Why minimal guidance during instruction does not work: An analysis of the failure of constructivist, discovery, problem-based, experiential, and inquiry-based teaching, Educational psychologist 41 (2006), no. 2, 75–86. [4] Judith Haymore Sandholtz et al., Teaching with technology: Creating student-centered classrooms., ERIC, 1997. [5] Penny S Visser, Jon A Krosnick, Jesse Marquette, and Michael Curtin, Mail surveys for election forecasting? an evaluation of the columbus dispatch poll, Public Opinion Quarterly 60 (1996), no. 2, 181–227.