both tools allows the analysis of new proposals for the interconnection subsystem of a .... of interconnection network performance: packet latency. (average and ...
� �
� 6,&26
The main objective of SICOSYS is to reach the precision of a VLSI simulator while achieving a computational cost close to a functional simulator. In order to verify the degree of accomplishment of this objective, a comparison example with each type of simulator is presented.
���
. . . . . . . . . . . . . . . . . . . . . . . . . . . . . . . . .
����&RPSDUDWLYH�DQDO\VLV��
1(7:25.
networks with a deadlock avoidance mechanism based on injection control. "Network.sgm" describes both the form in which routers are interconnected and the connection delays. Finally, "Simula.sgm" specifies the remaining parameters of the simulation.
Figure 2. Example of the router used for comparison between SICOSYS and Leapfrog.
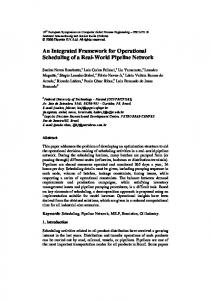
Next, using OHDSIURJ (the VHDL simulator of Cadence [7]), a simulation of 64 nodes (each one using the RTL description) interconnected in a toroidal topology has been carried out. Latency and throughput results have been compared to those obtained by using SICOSYS, showing the goodness of our simulator, as can be seen in Figure 3. The latency error is less than 4% and in the case of throughput, the error is even smaller. Meanwhile, the speed-up of SICOSYS can be up to 45 (see Figure 4). Similar results are obtained using other routers, with different traffic patterns and network configurations.
Proceedings of the 10th Euromicro Workshop on Parallel, Distributed and Network-based Processing (EUROMICRO-PDP’02) 1066-6192/02 $17.00 © 2002 IEEE
4
120 SicoSys
3,5
VHDL (Leapfrog)
100
3
80
2,5 2
60
1,5
Error (%)
40
115
1 20
105
0,5
60
SICOSYS NETSIM
50
Error 0
95
0 5
10
15
20
25
Latency (cycles)
0
Applied load (phits/cycle)
(a) 4
45
40 85 75
30
65
20
SicoSys VHDL (Leapfrog) Error
35 30
3,5
55
3
45
2,5
35
25 2 20 1,5
15
Error (%)
Accepted Load (phits/cycle)
40
1
10
0,5
5 0
0 0
10
20 30 Applied Load (phits/cycle)
40
50
(b) Figure 3. (a) Average latency and relative error of SICOSYS versus Leapfrog. (b) Throughput.
���
SicoSys
��
VHDL (Leapfrog)
��
SpeepUp
��
���
��
���
��
��
��
��
�� ��
��
10
0 0
5
10 15 Applied Load (phits/cycle)
20
25
Figure 5. NETSIM –SICOSYS comparison (8x8 torus, deterministic routing and random traffic).
As an example, Figure 5 shows the results for one of the different cases analyzed. It represents the average message latency under uniform traffic. The network is an 8x8 torus with deterministic routing. Although the router simplicity is evident, the discrepancy between both types of simulators is up to 50%. SICOSYS results remain closer to those obtained by the VHDL simulator. These results demonstrate the strong discrepancies that can appear as a result of using functional simulators, even of the NETSIM characteristics. With such a degree of discrepancy it is not fair to try to analyze the impact of architectural proposals on the execution time of real applications.
��� ,QWHJUDWLQJ� 6,&26