Non-Destructive Testing of industrial components carries vital importance, both ... well-documented analytical models, Ultrasonic Guided Waves has been ...
BRUNEL UNIVERSITY
Signal Processing Methods for Defect Detection in Multi-Wire Helical Waveguides using Ultrasonic Guided Waves
by Mehmet Kerim Yucel
A thesis submitted in partial fulfillment for the degree of Master of Philosophy in the School of Engineering and Design March 2015
ABSTRACT Non-Destructive Testing of industrial components carries vital importance, both financially and safety-wise. Among all Non-Destructive techniques, Long Range Ultrasonic Testing utilizing the guided wave phenomena is a young technology proven to be commercially valid. Owing to its well-documented analytical models, Ultrasonic Guided Waves has been successfully applied to cylindrical and plate-like structures. Its applications to complex structures such as multi-wire cables are fairly immature, mainly due to the high complexity of wave propagation. Research performed by the author approaches the long range inspection of overhead transmission line cables using ultrasonic guided waves. Existing studies focusing on guided wave application on power cables are extremely limited in inspection range, which dramatically degrades its chances of commercialization. This thesis consists of three main chapters, all of which approaches different problems associated with the inspection of power cables. In the first chapter, a thorough analysis of wave propagation in ACSR (most widely used power cable) cables is conducted. It is shown that high frequency guided waves, by concentrating the energy on the surface layers, can travel much further in the form of fundamental longitudinal wave mode, than previous studies have shown. Defect detection studies proved the system’s capability of detecting defects which introduce either increase or decrease in cross sectional area of the cable. Results of the chapter indicate the detectability of defects as small as 4.5% of the cross sectional area through a 26.5 meter long cable without any post-processing. In the second chapter, several algorithms are proposed to increase the inspection range and signal quality. Well-documented wavelet-denoising algorithm is optimized for power cables and up to 24% signal-to-noise ratio improvement is achieved. By introducing an attenuation correction framework, a theoretical inspection range of 75 meters is presented. A new framework combining dispersion compensation and attenuation correction is proposed and verified, which shows an inspection range of 130 meters and SNR improvement up to 8 dBs. Last chapter addresses the accurate localization of structural defects. Having proven the optimum excitation and related wave propagation in ACSR cables, a system having a more complex wave propagation characteristics is studied. A new algorithm combining pulse compression using Maximal Length Sequences and dispersion compensation is applied to multimodal signals obtained from a solid aluminum rod. The algorithm proved to be able to improve signal quality and extract an accurate location for defects. Maximal Length Sequences are compared to chirp signals in terms of SNR improvement and localization, which produced favourable results for MLS in terms of localization and for chirp in terms of SNR improvement.
i
ACKNOWLEDGEMENTS The author thanks the personnel of Brunel Innovation Centre and TWI who have provided continuous support to the author throughout his research. Support of Dr.Alvin Chong, Dr. Hossein Habibi, Dr.Abbas Mohimi, Maria Kogia, Sina Fateri, Shehan Lowe and Dr. Cem Selcuk is gratefully acknowledged and will never be forgotten. The work presented in this thesis could not have been completed without the technical and emotional support of Dr. Makis Livadas and Vassilios Tzitzilonis. Author also extends his eternal gratitude to Dr. Mathew Legg, in addition to his immense support and sublime supervision, who simply made this research and thesis happen. Author would like to thank Prof. Abdul Sadka and Prof. Tat-Hean Gan of Brunel University to realize the opportunity of this research in the first place. A special thanks goes to Dr. Vassilis Kappatos, who have willingly (or unwillingly, the author is not entirely sure) and successfully managed to endure author’s frequent emotional fluctuations and unending problems, be it technical or financial. The author will eternally remain grateful to Prof. Wamadeva Balachandran due to his continuous technical and emotional support. His mentorship and invaluable feedbacks regarding every possible question was the main factor that held this research together. Last but foremost, author acknowledges the endless support of family and friends in Turkey and UK who have helped the author maintain his focus and motivation to pursue this research. The author gratefully acknowledges European Commission, TSB and Brunel University, without whom the research would have been impossible.
With the hopes of seeing again the people listed above somehow, somewhere, sometime.
ii
Babam için
iii
TABLE OF CONTENTS CHAPTER 1: RESEARCH BACKGROUND AND MOTIVATION ..................................................................................... 1 1.1. : OVERVIEW ...........................................................................................................................................................1 1.2. : NON-DESTRUCTIVE TESTING AND ULTRASONIC GUIDED WAVES .....................................................................................1 1.3. : RESEARCH MOTIVATION .........................................................................................................................................1 1.4. : AIMS AND OBJECTIVES ............................................................................................................................................2 1.5. : SUMMARY OF THE METHODOLOGY AND ORGANISATION OF THE THESIS ...........................................................................2 1.6. : CONTRIBUTIONS TO KNOWLEDGE .............................................................................................................................3 1.7. : PUBLICATIONS.......................................................................................................................................................5 1.8. : CRITICAL SUMMARY ...............................................................................................................................................5 CHAPTER 2: INTRODUCTION .................................................................................................................................. 6 2.1. : OVERVIEW ...........................................................................................................................................................6 2.2. : NON-DESTRUCTIVE TESTING ....................................................................................................................................6 2.2.1. : Fundamentals ...........................................................................................................................................6 2.2.2. : Existing Techniques ...................................................................................................................................7 2.2.2.1. : Radiography Testing ............................................................................................................................................ 7 2.2.2.2. : Acoustic Emission ................................................................................................................................................ 7 2.2.2.3. : Eddy Current Testing ........................................................................................................................................... 8 2.2.2.4. : Scanning electron microscopy ............................................................................................................................. 9 2.2.2.5. : Infrared Thermography ....................................................................................................................................... 9 2.2.2.6. : Electromagnetic testing ..................................................................................................................................... 10
2.3. : CONVENTIONAL ULTRASONIC TESTING .....................................................................................................................11 2.4. : ULTRASONIC GUIDED WAVES–BASED TESTING ..........................................................................................................13 2.4.1. : Guided Waves in Plates ...........................................................................................................................14 2.4.2. : Guided Waves in Cylindrical Structures ...................................................................................................14 2.4.3. : Dispersion Curves ....................................................................................................................................15 2.5. : CRITICAL SUMMARY .............................................................................................................................................17 CHAPTER 3: ULTRASONIC GUIDED WAVES IN OVTL CABLES ................................................................................. 18 3.1. : OVERVIEW .........................................................................................................................................................18 3.2. : INTRODUCTION ...................................................................................................................................................18 3.3. : METHODOLOGY ..................................................................................................................................................20 3.4. : CABLE INFORMATION AND INSTRUMENTATION ..........................................................................................................21 3.5. : CHARACTERISATION OF WAVE PROPAGATION ...........................................................................................................22 3.5.1. : Frequency Optimisation ..........................................................................................................................22 3.5.2. : Wave Mode Identification .......................................................................................................................22 3.5.2.1.1. : Theoretical Approach ................................................................................................................................ 22 3.5.2.1.2. : Vibrometry Analysis ................................................................................................................................... 23
3.6. : DEFECT DETECTION ANALYSIS ................................................................................................................................24 3.7. : RESULTS.............................................................................................................................................................25 3.7.1. : Wave Propagation Characterization .......................................................................................................25 3.7.1.1. : Frequency Optimization .................................................................................................................................... 25 3.7.1.2. : Wave Mode Identification ................................................................................................................................. 26
iv
3.7.1.3. : Defect Detection Analysis .................................................................................................................................. 29 3.7.1.3.1. : Masses Attached ....................................................................................................................................... 29 3.7.1.3.2. : Saw Cut ...................................................................................................................................................... 30
3.8. : CRITICAL SUMMARY .............................................................................................................................................31 CHAPTER 4: RANGE/SIGNAL ENHANCEMENT IN UGW TESTING OF OVTL CABLES ................................................ 32 4.1. : OVERVIEW .........................................................................................................................................................32 4.2. : INTRODUCTION ...................................................................................................................................................32 4.3. : WAVELET DENOISING ...........................................................................................................................................33 4.4. : TIME SCALING .....................................................................................................................................................36 4.5. : TIME SCALING AND DISPERSION COMPENSATION .......................................................................................................37 4.5.1. : Wave Propagation Model and Dispersion Compensation ......................................................................38 4.5.2. : Experimental Procedure ..........................................................................................................................38 4.5.3. : Dispersion Curve Acquisition and Wave Mode Identification .................................................................39 4.5.4. : Dispersion Compensation Results ...........................................................................................................41 4.5.4.1. : MLS Excitation ................................................................................................................................................... 41 4.5.4.2. : Narrow Bandwidth Signals ................................................................................................................................ 43
4.6. : CRITICAL SUMMARY .............................................................................................................................................44 CHAPTER 5: AUTOMATIC DEFECT LOCALIZATION AND SIGNAL IMPROVEMENT IN UGW TESTING ....................... 46 5.1. : OVERVIEW .........................................................................................................................................................46 5.2. : INTRODUCTION ...................................................................................................................................................46 5.3. : THEORETICAL BACKGROUND ..................................................................................................................................47 5.3.1.1. : Pulse Compression ............................................................................................................................................ 47 5.3.1.2. : Maximal Length Sequences ............................................................................................................................... 47 5.3.1.3. : Chirp Signals ...................................................................................................................................................... 48
5.4. : PROPOSED TECHNIQUE .........................................................................................................................................48 5.5. : SIGNAL MODELLING .............................................................................................................................................49 5.5.1.1. : Single Wave Mode ............................................................................................................................................. 50 5.5.1.2. : Multiple Wave Modes ....................................................................................................................................... 52
5.6. : EXPERIMENTATION...............................................................................................................................................53 5.6.1.1. : Experimental Setup ........................................................................................................................................... 53 5.6.1.2. : Experimental Results ......................................................................................................................................... 54 5.6.1.2.1. : Flexural Mode Compensation .................................................................................................................... 55 5.6.1.2.2. : Longitudinal Mode Compensation ............................................................................................................ 56 5.6.1.2.3. : Noise Performance .................................................................................................................................... 58 5.6.1.2.4. : Remarks and Recommendations ............................................................................................................... 59
5.7. : CRITICAL SUMMARY .............................................................................................................................................60 CHAPTER 6: CONCLUSIONS AND RECOMMENDATIONS ....................................................................................... 62 6.1. : MAIN FINDINGS AND CONCLUSIONS ........................................................................................................................62 6.2. : RECOMMENDATIONS ............................................................................................................................................64 CHAPTER 7: REFERENCES ..................................................................................................................................... 66
v
LIST OF FIGURES FIGURE 1-1 DIAGRAM REPRESENTING THE METHODOLOGY ADOPTED IN THIS THESIS. EACH STEP OF THE METHODOLOGY IS CONNECTED TO ITS RESPECTIVE CHAPTERS WHERE THEY ARE EXPLAINED. PLEASE NOTE SOME TASKS ARE CONNECTED TO MULTIPLE CHAPTERS, MEANING THAT THE SAME GOAL IS APPROACHED USING DIFFERENT TECHNIQUES/ALGORITHMS. ................................................ 3 FIGURE 2-1 SCHEMATIC DIAGRAM OF AN EXAMPLE RADIOGRAPHIC TESTING SYSTEM. IMAGE TAKEN FROM [4]. .....................................7 FIGURE 2-2 ACOUSTIC EMISSION APPLIED TO ROTATING MACHINERY TESTING. IMAGE TAKEN FROM [7]...............................................8 FIGURE 2-3 EXPLANATORY DIAGRAM FOR EDDY CURRENT TESTING PRINCIPLE. IMAGE TAKEN FROM [12]. ............................................8 FIGURE 2-4 AN EXAMPLE DIAGRAM FOR SCANNING ACOUSTIC LASER MICROSCOPY. IMAGE TAKEN FROM [16]. ...................................9 FIGURE 2-5 EXPERIMENTAL SETUP FOR LOCK-IN THERMOGRAPHY, A SUBSET OF IR THERMOGRAPHY. IMAGE TAKEN FROM [19]. ............10 FIGURE 2-6 SCHEMATIC DIAGRAM OF THE FLUX LEAKAGE UTILISED IN ELECTROMAGNETIC TESTING TECHNIQUES. IMAGE TAKEN FROM [24]. ............................................................................................................................................................................11 FIGURE 2-7 REPRESENTATIVE DIAGRAM FOR AN ULTRASONIC TESTING SYSTEM. BLUE OBJECT REPRESENTS THE TRANSDUCER; THE WAVE PROPAGATING THROUGH THE MATERIAL IS SHOWN WITH CURVES. ..................................................................................... 12 FIGURE 2-8 AN EXAMPLE DISPERSION CURVE FOR AN ALUMINIUM WIRE OF 3.4 MM DIAMETER. SHOWN CURVES ARE FUNDAMENTAL TORSIONAL (YELLOW), FUNDAMENTAL LONGITUDINAL (MAGENTA), FUNDAMENTAL FLEXURAL (GREEN) AND TWO HIGHER ORDER WAVE MODES. ......................................................................................................................................................... 16 FIGURE 3-1 FLOW DIAGRAM OF ADOPTED METHODOLOGY. ......................................................................................................20 FIGURE 3-2 PHOTOGRAPHS OF (A) 6- SHEAR MODE PZT TRANSDUCER COLLAR, (B) CABLE CROSS SECTION AND (C) TRANSDUCER COLLAR MOUNTED ON THE CABLE. .......................................................................................................................................... 21 FIGURE 3-3 SCHEMATIC DIAGRAM OF THE CROSS SECTION OF THE CABLE SHOWING THE LSV SCAN AREA. ..........................................22 FIGURE 3-4 SINGLE-WIRE GROUP VELOCITIES FOR (A) 3.4 MM DIAMETER STEEL AND (B) 3.4 MM DIAMETER ALUMINUM. .....................23 FIGURE 3-5 DIAGRAM ILLUSTRATING THE GEOMETRY OF THE LSV (A) GRID SCAN COVERING MULTIPLE WIRES AND (B) A LINE SCAN OVER AN INDIVIDUAL WIRE. .................................................................................................................................................... 24 FIGURE 3-6 SCHEMATIC OF PULSE-ECHO EXPERIMENT FOR 26.5 M CABLE SHOWING (A) MASSES ATTACHED TO THE CABLE AND (B) SAW CUTS INTRODUCED INTO THE CABLE.............................................................................................................................. 24 FIGURE 3-7 PHOTOGRAPH OF (A) MASSES ATTACHED ON THE CABLE AND (B) 6.5 MM-DEEP, 1 MM-WIDE SAW CUT. ...........................24 FIGURE 3-8 CSA FFT SCAN RESULTS OF (A) VELOCITY VALUES IN DB FOR ~223 KHZ (REPRESENTATIVE FREQUENCY) AND (B) VELOCITY FFT OF A SINGLE SCAN POINT FOR X, Y AND Z DIRECTIONS (I TO III) (INNER ALUMINUM WIRE)........................................................ 25 FIGURE 3-9 3D-VELOCITY VALUES ARE SHOWN (IN DB) FOR SURFACE SCAN CONFIGURATION SHOWN FOR VARIOUS FREQUENCIES AT TIMES WHERE VELOCITY VALUES PEAK; (A) 20 KHZ (T=0.515 MS IN FIG. 10 (A-B-C)), (B) 125 KHZ (T=0.261 MS IN FIG. 10 (D-E-F)), (C) 250 KHZ (T=0.236 MS IN FIG. 10 (G-H-I)). .................................................................................................................26 FIGURE 3-10 GRAPHS OF THE LSV MEASURED VELOCITIES, FOR THE POINT ON THE CABLE SHOWN IN FIG. 9, IN THE X-Y-Z AXIS DIRECTIONS FOR (A-B-C) 20 KHZ, (D-E-F) 125 KHZ, (G-H-I) 250 KHZ. ............................................................................................... 26 FIGURE 3-11 GRAPHS SHOW SHORT-TIME FOURIER OF VELOCITY FOR BROADBAND PULSE EXCITATION WITH ARRIVAL CURVES OVERLAID FOR; DIRECT ARRIVAL AND FIRST ECHO OF L(0,1) MAGENTA LINE, T(0,1) BLACK LINE, AND F(1,1) GREEN IN THE (A) X, (B) Y, AND (C) Z AXES DIRECTIONS. ..................................................................................................................................................27 FIGURE 3-12 EXPERIMENTALLY MEASURED DISPERSION CURVES IN THE WAVENUMBER FREQUENCY DOMAIN FOR THE (A) X, (B) Y AND (C) Z DIRECTIONS. OVERLAID ARE THE THEORETICAL DISPERSION CURVES, FOR ALUMINUM RODS OF THE SAME DIAMETER AS THE WIRES, WHICH WERE CALCULATED USING DISPERSE. .................................................................................................................. 28 FIGURE 3-13 GRAPHS OF A SINGLE MASS ATTACHED ON THE CABLE FOR (A) 220 KHZ EXCITATION RESPONSE AND THE (B) REFLECTION ECHO RMS VS. FREQUENCY; TWO MASSES ATTACHED ON THE CABLE (C) 250 KHZ EXCITATION RESPONSE AND (D) REFLECTION ECHOES RMS VS. FREQUENCY. ................................................................................................................................... 29
vi
FIGURE 3-14 GRAPHS OF (A) 260 KHZ EXCITATION RESPONSE OF 2.5 MM CUT, (C) 250 KHZ EXCITATION RESPONSE OF 6.5 MM CUT, (B) CUT DEPTH VS. REFLECTION ECHO RMS VS. FREQUENCY AND (D) CUT DEPTH VS. ECHO RMS INFORMATION OBTAINED AT 250 KHZ EXCITATION. DEFECT ECHOES ARE CIRCLED IN (A) AND (C). ............................................................................................... 30 FIGURE 4-1 GRAPHS SHOW THE TIME TRACES OBTAINED FOR 260 KHZ EXCITATION RESPONSE OF 2.5 MM CUT (A) ORIGINAL AND (B) WAVELET DENOISED; TIME TRACES OBTAINED FOR 275 KHZ EXCITATION RESPONSE OF 4 MM CUT (C) ORIGINAL AND (D) WAVELET DENOISED. DEFECT ECHOES ARE CIRCLED IN ALL SUBPLOTS. ............................................................................................... 34 FIGURE 4-2 GRAPHS SHOW SNR VS. CUT DEPTH FOR (A) ORIGINAL SIGNALS AND (B) ORIGINAL SIGNALS CORRUPTED BY VARIOUS LEVELS OF AWGN AND THEN DENOISED VIA WAVELET DENOISING. GREY HORIZONTAL LINE INDICATES THE DETECTION THRESHOLD. .............35 FIGURE 4-3 GRAPHS SHOW THE TIME TRACES OBTAINED FOR 260 KHZ EXCITATION RESPONSE OF 2.5 MM CUT (A) ORIGINAL, (B) UNDER 10 DB AWGN AND (C) UNDER 10 DB AWGN AND WAVELET DENOISED; TIME TRACES OBTAINED FOR 250 KHZ EXCITATION RESPONSE OF 6.5 MM CUT (D) ORIGINAL, (E) UNDER -5 DB AWGN AND (F) UNDER -5 DB AWGN AND WAVELET DENOISED. DEFECT ECHOES ARE CIRCLED IN ALL SUBPLOTS. .................................................................................................................................... 36 FIGURE 4-4 GRAPHS SHOW THE TIME TRACES OBTAINED FOR 275 KHZ EXCITATION RESPONSE OF 4 MM CUT (A) ORIGINAL, (B) TIME SCALED AND (C) TIME SCALED AND WAVELET DENOISED . ............................................................................................................ 37 FIGURE 4-5 SPECTROGRAM OF THE SCALED TIME DOMAIN SIGNAL. THREE SETS OF ECHOES CAN BE SEEN IN THE DATA. .........................39 FIGURE 4-6 SPECTROGRAM OF A SECTION OF THE RECEIVED SIGNAL. THE BLACK DOTS SHOW PEAKS OBTAINED FROM THIS DATA FOR THE FIRST ECHO FROM THE CUT NEAR THE END OF THE CABLE. FITTED DISPERSION CURVE IS THEN OVERLAID ON THIS SPECTROGRAM (GREEN). ................................................................................................................................................................40 FIGURE 4-7 ORIGINAL (DASHED LINES) AND HELICAL CORRECTED (SOLID LINES) THEORETICAL GROUP VELOCITY DISPERSION CURVES FOR ALUMINUM WIRES IN THE CABLE SHOWING LONGITUDINAL L(0,1), TORSIONAL T(0,1), AND FLEXURAL F(1,1) WAVE MODES OBTAINED USING DISPERSE. ....................................................................................................................................... 40 FIGURE 4-8 SPECTROGRAM OF THE TIME SCALED SIGNAL OBTAINED USING MLS EXCITATION. OVERLAID ON TOP ARE THE ARRIVAL TIMES CALCULATED USING THE PROPAGATION DISTANCES SHOWN IN TABLE 1 AND THE THEORETICAL GROUP VELOCITY DISPERSION CURVE FOR THE ALUMINUM LONGITUDINAL WAVE MODE........................................................................................................... 41 FIGURE 4-9 PLOTS OF THE TIME DOMAIN DISPERSED, TIME SCALED, AND TIME SCALED-DISPERSION COMPENSATED SIGNAL (LEFT TO RIGHT). ............................................................................................................................................................................42 FIGURE 4-10 PLOT SHOWING THE NORMALIZED HILBERT TRANSFORM OF THE DISPERSED AND DISPERSION COMPENSATED SIGNALS MEASURED ON THE CABLES FOR MLS EXCITATION SIGNAL. ............................................................................................... 42 FIGURE 4-11 (A) SPECTROGRAM OF THE DISPERSION COMPENSATED SIGNAL USING MLS EXCITATION, (B) TRACE OBTAINED BY SUMMING THE COLUMNS OF THE SPECTROGRAM DATA (UNITS OF DB). ............................................................................................. 42 FIGURE 4-12 (A) PLOTS OF THE TIME DOMAIN DISPERSED AND DISPERSION COMPENSATED-FILTERED SIGNAL FOR THE LONG MLS RECORDING, (B) SPECTROGRAM OF THE DISPERSION COMPENSATED-FILTERED DATA (LEFT TO RIGHT). ...................................... 43 FIGURE 4-13 A-SCAN TIME TRACE OF THE DISPERSED AND DISPERSION COMPENSATED SIGNALS. ......................................................43 FIGURE 4-14 A-SCAN OF THE DISPERSED AND DISPERSION COMPENSATED SIGNALS OBTAINED USING A)TONE BURST EXCITATION AND B) HANN-WINDOWED TONE BURST EXCITATION, BOTH OF WHICH ARE CENTERED AT 240 KHZ AND EXCITED WITH 5-CYCLES (LEFT TO RIGHT). .................................................................................................................................................................. 44 FIGURE 5-1 BLOCK DIAGRAM OF THE PROPOSED TECHNIQUE. ....................................................................................................49 FIGURE 5-2 SYNTHESIZED CHIRP SIGNAL IN (A) TIME DOMAIN AND (B) ITS AUTO CORRELATION; SYNTHESIZED MLS SIGNAL IN (C) TIME DOMAIN AND (D) ITS AUTO CORRELATION. .................................................................................................................... 50 FIGURE 5-3 GROUP VELOCITY DISPERSION CURVES OF AN ALUMINUM ROD OF 8MM DIAMETER. THE FUNDAMENTAL MODES ARE SHOWN BY ARROWS; HIGHER ORDER FLEXURAL AND LONGITUDINAL MODES ARE SHOWN IN BLUE AND RED, RESPECTIVELY. .......................... 50 FIGURE 5-4 SPECTROGRAMS OF SYNTHESIZED UNIMODAL SIGNALS WITH FUNDAMENTAL FLEXURAL VGR DISPERSION CURVE (BLACK DOTTED LINES) OVERLAID; (A) LINEAR CHIRP (DISPERSED FOR 4.3 M DISTANCE) AND (B) DISPERSION COMPENSATED LINEAR CHIRP; (C) MLS (DISPERSED FOR 4.3 M DISTANCE) AND (D) DISPERSION COMPENSATED MLS. ......................................................................51 FIGURE 5-5 UNIMODAL SYNTHESIS RESULTS FOR THE PROPOSED TECHNIQUE; (A) DISPERSED (FOR 4.3 METERS) CHIRP (RED), COMPENSATED (GREEN), NORMALIZED CROSS-CORRELATION (BLUE) BETWEEN DISPERSED AND COMPENSATED SIGNAL, (B) CHIRP
vii
SIGNAL’S MAXIMUM CROSS CORRELATION (NORMALIZED TO ITS PEAK VALUE) TRACE AS A FUNCTION OF DISTANCE, (C) DISPERSED
(FOR 4.3 METERS) MLS (RED), COMPENSATED (GREEN), NORMALIZED CROSS-CORRELATION (BLUE) BETWEEN DISPERSED AND COMPENSATED SIGNAL, (D) MLS SIGNAL’S MAXIMUM CROSS CORRELATION (NORMALIZED TO ITS PEAK VALUE) TRACE AS A FUNCTION OF DISTANCE. .......................................................................................................................................................... 51 FIGURE 5-6 SPECTROGRAMS OF SYNTHESIZED MULTI-MODAL SIGNALS WITH FUNDAMENTAL FLEXURAL (BLACK DOTTED LINES) AND LONGITUDINAL (BROWN DOTTED LINES) VGR DISPERSION CURVE OVERLAID; (A) LINEAR CHIRP (DISPERSED 4.3 M FOR FLEXURAL AND 8.6 M FOR LONGITUDINAL) AND (B) DISPERSION COMPENSATED LINEAR CHIRP; (C) MLS (DISPERSED 4.3 M FOR FLEXURAL AND 8.6 M FOR LONGITUDINAL) AND (D) DISPERSION COMPENSATED MLS. .................................................................................... 52 FIGURE 5-7 MULTIMODAL SYNTHESIS RESULTS FOR THE PROPOSED TECHNIQUE; (A) DISPERSED (DISPERSED 4.3 M FOR FLEXURAL AND 8.6 M FOR LONGITUDINAL) CHIRP (RED), COMPENSATED (GREEN), NORMALIZED CROSS-CORRELATION (BLUE) BETWEEN DISPERSED AND COMPENSATED SIGNAL, (B) CHIRP SIGNAL’S MAXIMUM CROSS CORRELATION (NORMALIZED TO ITS PEAK VALUE) TRACE AS A FUNCTION OF DISTANCE, (C) DISPERSED (DISPERSED 4.3 M FOR FLEXURAL AND 8.6 M FOR LONGITUDINAL) MLS (RED), COMPENSATED (GREEN), NORMALIZED CROSS-CORRELATION (BLUE) BETWEEN DISPERSED AND COMPENSATED SIGNAL, (D) MLS SIGNAL’S MAXIMUM CROSS CORRELATION (NORMALIZED TO ITS PEAK VALUE) TRACE AS A FUNCTION OF DISTANCE....................... 53 FIGURE 5-8 REPRESENTATIVE DIAGRAM FOR THE EXPERIMENTAL SETUP.......................................................................................54 FIGURE 5-9 PLOT OF THE CHIRP SIGNAL FED TO THE TRANSDUCER IN (A) TIME DOMAIN AND (B) ITS AUTO CORRELATION; PLOT OF THE MLS SIGNAL FED TO THE TRANSDUCER IN (C) TIME DOMAIN AND (D) ITS AUTO CORRELATION. ........................................................ 55 FIGURE 5-10 MEASURED SIGNALS’ SPECTROGRAMS WITH FUNDAMENTAL FLEXURAL (BLACK DOTTED LINES) AND LONGITUDINAL (BROWN DOTTED LINES) VGR DISPERSION CURVE OVERLAID. SHOWN PLOTS ARE (A) LINEAR CHIRP, (B) DISPERSION COMPENSATED LINEAR CHIRP, (C) MLS AND (D) DISPERSION COMPENSATED MLS. TWO WAVE MODES SHOWN IN (A) AND (C) ARE THE FIRST ECHO OF THE FUNDAMENTAL FLEXURAL MODE AND THE SECOND ECHO OF THE FUNDAMENTAL LONGITUDINAL MODE..................................... 55 FIGURE 5-11 PLOTS SHOW TIME DOMAIN REPRESENTATIONS OF (A) MEASURED CHIRP SIGNAL, (B) DISPERSION COMPENSATED (FOR 4.3 M) CHIRP SIGNAL AND (C) CROSS-CORRELATION BETWEEN EXCITATION AND DISPERSION COMPENSATED CHIRP SIGNAL; (D) MEASURED MLS SIGNAL, (E) DISPERSION COMPENSATED (FOR 4.3 M) MLS SIGNAL, AND (F) CROSS-CORRELATION BETWEEN EXCITATION AND DISPERSION COMPENSATED MLS SIGNAL. ..................................................................................................................... 56 FIGURE 5-12 PLOTS SHOW TIME DOMAIN REPRESENTATIONS OF (A) MEASURED CHIRP SIGNAL, (B) DISPERSION COMPENSATED (FOR 8.6 M) CHIRP SIGNAL AND (C) CROSS-CORRELATION BETWEEN EXCITATION AND DISPERSION COMPENSATED CHIRP SIGNAL; (D) MEASURED MLS SIGNAL, (E) DISPERSION COMPENSATED (FOR 8.6 M) MLS SIGNAL AND (F) CROSS-CORRELATION BETWEEN EXCITATION AND DISPERSION COMPENSATED MLS SIGNAL. ..................................................................................................................... 57 FIGURE 5-13 PLOT SHOWS THE RESULTS OF THE ITERATIVE TECHNIQUE; MAXIMUM CROSS-CORRELATION TRACE, AS A FUNCTION OF DISTANCE, OF EXPERIMENTALLY RECEIVED CHIRP (RED) AND MLS (BLUE) SIGNALS (COMPENSATION PERFORMED ON FLEXURAL). LONGITUDINAL- BASED COMPENSATION RESULT ARE SHOWN IN BLACK AND GREEN LINES (CHIRP AND MLS). .............................58
viii
LIST OF TABLES TABLE 3-1 CABLE INFORMATION. ........................................................................................................................................21 TABLE 4-1 TABLE OF DISTANCES USED TO CALCULATE THE ARRIVAL TIMES FOR THE THREE SETS OF ECHOES IN FIGURE 8. THE DISTANCES C AND L ARE THE DISTANCE FROM THE ARRAY TO CUT AND TO THE END OF THE CABLE, 25 AND 26.5M, RESPECTIVELY. ................... 41 TABLE 5-1 TABLE SHOWS THE SNR VALUES FOR UNIMODAL (SINGLE), MULTIMODAL (MULTI) AND EXPERIMENTAL (EXP) SIGNALS FOR CHIRP AND MLS EXCITATIONS. SNR VALUES ARE CALCULATED USING (7). CASES DENOTED BY –L ARE LONGITUDINAL BASED COMPENSATION RESULTS, THE REST ARE BASED ON FLEXURAL MODE COMPENSATION. UNITS ARE IN DB SCALE. RAW COLUMNS ARE THE SNR VALUES OF RAW SIGNALS, RESULT COLUMNS ARE RESULTING SNRS OF COMPENSATED AND THEN COMPRESSED PULSES. .. 59 TABLE 5-2 TABLE SHOWS THE DETECTION RATES (OUT OF 100 REPETITIONS) OF THE PROPOSED TECHNIQUE (FOR FLEXURAL MODE COMPENSATION) USING EXPERIMENTAL SIGNALS WITH VARIOUS NOISE LEVELS (-20 TO 20 DB) FOR MLS EXCITATION. EACH COLUMN REPRESENTS A NOISE POWER AND EACH ROW REPRESENTS A DIFFERENT CLASSIFICATION. CLASS DEFINITIONS ARE SHOWN IN ALGORITHM 1. ........................................................................................................................................................59 TABLE 5-3 TABLE SHOWS THE DETECTION RATES (OUT OF 100 REPETITIONS) OF THE PROPOSED TECHNIQUE (FOR FLEXURAL MODE COMPENSATION) USING EXPERIMENTAL SIGNALS WITH VARIOUS NOISE LEVELS (-20 TO 20 DB) FOR CHIRP EXCITATION. EACH COLUMN REPRESENTS A NOISE POWER AND EACH ROW REPRESENTS A DIFFERENT CLASSIFICATION. CLASS DEFINITIONS ARE SHOWN IN ALGORITHM 1. ........................................................................................................................................................60
ix
LIST OF ABBREVIATIONS
LIST OF NOMENCLATURE
NDT
Non-Destructive Testing
H
Curl of a vector potential
RT
Radiography Testing
φ
Sum of a scalar compressional gradient
AE
Acoustic Emission
Cl, Cs, Cs Longitudinal, shear and Rayleigh wave velocity
ECT
Eddy Current Testing
𝝆
Material density
SEM
Scanning Electron Microscopy
𝝁,𝛌
Lamé constants; dynamic viscosity and first parameter
MPI
Magnetic Particle Inspection
Al, As
Longitudinal and shear wave amplitude
MFL
Magnetic Flux Leakage
kl, ks
Longitudinal and shear wavenumber
ACFM
Alternating Current Field Measurement
E
Young’s Modulus
UGW
Ultrasonic Guided Waves
ℾ
Coordinate variation (in spherical system)
OVTL
Overhead Transmission Line
𝒖
Displacement fields (in spherical system)
ACSR
Aluminum Conductor Steel Reinforced
𝝎
Angular frequency
PZT
Lead Zirconium Titanate
𝝈
Standard deviation
LSV
Laser Scanning Vibrometry
𝜶
Positive constant for attenuation correction
CSA
Cross Sectional Area
𝑰𝑭𝑭𝑻
Inverse Fourier Transform operation
STFT
Short Time Fourier Transform
𝒄𝒄𝒇
Cross correlation operation
LRUT
Long Range Ultrasonic Testing
𝜹
Dirac-delta function
SNR
Signal to Noise Ratio
Vgr, Vph
Group and phase velocity (Cgr, Cph)
RMS
Root Mean Square
𝐋𝐇𝐞𝐥𝐢𝐜𝐚𝐥
Helical Length
DWT
Discrete Wavelet Transform
WFT
Warped Frequency Transform
PuC
Pulse Compression
ToF
Time of Flight
WDR
Wideband Dispersion Reversal
AWGN
Additive White Gaussian Noise
TCG
Time Corrected Gain
MLS
Maximal Length Sequences
LFSR
Linear Feedback Shift Register
x
Research Background and Motivation
CHAPTER 1: Research Background and Motivation 1.1. :Overview This short chapter serves as an executive summary to give the readers an overview of the research reported in this thesis along with a summary of the methodology, brief information about the research background, aims of the research, an organization of the entire thesis and the novelties arising from this thesis, many of which are submitted to scientific journals and conferences.
1.2. :Non-Destructive Testing and Ultrasonic Guided Waves Non-Destructive Testing (NDT) techniques are extensively used in numerous branches of industry to monitor the integrity of industrial components for two main reasons; meeting the health and safety criteria for the personnel and to stay informed about the health of the components to keep monetary consequences under control. NDT techniques based on various branches of science exist; from visual inspection to electromagnetic testing, x-rays, RF-noise control, infrared methods, ultrasonic and many more. As heavy industry is in dire need of efficient methods, academia stepped up to meet the demands and to further advance the existing methods for increased inspection quality and reduced cost, thus fueling the recent interest in NDT research. Although ultrasonic testing has been widely used as an NDT technique for a long time, recent advances made in the last few decades opened a new frontier as a sub-branch of ultrasound in heavy industry; ultrasonic guided waves. Owing to its long range propagation capability, which in turn means reduced operational costs and opportunity of scanning long ranges from a single contact point, ultrasonic guided waves emerged as a valid and attractive field of research, both for industry and academia. Several industries, such as oil/gas, civil engineering and aviation have been injecting a lot of money, both for inspection and permanent monitoring purposes. Although its theory is well-documented for rather simple structures and its associated software tools for engineering purposes have reached a certain level of maturity, there are still unexplored areas of ultrasonic guided waves research as the wave propagation characteristics is highly dependent on the structure of interest. Moreover, there are still problems that guided wave applications inherited from its physical properties, such as detectability of small defects, closely spaced defects, detecting defects under noisy conditions, accurate localization of defects and limited inspection range. When afore mentioned problems are coupled with the highly complex problem of wave propagation modeling in complex structures, one can see the complexity of the problem increases dramatically.
1.3. :Research Motivation As the existing power line cable network is reaching a considerable age, there is a huge need for inspection of power line cables. Moreover, the hostile operating conditions that the power line cables 1
Research Background and Motivation are working in means that cables are prone to errors. Considering that power line cables are the only means to transport power between long distances and the ever increasing energy consumption in the world, the problem of inspection power line cables is an attractive problem both for industry and academia. There are various existing methods applied for NDT of power line cables, such as helicopter assisted visual inspection, eddy current based inspection, radio frequency noise monitoring, fiber optic monitoring, robotics-powered systems and infrared systems. However, those systems still have inherent drawbacks either in terms of cost, applicability or inspection range. There have been attempts by the academia to investigate ultrasonic guided waves for power line cables, but it has proved itself to be a highly complex problem due to cables’ non-linear structure (i.e. inter-wire contact) and the hardship of obtaining an analytical solution, or lack thereof. Existing applications are also extremely limited in inspection range, lowering the chances of monetization and also leaving a gap in the scientific literature.
1.4. :Aims and Objectives Inspired by the problems outlined in the previous part, this research attempts to further investigate guided wave propagation in power line cables and to advance the state of the art with an emphasis on industrial applicability of the guided wave technology. The specific objectives of this research are outlined below.
To investigate the wave propagation in power line cables in-depth using theoretical analysis and extensive experimental work.
To optimize guided wave propagation to increase inspection range for power line cables from one single contact point.
To develop or implement existing signal processing methods to further increase inspection range.
To develop or implement existing signal processing methods to increase captured signal quality.
To develop or implement existing signal processing methods to accurately and automatically localize structural discontinuities, thus lowering the operational requirements.
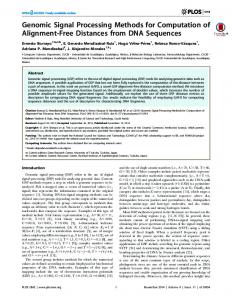
1.5. :Summary of the Methodology and Organisation of the Thesis In this thesis, the problem of UGW based inspection of OVTL cables is approached with an emphasis on experimentation. Therefore, the methodology adopted in this thesis starts with experimentation and then required comparisons and derivations are made using analytical or numerical models. As visualized in Figure I-1, a wide data base of signals is created through intensive experimentation on ACSR cables spanning various defect scenarios. This is followed by post-processing chapters which cover various techniques, either developed from scratch or adopted/optimized from existing literature, to address various problems of UGW based NDT systems.
2
Research Background and Motivation
Figure 1-1 Diagram representing the methodology adopted in this thesis. Each step of the methodology is connected to its respective chapters where they are explained. Please note some tasks are connected to multiple chapters, meaning that the same goal is approached using different techniques/algorithms.
The content of this research is presented in three main chapters, all of which attack the problem of inspection of power line cables from various perspectives. Firstly, a thorough introductory chapter is presented (Chapter 1) which provides the readers with the necessary state-of-the-art information about NDT techniques, the analytical models of UGW and important concepts such as wave modes and dispersion. Following this introduction, thesis closely follows the methodology presented above. The problems are listed as the characterization and optimization of wave propagation for increased range of inspection for power line cables via thorough experimentation(Chapter 3), analysis and development of signal processing methods for signal quality improvement and inspection range enhancement (Chapter 4), and to automatically and accurately localize defects for all existing guided wave applications (Chapter 5). There are various aspects of this work which include novel approaches and contributions to knowledge. Next section of this chapter outlines the novelties.
1.6. :Contributions to Knowledge The novelties reported in thesis are briefly outlined below in a chapter-by-chapter basis.
Chapter 3 o Through vibrometer and defect-detection analysis, a long cable (25 m) is successfully scanned for defects using a pulse-echo scheme (single contact point). To the best of author’s knowledge, this is the longest range achieved for a guided-wave based inspection of power line cables so far. Defect corresponding to 4.5% decrease in cross sectional area of the cable is successfully detected. Frequency optimization studies indicate that by increasing the excitation frequency and concentrating the wave energy 3
Research Background and Motivation
to the outer wires of the cable (via skin effect), one can inspect long sections of power line cables. This result also has a significant merit in the sense that guided wave applications are generally low frequency (