Signal Processing methods for suppressing Interference in SIP LIU Wei-qiang 1,2 CHEN Ru-jun2 LIN pin-rong1 (1. Chinese Academy Of Geological Science Institute of Geophysical and Geochemical Exploration CAGS,Langfang, Hebei 065000, China; 2. Central South University,School of Geo—science and Info—physics Engineering, Changsha, Hunan 410083, China) ABSTRACT: With the development of industry, electromagnetic (EM) interference has been a challenging problem in Spectrum Induced Polarization (SIP) exploration, including noise interference and EM coupling. Multiple methods are adopted to improve the SIP data quality. For noise interference, robust statistical method is studied, in addition, coherence analysis between current data and potential data is also applied to extract data with high SNR. For EM coupling interference, effect of relative phase spectrum for removing coupling interference in complex resistivity phase spectrum is studied based on the previous research. Inverse differential operation is adopted to correct amplitude spectrum. We demonstrate the effectiveness of our processing approach by showing examples of SIP data acquired in a very noisy survey area. Keywords Spectrum Induced Polarization; electromagnetic interference ; Robust statistical method; Coherence analysis; Relative Phase; Corrected amplitude
20 10
0
50 100 Stack times ( a2 )
150
30 20 10
0
50 100 Stack times ( a3 )
150
30 20 10
0
50 100 Stack times
150
Resisty ( *m )
40
30
Resisty( *m )
Phase ( mrad ) Phase ( mrad )
40
Phase ( mrad )
( a1 ) 40
Resisty ( *m )
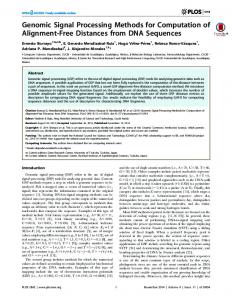
1. Robust statistical method for suppressing noise There are robust M estimate for 1-D data and robust regression for Multi-D data [1]. We implement robust statistical method to SIP data processing. Robust regression is used to fit and remove linear trend from the original data. Robust M estimate is used to stack the data of all periods. Robust smooth filter is used to suppress residual noise in data after stacking. Robust M estimate can be used to stack potential difference data and current data of all periods in time domain, also can be used to stack amplitude spectrum and phase spectrum of complex resistivity in all periods in frequency domain. We observed 160 periods of SIP data. In order to study the convergence of calculating results with stack times, we calculate the complex resistivity and error of stacking 10 times to160 times. Figiure1 show the convergence with stack times using different methods. ( b1 ) 785 780 775
0
50 100 Stack times ( b2 )
150
0
50 100 Stack times ( b3 )
150
0
50 100 Stack times
150
785 780 775
785 780 775
LIU Wei-qiang:
[email protected]. CHEN Ru-jun:
[email protected]. LIN Pin-rong:
[email protected]
Figure 1. Convergence of complex resistivity at 0. 16 Hz with stack times for different processing methods: (a1) Phase using mean stack; (a2) Phase using robust stack in time domain; (a3) Phase using robust stack in frequency domain; (b1) Amplitude using mean stack; (b2) Amplitude using robust stack in time domain; (b3)Amplitude using robust stack in frequency domain.
In figure1, the convergence of ordinary mean stack is poor. Result of different stack times is also different. For the robust methods both in the time domain and frequency domain, the outliers are down weighted and the calculated result is more accurate when stacking little times. Robust processing can improve the quality of SIP data and save measuring time. 2. Coherence analysis for extraction of SIP data with high SNR Robust processing can reduce noise effectively, however the percentage of outliers may exceed breakdown (50% ) when EM interference is serious. Coherence analysis between current data and potential data is investigated to solve it [2]. For Multiple periods SIP data, we calculate coherence of current data 𝑥𝑖 and potential difference data 𝑦𝑖 in each period through formula: ∑n1(𝑥𝑖 − 𝑥̅ )(𝑦𝑖 − 𝑦̅) ∁= (1) √∑n1(𝑥𝑖 − 𝑥̅ )2 ∑𝑛1(𝑦𝑖 − 𝑦̅)2 The higher coherence of current data and potential difference is, the higher SNR of potential data is. Vice versa. Using coherence analysis to extract data with high SNR and using robust methods for
subsequent processing, we can get more accurate complex resistivity spectrum. The processing results for a survey line are showed in Figure 2. Phase at 0.16 Hz Phase at 0.41 Hz Phase at 0.66 Hz Phase at 0.91 Hz Amplitude at 0.16 Hz Amplitude at 0.41 Hz Amplitude at 0.66 Hz Amplitude at 0.91 Hz
1200
1000
800
100
600 400
10
Resistivity ( m )
Phase ( mrad )
1000
200 0
1 0
200
400
600
800
1000
1200
1400
1600
1800
2000
Distance ( m )
Figure 2. Phase and amplitude at 4 frequencies of a survey Line by coherence analysis and robust process
In Figure 2, for the phase profile, there is a high-phase abnormity from distance 800 m to 960 m, and a low-phase abnormity on the right side. For the amplitude profile, there is a low-resistivity abnormity, and a high-resistivity abnormity on the right side. Characteristics of phase and amplitude are entirely consistent with the tilting plate model. There is a lead and zinc ore fault initially detected located in the survey area, which is approximately equivalent to a inclined plate body with high polarization and low resistivity. This can illustrate that the results of data processing are reliable. 3. Correcting methods for removing EM coupling Interference For SIP exploration, EM coupling is a kind of interference, international experts have made a lot of research findings for decoupling, including EM coupling forward computing based on uniform
terrestrial condition and Layered medium, correction technique of multiple frequencies, Fitting electromagnetic coupling using Cole-Cole model, direct decoupling scheme by chop wave and so on [3-7] . In this paper, effect of relative phase spectrum for decoupling in complex resistivity phase spectrum is studied based on the previous research findings of International experts. Inverse differential operation is adopted to correct amplitude spectrum at low frequencies. The decoupling methods are based on two assumptions: (1) At low frequencies (0.01 Hz—10 Hz), change of IP phase spectrum is small, however, EM coupling phase increases with frequency proportionally. (2) At low frequencies (0.01 Hz—10 Hz), change of IP amplitude spectrum is similar to an oblique line, however, EM coupling amplitude is N power of frequency [3-5]. Relative phase spectrum can be used for decoupling in complex resistivity phase spectrum [8]. The formula is:
∆φ =
𝑘𝜑𝑑 −𝜑𝑔
𝑓𝑔
𝑘=𝑓
𝑘−1
(2)
𝑑
IP amplitude spectrum is linear approximately and EM coupling amplitude and other interference is nonlinear approximately at low frequencies. Second derivative of linear function is 0 and nonlinear function is not 0. Calculating the second derivative of complex resistivity amplitude spectrum through forward difference and making inverse differential operation, we can get the nonlinear component. Linear component which represents amplitude spectrum of pure IP can be obtained through subtracting the nonlinearity. Using the relative phase spectrum and inverse differential operation methods to correct SIP data at low frequencies measured in a survey point, the results is showed in Figure 3. (a)
(b) 1400
Amplitude ( .m )
Phase ( mrad )
800 Phase Relative Phase
600 400 200 0 -200
-2
10
0
10 Frequency ( Hz ) (c)
1000 800 600 400
2
10
-2
10
300
2
10
60 Relative Error
200 100 0
0
10 Frequency ( Hz ) (d)
Absolute Error
Error ( % )
Error( mrad )
Amplitude Corrected Amplitude
1200
-2
10
0
10 Frequency ( Hz )
2
10
40 20 0
-2
10
0
10 Frequency ( Hz )
2
10
Figure 3. Phase spectrum and amplitude spectrum and the error before and after correction (Solid circle markers represent results and error at low frequencies )
From Figure 3,we can see that there is EM coupling for complex resistivity spectrum even at low frequencies 0.01 Hz—10 Hz. Phase became positive value and amplitude increases at some frequencies, chargeability will become negative value. After correction, relative phase spectrum become negative value with small change, corrected amplitude decrease with frequencies similar to a linear function. The phase and amplitude at very low frequencies are consistent before and after correction. The relative error increases with frequency owing to the EM coupling. When frequency is larger than 10 Hz, The correction is not effective, because the assumptions are not satisfied. In order to demonstrate the effectiveness of correcting approach, we process SIP data in a survey line. Figure 4 compared results before and after correction.
Phase ( mrad ) Amplitude ( .m )
a1 b1 c1
400 200 0 5
10
15 Survey Points
20
25
10
15 Survey Points
20
25
10
15 Survey Points
20
25
4
10
0
10
5
a2 b2 c2
Fs ( % )
20 0 -20 -40 5
a3 b3 c3
Figure 4 Phase, amplitude and chargeability at 0.01 Hz and 1 Hz before and after correction (a1,a2,a3: Phase, amplitude and chargeability at 0.01 Hz; b1,b2,b3: Phase, amplitude and chargeability at 1 Hz; c1,c2,c3: Relative Phase, corrected amplitude and chargeability at 1 Hz)
At 0.01 Hz, EM coupling is weak, the profile curve is mainly represent IP effect. At 1 Hz, for the survey points at low resistivity, EM coupling is strong, phase curve become positive value, chargeability become negative value. After correction, curve of relative phase and corrected chargeability at 1 Hz is consistent with curve of phase and chargeability at 0.01 Hz, which can demonstrate the effectiveness of correction. The algorithm is simple and effective.
4. Conclusion 1. Long-time data acquisition, coherency analysis and Robust processing can suppress noise interference effectively, which can improve data quality and save measuring time in filed. 2. At low frequencies, relative phase spectrum and inverse differential operation can suppress EM coupling interference partly. However, the correction is not reliable at high frequencies.
REFERENCES [1] Huber P J. Robust statistics [M]. Springer Berlin Heidelberg, 1981. [2] Stigler S M. Francis Galton's Account of the Invention of Correlation [J]. Statistical Science, 1989, (2):73-79. [3] Zonge K L, Wynn J C. Recent advances and applications in complex resistivity measurements [J]. Geophysics, 2012, 40(5):851-864. [4] Brown, R., 1985. EM coupling in multi-frequency IP and a generalization of the Cole-Cole impedance model. Geophysical Prospecting 33, 282-302. [5] LUO Yan-zhong, Zhang Gui-qing. The principle of frequency domain IP (in Chinese). Beijing: Geological Press, 1988. [6] Yang Z W, Zheng W, Li X B, Wang H F. The development and prospect of the spectral induced polarization method [J].Geophysical and Geochemical Exploration, 2015,39(1):22-28. [7] HE Ji-shan. Dual Frequency Induced Polarization Method (in Chinese). Beijing: China Education Press, 2005.11. [8] XI X, YANG H, HE L F, CHEN R J. Chromite mapping using induced polarization method based on spread spectrum technology[C]. SAGEEP. 2013: 1-7.