Analysis of Cyberactivism: Simulating Bioterrorism Epidemiology A Case Study of Onlinethrough Free Tibet Activities Tianjun Fu and Hsinchun Approximation Chen, Artificial Intelligence Lab, University of Arizona activities and is an initial attempt toward a framework to Abstract —Cyberactivism refers to the use of the Internet to Ryan Layfield, Murat Kantarcioglu, and Bhavani Thuraisingham advocate vigorous or intentional actions to bring about social or analyze Cyberactivism. Two popular Internet media, web sites political change. Cyberactivism analysis aims to improve the and forums of Free Tibet activities, are identified, collected, understanding of cyber activists and their online communities. In and analyzed. We aim to shed light on the following research this paper, we present a case study of online Free Tibet activities. questions: For web site analysis, we use the inlink and outlink information of 1. What automated methods can be used to analyze fiveAbstract—Bioterrorism selected seed URLs to represents construct the of Free Tibet a network significant threat to number of infectious diseases at the lowest level possible [3]. Cyberactivism? web sites.The Thelack network shows the close relationships between our society. of successful attacks that have resulted in true People are represented individually in such a way that travel, five seed sites. Centrality measures reveal that tibet.org is 2. What knowledge and insights can we gain through epidemics have created a need for data that can be generated human contact, and even physical location are all considered. probably an information hub site inWe the have network. Further content social network and topical analysis of Cyberactivism? from existing known factors. taken the popular Episims is a product of research efforts at Los Alamos analysis tells us that common hub site words are most popular in Susceptible-Infected-Recovery model and created a hybridized National Laboratory [4] designed to model epidemics at a tibet.orgthat whereas dalailama.com focuses mostly on religious model balances the simplicity of the original with an II. FREE TIBET words. For forum analysis, descriptive such models as the similar level of detail, with a greater focus on the demographic approximation of what more complex statistics agent-based number of posts each month and the post distribution of forum Tibet generally the Tibet Region, already offer, with an emphasis on the exploration of large search a person belongs to,refers their to location, and Autonomous activities. Some of thisa users illustrate that the two large FreeTibetAndYou and spaces. Our experiments focus on forums more unconventional methods province-level entitydirectly governed the People's Republic of information is taken frombya small public survey aimed RFAnews-Tibbs experienced significant reduction in of intervention in have the event of an epidemic, the results of which China (PRC).information Religion is about extremely important todaily the Tibetans at gathering an individual’s routine, activitiesainmuch recentmore yearsbasic and that a smallcan percentage their users suggest approach be takenofbeyond the and Tibet is the traditional Tibetan Buddhism. while the transportation data is center derived of from TransSims. Users contribute the majority ofofposts. Important phrases of several thoroughly explored realm inoculation strategies. Panchen Lamas and Dalai Lamas are two well-known spiritual of the model include Eubank et. al., whose work suggests that long threads and active forum users are identified by using leaders of Tibetans. epidemics can be contained with simple vaccination policies mutual information and TF-IDF scores. Such topical analyses Index Terms— Bioterrorism, Epidemiology, SIR Model, Social help us understand the topics discussed in the forums and the Tibet was first convergent included into China’s territory in the 1300s. targeted at major components of the network [5]. Networks ideas and interest of those forum users. Finally, social network is not EachTibet level and of detail adds AtComplexity the beginning of without the 20thcost. century, Mongolia analyses of the forumI. users are conducted to reflect their INTRODUCTION both a need for more storage and computations resources on a signed a treaty proclaiming mutual recognition and their interactions and the social structure of their online communities. system. Episims requires high performance independence from the Republic of China. When computing the China resources run ain simulation a reasonable amount of Civil War to ended 1949, Tibetwithin became a part of the PRC. In time importantly, if a Tibetan model isresistance designed movement to address 1959,[6]. PRCMore armies thwarted the aandcertain of the realism, the Lama, appropriate Tenzinlevel Gyatso, 14th Dalai fled todata India.must be available to take advantage of it. For example, a model which The Central Tibetan Administration (CTA), also referred to considers a large population’s daily hygiene would be difficult as the Tibetan Government in Exile (TGE), is headed by the to justify cross surveyed data 14th Dalaiwithout Lama an andappropriate claims to be thesection rightfulofand legitimate of the region in question. government of Tibet. Free Tibet activities refer to activities far simpler approach for simulating epidemics is theTibet SIR thatAaim to support the independence of Tibet. Most Free model. This compartmental mathematical approach is based activities are guided by the CTA. on probabilistic transitions over the passage of time. It is considered one of most widely III. the RESEARCH DESIGN used models in epidemiology [7]. Free Tibet related web sites and forums are the focuses of Individuals are modeled by assigning them to one of three this case study. Such web sites and forums are created and states: susceptible, infected, and recovered. A susceptible maintained by activists, supporters, and sympathizers in a individual is considered one whom can be infected. They have variety of languages, Chinese, and no natural or artificialincluding immunityEnglish, to the contagion. An Tibetan. infected In this study, we propose different methodologies for analysis individual is considered stricken with a disease and contagious of each to thosemedium. that are susceptible. Eventually, an infected person will no longer be contagious by transitioning to ‘recovered’, A. Web Site Analysis either successfully overcomingImportant the disease acquiring 1) by Identifying and Collecting Weband Sites immunity or dying. The transitions are based on three factors: Since there are many Free Tibet web sites available, the first the probability of contact between susceptible and infected step is to identify which ones are important. Fig. 1 shows our groups, the rate of infection, and the rate of recovery. Any identification process. considerations of intervention or exception must be captured through these rates. Although popular, the SIR model falls short in several key areas. First, all participants are considered identical in terms of susceptibility. Someone whom interacts with a variety of
The threat of bioterrorism has remained on the forefront of disaster for countries such as Analysis, the United States in Index preparation Terms — Cyberactivism, Forum Free Tibet, Webwake Site Analysis the of the events of 2001 [1]. Unlike other threats such as direct physical attacks, a biological weapon can be effective far beyond the initial target; the very nature of a biological I. for INTRODUCTION agent makes it possible a relatively small attack to have far-reaching consequences on entire population. date, CTIVISM often refers to an vigorous or intentionalTo actions no known intentional attack has spread beyond the original that aim to bring about social or political change [1]. The initial development target. rapid of the Internet makes it an ideal source for However, the lack of full-scale incidents[2]of [3]. biological information and propaganda dissemination Cyber warfare in recent world history has created a difficult situation activists use web sites, forums, and other types of computer for those to prepare for the an public, epidemic. Several media to attempting build relationships with voice their isolated incidents involving potential weapons, such as the opinions, and spread their propaganda [4] [5]. Consequently, SARS outbreak which in Canada into howhasa Cyberactivism, refers[2], to provide activism glimpses on the Internet, situation might unfold. Rigorous study of diseases emerged as a new and important social phenomenon.and agents thatA could be used is and undeniably helpful, but thefor need for data comprehensive systematic framework analysis of remains. The only safe means by which this data can be Cyberactivism needs to be developed for researchers, analysts, provided is government through the use of epidemiological simulations. of and related agents to get a better understanding A variety of simulations have already been created to model cyber activists and their online communities. For example, it the spread of contagious disease and infection. BioWar is an has been observed that web sites of related activism groups are agent-based model based on a variety of factors that simulate a linked to each other through hyperlinks, creating their own community network [6]. A good research framework would include an effective method identify networks and the Manuscript received January 31, to 2008. Revisedsuch on March 28, 2008. R. Layfield with the Department Computer Science, University of roles of theisweb sites in the of networks. In forums, social Texas at Dallas, Richardson, TX 75080 USA (e-mail:
[email protected]). networks of forum users, topics and phrases, and M. Kantarcioglu is with therepresentative Department of Computer Science, University of Texas 75080 (e-mail: active usersat areDallas, usefulRichardson, informationTXthat can helpUSA understand
[email protected]). member interactions. B. Thuraisingham is with the Department of Computer Science, Uni This paper presents a case study TX of online Free (e-mail: Tibet University of Texas at Dallas, Richardson, 75080 USA
A
[email protected]).
ISI 2008, June 17-20, 2008, Taipei, Taiwan 1-4244-2415-3/08/$20.00 ©2008 IEEE
1 82
Authorized licensed use limited to: Univ of Texas at Dallas. Downloaded on April 19,2010 at 18:36:28 UTC from IEEE Xplore. Restrictions apply.
individuals on a daily basis is considered just as susceptible as someone whom does not interact at all. Second, the area being simulated is completely homogenous. There are no concepts in the model of locations, transportation, or variance in rates. Finally, the model requires a broad generalization of infection rates and the percentage of a population. Complex dynamic or dependent factors simply cannot be accounted for without collapsing them into a single dimension. This paper is divided into 6 sections. We discuss existing work on the enhancement of the SIR model in section 2. Section 3 is devoted to a detailed description of our own model. The simulation that we apply our model to is outlined in section 4, and our experiments are described in section 5. The paper ends with our conclusions in section 6.
household. Within this unit, the probable states of the individuals are tracked via a single vector of susceptibility, infection, and recovery. Given a population distribution of a region and basic statistical data, we can easily create a series of family units that represent the basic social components from a rural community to a major metropolitan area. A single home unit with no interaction is essentially a basic representation of the SIR model. Interaction occurs within what we call social network theaters. A theater is essentially any gathering area at which two or more members of a home unit meet. The probability of interaction depends on the type of location and the social interaction possible at it. To capture this, separate infection rates are assignable to each theater. In the event of a life-threatening scenario such as a bioterrorist attack, we assume a civil authority will act at some point to prevent a full-scale epidemic. We model such an entity by providing means in our models to affect social theaters and the probabilities associated with state transitions. For simplicity at this point, we will not consider resource constraints, nor will we model how an event is detected. The recognition of an attack will be simulated using a variable delay. After this delay has passed, the infection is officially recognized. Several known types of options are available deal with an epidemic [12-14]. The most basic form of prevention is by inoculating the population against it. Several options exist at this level, ranging from key personnel to entire cities. Anyone inoculated is automatically considered recovered. Second, a quarantine strategy can be used to isolate the infected population from the susceptible population. This requires the explicit removal of individuals from home units to appropriate facilities, and can be simulated on a fractional basis (representing probability of removal) with varying levels of accuracy. Third, the infection and recovery rates can be altered, through such means as allocating more resources to medical personnel and educating the general public on means to avoid infection. Finally, a potentially controversial but interesting option is the isolation of communities by temporarily eliminating social gathering areas. For example, public schools could be closed, or martial law could be declared. The motivating factor is finding ways to force the population at risk to remain at home. Such methods could reduce the number of vectors over which an infection could spread. A day is represented by multiple distinct time periods. We use a modified form of the SIR model to represent the various contributions by the involved members of home units, as seen in equation set 1. We have broken down the contributions by both those participating in a theater and those at home during each segment as α and β, respectively.
II.PRIOR WORK Several branches of research have already taken advantage of the foundations provided by the SIR model by altering it for a more realistic simulation. Moshe Kress of the Naval Operations Research Department [8] abstracted the equations and applied it to the spread of smallpox thru an urban population of 6 million. A host of states were introduced to reflect infectious conditions associated with the lifecycle of the disease. The social network was constructed across a population of several million, though the household size was fixed and the members of which could visit any gathering area with equal probability. The author asserts this is a basic generalization founded upon the small world property of most real-life networks. Satuma et. al. considers the more complex functionality attached to state transitions in both continuous and discrete forms of the model while retaining all of the SIR model’s most desirable qualities [9]. The work of Stattenspiel et. al. applies the original model to deal with mobility among geographical regions to describe a measles epidemic in Dominica [10]. III. OUR WORK Our own model is a hybridization of social interactions on a household scale, situation intervention, and the simplicity of the SIR approach. The system arose out of a need for a deterministic model that can balance a desire for accuracy in representing a potential scenario with computational resources and time. Recent work has suggested that more detailed models of social networks have a diminished role over the results in the spread of an epidemic [11]. We believe we can generalize complex interactions into a much more concise simulation without adversely affecting accuracy. The ultimate goal of our research is to integrate a model for biological warfare with a system that can evaluate multiple attacks with respect to passive and active defenses. As a result, we have created a simulation that serves as an approximation of the impact of a biological attack with speed in mind, allowing us to explore a large search space in a relatively shorter amount of time as compared to existing detailed models. The base component of the simulation is the home unit. A home can range in size from a single individual to a large
(1)
83 Authorized licensed use limited to: Univ of Texas at Dallas. Downloaded on April 19,2010 at 18:36:28 UTC from IEEE Xplore. Restrictions apply.
The current time is represented as t. Individually, each home unit as previously mentioned is actually a self-contained SIR model representation. However, since members of the home unit can participate in social theaters, the calculations required to update the model are influenced directly and indirectly by the rest of the units in the simulation. The first function, ai, determines how many susceptible individuals have become infectious in home unit i due to social theaters. Every one of the mi theaters which i participates in must be considered. For each theater k in the set, there are nk participants. The W function, given time t, home unit i, and work theater k of i, returns 1 if the home unit participates and 0 if it does not. This allows us to distinguish types of theaters across time. No participation means that the specified theater does not impact any result during t. Next, we must consider the individual infection rate for theater k, as specified by λk. We assume that the infection rate starts out at some level of ‘normal’, uninhibited probability. However, at some point in time, there exists the possibility that a civil authority will step in and decrease this factor by bolstering public awareness, providing necessary information to hospitals to enhance treatment, etc. We represent this by adding a new function Λ(t,λk) which can factor in both the custom rate and any modifiers we need, applying them at a predetermined time to represent detection and subsequent intervention. Now, we must consider the probability that we will have a susceptible individual interact with an infected individual. The size of each household is hj of the nk households present in the theater. We take the susceptible population Sj(t) of j, divide it by the total size of j, and sum the results. This is repeated for Ij(t). Note that the sum for both populations is an actual head count; hence the need to convert the total into a probability for each. We do this by dividing each summation result by nk, the size of theater k. The product the results is the probability a susceptible individual will encounter an infected individual at the site. The next step is to determine the part of the household being affected. This is obtained by taking the susceptible population of the home unit Si(t) and dividing it by the size of the home hi. Note that this does not entirely compartmentalize participants from each home unit and suggests that a single individual from the household is selected with equal probability to participate. We allow this to simplify the calculations necessary to avoid tracking each individual separately in a pure agent-based format. Finally, we consider whether or not social theater k is going to impact household i. We base this on three factors. The time of day determines which time segment the simulation is in and which theaters the home units are involved in. The household i determines which theater participation set is being referenced by k. The result of this function is 1 if the household will be involved, and 0 if it is not. The second calculation β i determines how many people, during the time segment at t, stayed home and participated in the home unit update model. Most of our calculations here are identical to those of the original SIR model. We calculate the
probability that a susceptible person at home will become infected by those already carrying the contagion. However, we also must calculate the portion of the individual updated by considering the fraction not present. We thus determine the number of people not present, divide it by the total number of people in the home unit, and invert the percentage by subtracting it from 1. We implement a constraint on the W function, requiring that a home unit can never participate in more theaters than there are members hi. This allows us to sum up this participation by type assigned to a given time period. The calculations for recovery of infected individuals are much simpler. Regardless of theaters that they participate in, individuals recover at a uniform rate as determined by Γ(t, γ) during the course of the simulation, in a similar fashion to Λ. We assume that it is possible for a civil authority to affect the base recovery rate γ. For example, a state can bolster the level of hospital care by bringing in doctors from other locations, providing emergency resources to the existing facilities. Other possibilities include direct emergency funding and simply making a medical examiner aware of what symptoms to look for. When no social theaters are considered in use, the simulation enters a ‘home’ period. During this portion of the day, the members of the home units only interact internally. The W function returns 0 for any work entry at this time. Essentially, each home unit is calculated as if it were an entirely self-contained SIR model. It is important to note the use of ‘fuzzy’ states in the home units. The three population states are considered probabilities of the household’s overall condition. For example, a susceptible size of 80% and an infection size of 20% mean that there is a 1 out of 5 chance that a member of the household is sick. Note that a small attack can potentially infect the same size of a population as a larger attack when no intervention is present; there may simply be a smaller chance that each member of the population is infected. Note that within a unit there is not necessarily a distinction in how many members are infected. IV. EXPERIMENTAL SETUP A. Population Generation For our experiments, we wanted to have a variety of home units with a predictable set of sizes based on household statistics. Starting with a population of 10,000 we divided them into groups ranging from a single individual to a family of size 6. The biggest set was the three person household. Exactly 5,165 total households were generated from this pool of individuals and used consistently throughout all of our experiments. B. Theater Generation The social theaters are generated by the population size that they will ultimately contain. The assignments themselves are divided based on power law averages, used to generate random sizes. To keep these assignments consistent, we use a
84 Authorized licensed use limited to: Univ of Texas at Dallas. Downloaded on April 19,2010 at 18:36:28 UTC from IEEE Xplore. Restrictions apply.
pre-determined seed in an isolated random number generator for each distribution session. For work theaters, we have a maximum population of 5,000 spread of theaters randomly generated by power law from size 1 to 152. Education and recreation theaters are allocated 2,000 people each, with maximum sizes of 900 and 25, respectively. These assignments give us 57 theaters for work, 144 theaters for recreation, and 3 theaters for education. We use this assignment throughout all of our experiments. Note that we can use specific assignments if needed for more accurate representations of populated theaters. We do not consider high-traffic transportation hubs such as airports; not all cities have them, and our simulated city is comprised of only 10,000 people. Adding in these locations in future work can be done by simply adding a large theater.
to the second eight-hour segment.
V.EXPERIMENTS We explored several factors in our models across a spectrum of infection and recovery rates to determine some of the most effective ways of dealing with outbreaks of infectious diseases. To consider this, we experimented with the shutting down of social network theaters with varying degrees of severity. In theory, if any given theater is no longer in play, we essentially remove its’ node and corresponding links from the social network. When this shutdown occurs is dependent on when the attack is either announced by the responsible party or the civil authorities are aware of the situation. Detection is outside of the scope of this research. To simplify this, we experiment with specific dates on which the shutdown occurs. In all of our experiments, we simulated a hypothetical contagion over the course of 40 days. We set our base infection rate λ to 60% and our recovery rate γ to 25%. Our goal is to represent a relatively aggressive infection that takes a minimum of several days to recover from. The initial infection is of a single person in the same household each time. We first wanted to establish the relevancy of our work to the existing body of research in the SIR model. To establish this, we compared the original model to our own and attempted to find correlation between them. We found that the characteristics of the infection rate were virtually identical with some adjustments to reflect the average infection rate across different theaters. For example, a traditional model with an infection rate of 72.5% and a recovery rate of 33% acted similarly to our own model under our default setup. However, the matches were not perfect. Although the total number of infections and the nature of the peak infection count were within 1% of each other, our own model did not
C. Time We divide the day into three 8-hour segments. The first segment represents participation in both the job market and education. Bioterrorist attacks would be most effective here due to a high transitory population. Those that have a job go to their workspace and interact with coworkers. The infection rate at a business is only 80% of the baseline, due to the formal interaction and greater possible isolation during the time period. However, other household members may instead attend an educational institution. Here, the levels vary based on age groups, but the general proximity of people to each other is far greater due to enclosed classroom environments. To represent this, the infection rate is 10% greater than the baseline. Next, in the second segment we have recreational pursuits. Fewer people are involved while interaction is less formal. We assert that such groups would typically be much smaller than those found during the previous segment. The resulting infection rate is estimated at 90% of the baseline. Finally, we end with a simulation of the household, representing a normal sleep cycle and estimated home visitation pattern. During this period we assume that the family is most susceptible to the spread of a contagion, due to both close physical proximity and deeper levels of interaction. The infected rate used during this period is the strict baseline rate established throughout the simulation. At any point, if a person is not participating in one of the theaters in the first two segments, they are assumed to be at home. Those remaining in the home unit are calculated the same way as during the first segment, although the effects are reduced based on the present number of people. This reflects parts of the population that either does not work and/or prefer to remain at home during the evening. When assigning parts of the population to social theaters we enforce a few rules of assignment. We limit membership to one theater per individual per segment. Multiple members of a household can participate in the same theater, and one individual can participate in multiple theaters on different segments. However, we do not model those that hold multiple jobs. We also do not model those with jobs at night or other parts of the day; jobs and educational participation is limited
6000
Control
Infection Count
5000
Close School & Work Day 3, 100% Compliance
4000
Close School & Work Day 3, 80% Compliance
3000
Close School & Work Day 3, 60% Compliance
2000
Close School & Work Day 3, 40% Compliance Close School & Work Day 3, 20% Compliance
1000
0 1
3
5
7
9
11 13 15 17 19 21 23 25 27 29 31 33 35 37 39
Day
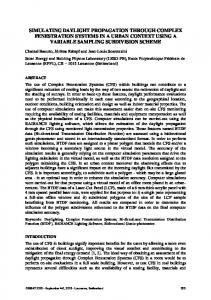
Fig. 1 Recovery totals over a 40-day period with variance in the percentage of cooperation.
reach the peak until a few days later. This difference was traced back to how our model requires a lead time for the infection to spread across the social network from the initial point of contact, versus the original model which stated the
85 Authorized licensed use limited to: Univ of Texas at Dallas. Downloaded on April 19,2010 at 18:36:28 UTC from IEEE Xplore. Restrictions apply.
Infection Count
infection could potentially reach anyone in the city on day one. The results showed the impact of the epidemic can be substantially reduced through the closing down of social theaters even with a significant delay. Analysis shows that shutting down any kind of social theater yielded a net loss to the total number of individuals infected over time. Shutting down all public education buildings reduced the tally by a minimum of 8% as late as the 7th day after the attack. When businesses were asked to close, the results showed a 19.5% reduction of infection totals under total cooperation. In reality, however, there is no guarantee of cooperation when shutting down social gathering areas of any kind beyond public institutions. We next experimented with requests to shut down of varying efficiency, ranging from one out of every five organizations complying with the request to complete cooperation. Our results suggest that the degree of compliance is directly proportional to the effectiveness of the request. For example, a request to close all educational and work theatres on the third day has a 60% compliance rate. In this scenario 4,640 are infected; without any intervention, the normal result would have been 5,367. This translates into a 13.5% improvement. However, at 100% compliance, only 3,769 people would become sick, a more efficient 29.8% reduction. Altercation of the recovery rates in our model unsurprisingly assisted in reducing the total number of infections. However, the effect was relegated below a particular threshold. When the recovery rate was increased by 10% and the infection rate reduced by the same amount, the modification reduced the number of infected individuals to 4,549, a 20% decrease for any time period between initial release and day 9. However, beyond that point, there is a dramatic increase in infection counts up to day 15, after which the total is identical to no intervention at all. This essentially translates into a two-week window for any altercations to existing rates. Looking at these rates individually in our experiments, it is clear that prohibiting the spread of infection will benefit more than enhancing recovery; however, in practical applications, doing both would be ideal.
Infection Count
0 7
9
Intervene Recovery +10%, Infection -10%
5
7
9
11
13
15
17
19
Intervene Recovery +10%, Infection -10% Close Work 80% Compliance Intervene Recovery +10%, Infection -10% Close School 80% Compliance Intervene Recovery +10%, Infection -10% Close Work & School 80% Compliance
For an overall analysis of the techniques we have considered, we ran a comprehensive battery of experiments across several days (see Fig. 2). If the epidemic can be detected early, the single most effective technique is closing work with 80% compliance in terms of the peak severity of the epidemic as well as a 15.1% reduction in the total number of infections. However, adjustment of the infection and recovery rates offered the greatest reduction in infections, reducing the total by 16.4%. Across a range of days on which these combinations of interventions occur, we find that the benefits are fairly consistent. However, as the delay between the introduction of the contagion and its’ detection increases, the differences among these options begins to shrink. Intervention on the third day can be up to a 48.6% (see Fig. 3) decrease in the number of infections when using all of the methods available. However, beyond day 13, we found that the overall benefits were only a marginal variance amongst all combinations of options. We analyzed a worse-case scenario epidemic with the same infection rate but a recovery rate of only 5%, representing a contagion that was much more difficult to treat. Under these conditions, even a combination of 80% compliance in the closing of both work and school theaters, a 10% boost to recovery rates, and a 10% reduction of infection rates, doing this as early as the 3rd day only reduced the total number of infections by 7.5%. When dealing with these scenarios, even aggressive policies on civil intervention would make very little difference in the outcome. In terms of performance, the time taken to run each experiment was tied closely to the number of social theatres involved. The code was written in Java and carried out on a 2.0 GHz dual-core machine with 2GB of RAM. Only one core is used by the application. For a population of 10,000 interacting across 220 social theatres, each day took approximately half a minute. Running non-stop for 24 hours, we can simulate roughly 2,800 days. Since we evaluated many of our experiments for 40 virtual days, this translates into approximately 72 simulations a real day. Population size by design has no impact on the performance.
Intervene Day 3 Recovery +10%, Infection -10% Close Work Day 3 80% Compliance Intervene Day 3 Recovery +10%, Infection -10% Close School Day 3 80% Compliance Intervene Day 3 Recovery +10%, Infection -10% Close Work & School Day 3 80% Compliance
5
3000
Fig 3. Several possible combinations of intervention methods were considered in terms of the total number of infections with regard to when the plans were implemented.
Intervene Day 3 Recovery +10%, Infection -10%
3
Close Work 80% Compliance
Day
Close Work Day 3, 80% Compliance
1
4000
3
Close School Day 3, 80% Compliance
200
Close School 80% Compliance
0
Control
400
5000
1000
1000
600
Control
2000
1200
800
6000
11 13 15 17 19 21 23 25 27 29 31 33 35 37 39
Day
Fig. 2. The infection peaks for various civil intervention methods.
86 Authorized licensed use limited to: Univ of Texas at Dallas. Downloaded on April 19,2010 at 18:36:28 UTC from IEEE Xplore. Restrictions apply.
[3]
VI. CONCLUSIONS Although these quarantine methods could be considered controversial under certain political ideologies, our results demonstrate that they are potentially highly effective. In a democratic country such as the United States, the protection of civil liberties has often been at odds with the need for greater security. However, regardless of public opinion, these options should not be eliminated. In fact, in instances where inoculation is not a viable option, quarantine efforts may be the only way to ensure that the epidemic does not spread any farther. However, as these studies also suggest, all of the methods will only be effective if used within a reasonable amount of time from the original infection. Once the infection has spread beyond a particular threshold, the effort taken to act may be wasted. We conclude then that there must be particular emphasis in the field of bioterrorism research to analyze and improve detection methods. Likewise, there must also be a rudimentary communication structure in place that brings any possibility of an epidemic to the attention of the appropriate civil authorities as quickly as possible.
[4]
[5]
[6] [7]
[8]
[9]
[10]
[11]
[12]
A. Future Work We have several improvements planned already on the model itself. One goal is to further refine the transitions between segments by allowing for a finer-grained consideration of time. We want to capture a larger spectrum of activities through social theaters to enhance accuracy and provide more possible levels of detail within the model, including probabilistic choice of activities. Another improvement planned is to arrange the home units themselves as social network theatres, allowing us to model individuals independently. This potentially would allow us to approach the accuracy of an agent-based model population without significantly increasing complexity or resource requirements. The biggest obstacle we face implementing these enhancements is the impact on performance. The ultimate goal of our work is to use this model in conjunction with a cost-benefit analysis model to optimize defensive strategies. There are several possible attack vectors in a given location. Our data suggests optimal attacks will differ based on strategies to mitigate the effects of a bioterrorist attack already in place. Thus, we believe that a model which provides a cost-effective use of computational resources to search a large space of possibilities will allow us to better understand a means of ensuring that any attack does not succeed.
[13]
[14]
K. Carley, D. Fridsma, E. Casman, A. Yahja, N. Altman, L. Chen, B. Kaminsky, and D. Nave, “BioWar: scalable agent-based model of bioattacks,” in Transactions on Systems, Man and Cybernetics, Part A, 2nd issue, vol. 6. S. Eubank, H. Guclu, V. Kumar, M. Marathe, A. Srinivasan, Z. Toroczkai, and N. Wang. “Modeling disease outbreaks in realistic urban social networks,” Nature, Vol. 429, pp. 180-184, May 2004. Eubank, Stephen. “Network Based Models of Infectious Disease Spread,” Japan Journal of Infectious Diseases, No. 6, Vol. 58, pp. 9-13, 2005. J. Bonnett. “High Performance Computing: An Agenda for the Social Sciences and the Humanities in Canada,” unpublished. S. Moghadas, "Gaining insights into human viral diseases through mathematics," European Journal of Epidimiology, Vol. 21, pp. 337-342, 2006. M. Kress. “The Effect of Social Mixing Controls on the Spread of Smallpox—A Two-Level Model,” Health Care Management Science, Vol. 8, pp. 277-289, 2005. J. Satuma, R. Willox, A. Ramani, B. Grammaticos, and A. Carstea, “Extending the SIR epidemic model,” Physica A, vol. 336, pp. 369-375, 2004. L. Stattenspiel, and K. Dietz, “A Structured Epidemic Model Incorporating Geographic Mobility Among Regions,” Mathmatical Biosciences, Vol. 128, pp. 71-91, 1995. H. Fuk´s, A. Lawniczak, and R. Duchesne, “Effects of population mixing on the spread of SIR epidemics,” European Physical Journal B, vol. 50, pp.209-214, 2006. L. Stattenspiel, and D. Herring, “Simulating the Effect of Quarantine on the Spread of the 1918-19 Flu in Central Canada,” Bulletin of Mathmatical Biology, Vol. 65, pp. 1-26. B. Shulgin, L. Stone, and Z. Agur, “Pulse Vaccination Strategy in the SIR Epidemic Model,” Bulletins of Mathmatical Biology, vol. 60, pp.1123-1148, 1998. W. Floyd, L. Kay, and M. Shapiro, “Some Elementary Properties of Social Networks,” Bulletins of Mathmatical Biology, Accepted 19 Sepetmeber 2007.
REFERENCES [1]
[2]
B. Shadel,, T. Rebmann, B. Clements, J. Checn, and R. Evans, “Infection control practitioners’ perceptions and educational needs regarding bioterrorism: Results from a national needs assessment survey,” in American Journal of Infection Control, vol. 31, pp. 129-134, 2003. (2003, June). Clinical Features and Short-term Outcomes of 144 Patients With SARS in the Greater Toronto Area. Journal of the American Medical Association. [Online Journal]. Vol. 289 No. 21. Available: http://jama.ama-assn.org/cgi/content/abstract/289/21/2801
87 Authorized licensed use limited to: Univ of Texas at Dallas. Downloaded on April 19,2010 at 18:36:28 UTC from IEEE Xplore. Restrictions apply.