Simulating Knowledge-Generation and -Distribution Processes in Innovation Collaborations and Networks Andreas Pyka, Nigel Gilbert, Petra Ahrweiler Beitrag Nr. 287, August 2006
Simulating Knowledge-Generation and -Distribution Processes in Innovation Collaborations and Networks
Andreas Pyka ∗ University of Augsburg, Institute of Economics, Universitätsstr. 16, D-86135 Augsburg, Germany Nigel Gilbert School of Human Sciences, University of Surrey, Guildford, Surrey, GU2 7XH, United Kingdom Petra Ahrweiler Research Center Media and Politics, Institute for Political Science, University of Hamburg, Germany
Key words: innovation networks, agent-based modelling, scale free networks JEL: 031, 032, L22 Abstract An agent-based simulation model representing a theory of the dynamic processes involved in innovation in modern knowledge-based industries is described. The agent-based approach allows the representation of heterogeneous agents that have individual and varying stocks of knowledge. The simulation is able to model uncertainty, historical change, effect of failure on the agent population, and agent learning from experience, from individual research and from partners and collaborators. The aim of the simulation exercises is to show that the artificial innovation networks show certain characteristics they share with innovation networks in knowledge intensive industries and which are difficult to be integrated in traditional models of industrial economics. 1. Introduction Today’s knowledge-based markets are more than places where goods are bought and sold: they are the arenas where innovation takes place, where knowledge is generated, communicated, re-combined and exchanged. In such competitive environments, in which there are quickly changing global technological and economic requirements (Bahlmann 1990) and a variety of institutional infrastructures (Amable 2003), a firm can improve its performance only by exploiting resources more creatively and intelligently than its competitors (Lam 2003). To keep a competitive advantage, firms have therefore to engage in permanent learning. Organisationally cooperative research in so-called innovation networks has become a prominent alternative which allows access to external knowledge sources. In innovation networks, which are the outcome of various horizontally and vertically bilateral collaborations, the actors of the innovation process share and co-develop new knowledge with other actors (Pyka, 2002). ∗
Corresponding author:
[email protected]
1
Networks are a principal mode of co-ordination which is particularly relevant in knowledgebased market sectors such as e.g. biotechnology and the ICT industries. The need for knowledge creation and transfer within industries is one of the main reasons for networking. Powell (1990: 304) suggests that it is impossible to put a price tag on qualitative features such as an innovation-friendly strategy, a special style of production, technological capacity, knowhow or a zero-failure philosophy, none of which can be traded on the market. Combining knowledge resources in networks enables innovation and learning that are difficult to provide by other means (Summerton 1999). Thus, markets are more than places where goods are bought and sold within an institutional context: they are the arenas where innovation takes place, where knowledge is generated, communicated, re-combined and exchanged. In the theory of industrial organisation (IO) in the first place, collaborative R&D was considered to be a temporary phenomenon only. Additionally, on the basis of well established anti-trust principles, collaborative agreements generally were supposed to be suspicious. For example, in transaction costs theory, innovation networks were taken as a hybrid form of industrial organisation, between hierarchy and markets, which finally will disappear. Exemplarily the developments in the biotechnology-based industries were cited, where since the late 1980’s well established pharmaceutical firms were engaged frequently in cooperative research with specialised biotech start-up companies (e.g. Pyka and Saviotti, 2005). These cooperations were supposed to allow access to the biotechnology paradigm for the pharmaceutical firms which were specialised so far in organic chemistry. The cooperations, furthermore, were supposed to disappear soon again: Either the large pharmaceutical firms will build up their own competences in biotechnologies (which include the acquisition of biotech start-ups), and therefore no longer need collaboration partners, or the biotech start-ups will displace the large pharmaceutical firms and become the dominant actors in the pharmaceutical industries themselves. Neither of these two extreme alternatives took place. In the early years of the 21st century both populations of actors, the pharmaceutical firms and the small biotech firms, still co-exist and also innovation networks still shape the industrial organisation of R&D processes in this industry. This degree of lack of interest in R&D collaborations prevailing in the theory of IO until the end of the 1980s can be traced back to the negative view on technological spillovers characteristic for neo-classical industrial economics. Technological spillovers, i.e. the involuntary and uncontrollable knowledge flow due to the supposed public good nature of new technological knowledge, were basically considered to reduce R&D incentive (e.g. Levin and Reiss, 1988) and therefore detrimental for economic welfare. Not before the end of the 1980s this view changed and R&D collaborations slowly moved into the centre of interest. In 1988, D’Aspremont und Jacquemin showed that cooperation in R&D leads to higher R&D intensity in an industry in the case of a high degree of technological spillovers. Cohen and Levinthal (1989) introduced the concept of absorptive capacity, which firms need in order to benefit from technological spillovers. Accordingly, technological spillovers are very likely to also support industrial innovation processes. However, due to their static character these equilibrium-oriented models of neoclassical oriented IO are unable to consider learning processes. The emphasis on industrial learning processes first became central in a new strand of literature, namely industrial dynamics (ID) in a Neo-Schumpeterian tradition (Hanusch and Pyka, 2006). In ID, besides the incentive reducing effects of spillovers, their knowledge creating effects are heavily emphasised (see e.g. Cantner and Pyka, 1999; Eliasson, 1995); and exactly these knowledge creating effects have to be considered as the basic motive for industrial actors to engage themselves in collaborative R&D. To analyse the impact of these mutual knowledge flows in industrial learning processes, the traditional modelling framework with its strong assumptions is not applicable. Instead to capture the dynamics going on in industrial learning processes fed by 2
heterogeneous actors, in ID numerical simulations are adopted (see e.g. Windrum, 2006). Within the last few years in particular the methodology of agent-based modelling is frequently applied (Gilbert and Troitsch, 1999; Tesfatsion, 2001). The aim of this paper is to introduce to an agent-based simulation model (SKIN – Simulating Knowledge Dynamics in Innovation Networks; for a detailed introduction see Ahrwiler, Pyka and Gilbert 2004) which allows studying innovation networks and their developments. The agents are designed in a way which reflects the knowledge-based view of ID, i.e. they are characterized by imperfect knowledge which they try to improve; they act in strong uncertain environments which also is continuously affected and modified by their actions. The basic structure of the model is introduced in section 2 of this paper. In section 3 various simulation experiments are shown in order to demonstrate the model’s performance. In particular it is shown that innovation networks can be a persistent organizational form of industrial R&D (section 3.1) and not only of transitory nature as claimed in traditional IO theory. The phenomenon of innovation networks is closely related to the emergence of the so-called knowledge-based economies since the 1980s. The innovation networks in reality show certain characteristics in their architecture and dynamics which are knowledge-driven (e.g. Powell et al., 2005) and which do also appear in our artificial innovation networks. In section 3.2 we analyse these features, in particular the scale-free attributes of innovation networks. Some conclusions close the paper. 2. The Model SKIN is a multi-agent model containing heterogeneous agents which act and interact in a complex and changing environment. The agents represent innovative firms who try to sell their innovations to other agents and end users but who also have to buy raw materials or more sophisticated inputs from other agents (or material suppliers) in order to produce their outputs. This basic model of a market is extended with a representation of the knowledge dynamics in and between the firms. Each firm tries to improve its innovation performance and its sales by improving its knowledge base through adaptation to user needs, incremental or radical learning, and co-operation and networking with other agents. The elements and processes of the model will now be described in more detail. The core concept of the framework is the knowledge which will manifest itself in the innovative production or delivery of manufactured and service products. The approach to knowledge representation used in the model is similar to Toulmin’s (1967) evolutionary model of knowledge production. This identified concepts, beliefs and interpretations as the "genes" of scientific/technological development evolving over time in processes of selection, variation and retention. Ackermann (1970) interpreted the works of Kuhn and Popper according to this perspective allowing for different selection systems. In the SKIN model the concept, a “kene” is used, to represent the aggregate knowledge of an organization (Gilbert 1997). 2.1.
The agents
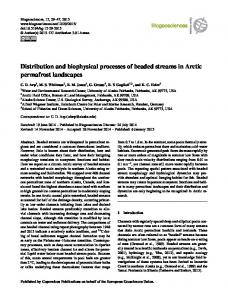
The individual knowledge base of a SKIN agent, its kene, contains a number of “units of knowledge”. Each unit is represented as a triple consisting of a firm’s capability C in a scientific, technological or business domain (e.g. biochemistry), represented by an integer, its ability A to perform a certain application in this field (e.g. a synthesis procedure or filtering 3
technique in the field of biochemistry), represented by a real number, and the expertise level E the firm has achieved with respect to this ability (represented by an integer). The firm's kene is its collection of C/A/E-triples. Figure 1 The kene of a firm
{
C A E
}, {
C A E
}, {
C A E
}, {
C A E
}, {
C A E
},...
When it is set up, each firm has also a stock of initial capital. It needs this capital to produce for the market and to improve its knowledge base, and it can increase its capital by selling products. The amount of capital owned by a firm is a measure of its size and also influences the amount of knowledge that it can support, represented by the number of triples in its kene. Most firms are initially given a starting capital allocation, but in order to model differences in firm size, a few randomly chosen firms can be given extra capital. In many knowledgeintensive industries we find a co-existence between large and small actors (e.g. the large pharmaceutical firms and the biotech start-ups, or the former national monopolists and high technology specialists in the ICT-industries). This particular distribution of firm sizes makes it necessary to discriminate between large and small actors in the simulation set-up. 2.2.
The market
Firms apply their knowledge to create innovative products that have a chance of being successful in the market. The special focus of a firm, its potential innovation, is called an innovation hypothesis. In the model, the innovation hypothesis (IH) is derived from a subset of the firm’s kene triples. Figure 2 Forming an innovation hypothesis
{
C A E
0
}, {
C A E
1
}, {
C A E
}, {
2
C A E
3
}, {
C A E
},...
4
IH = (1, 3, 4) The underlying idea for an innovation, modelled by the innovation hypothesis, is the source an agent uses for its attempts to make profits on the market. Developing the innovation hypothesis into a product is a mapping procedure where the capabilities of the innovation hypothesis are used to compute an index number that represents the product. 4
A firm’s product, P, is generated from its innovation hypothesis as (1)
P = ∑ Ci
mod N
IH
(where N is a constant). The product has a certain quality which is also computed from the innovation hypothesis in a similar way, by multiplying the abilities and the expertise levels for each triple in the innovation hypothesis and normalising the result. In order to realise the product, the agent needs some materials. These can either come from outside the sector (“raw materials”) or from other firms, which generated them as their products. What exactly an agent needs is also determined by the underlying innovation hypothesis: the kind of material required for an input is obtained by selecting subsets from the innovation hypotheses and applying the standard mapping function (see equation 1 above). These inputs are chosen so that each is different and differs from the firm’s own product. In order to be able to engage in production, all the inputs need to be obtainable on the market, i.e. provided by other agents or available as raw materials. If the inputs are not available, the agent is not able to produce and has to give up this attempt to innovate. If there is more than one supplier for a certain input, the agent will choose the one at the cheapest price and, if there are several similar offers, the one with the highest quality. Figure 3 A firm’s input requirements
IH =
{
C A E
}{
C A E
}, {
C A E
}{
C A E
}{
C A E
},...
Input 1: (A1 + A2) modulus N Input 2: (A3 + A4 + A5) modulus N If the agent can go into production, it has to find a price for its own product which takes account of the input prices it is paying and a possible profit margin. While the simulation starts with product prices set at random, as the simulation proceeds, a price adjustment mechanism increases the selling price if there is much demand, and reduces it (but no further than the total cost of production) if there are no customers. A range of products are considered to be ‘end-user’ products and are sold to customers outside the sector: there is always a demand for such end-user products provided that they are offered at or below a fixed end-user price. An agent will then buy the requested inputs from its suppliers using its capital to do so, produces its output and puts it on the market for others to purchase. Using the price adjustment mechanism, agents are able to adapt their prices to demand and in doing so learn by feedback. In making a product, an agent applies the knowledge in its innovation hypothesis and this increases its expertise in this area. This is the way that learning by doing/using is modelled. The expertise levels of the triples in the innovation hypothesis are increased by 1 and the expertise levels of the other triples are decremented by 1. Unused triples in the kene eventually drop to an expertise level of 0 and are deleted from the kene; the corresponding abilities are “forgotten” or “dismissed” (cf. e.g. Hedberg 1981).
5
2.3.
Learning and co-operation: improving innovation performance
In trying to be successful on the market, the firms are dependent on their innovation hypothesis and thus on their kene. If a product does not meet any demand, the firm has to adapt its knowledge in order to produce something else for which there are customers (cf. e.g. Duncan 1974). In the model, a firm has several ways of improving its performance, either alone or in co-operation, and in either an incremental or a more radical fashion. All strategies have in common that they are costly: the firm has to pay a “tax” as the cost of applying an improvement strategy. 2.3.1. Incremental research If a firm’s previous innovation has been successful, i.e. it has found buyers, the firm will continue selling the same product in the next round. However, if there were no sales, it considers that it is time for change (evaluating feedback). If the firm still has enough capital, it will carry out “incremental” research (R&D in the firm’s labs). Performing incremental research (cf. Cohen and Levinthal 1989) means that a firm tries to improve its product by altering one of the abilities chosen from the triples in its innovation hypothesis, while sticking to its focal capabilities. The ability in each triple is considered to be a point in the respective capability’s action space. To move in the action space means to go up or down by an increment, thus allowing for two possible “research directions”. Initially, the research direction of a firm is set at random. Later it learns to adjust to success or failure: if a move in the action space has been successful the firm will continue with the same research direction within the same triple; if it has been a failure, the firm will randomly select a different triple from the innovation hypothesis and try again with a random research direction. Figure 4 Incremental research
chosen triple for incremental research
{
C 5 E
}
{ research direction “down”
C 6 E
}
{
C 7 E
}
research direction “up”
6
2.3.2. Radical research A firm under serious pressure that is in danger of becoming bankrupt will turn to more radical measures, by exploring a completely different area of market opportunities. In the model, an agent under financial pressure turns to a new innovation hypothesis after first “inventing” a new capability for its kene. This is done by randomly replacing a capability in the kene with a new one and then generating a new innovation hypothesis. 2.3.3. Partnerships An agent in the model may consider partnerships (alliances, joint ventures etc.) in order to exploit external knowledge sources. The decision whether and with whom to co-operate is based on mutual observations of the firms, which estimate the chances and requirements coming from competitors, possible and past partners, and clients. The information a firm can gather about other agents is provided by a marketing feature: to advertise its product, a firm publishes the capabilities used in its innovation hypothesis. (Capabilities not included in its innovation hypothesis and thus in its product, are not visible externally and cannot be used to select the firm as a partner.) The firm’s advertisement is then the basis for decisions by other firms to form or reject co-operative arrangements. In experimenting with the model, we can choose between two different partner search strategies, both of which compare the firm’s own capabilities as used in its innovation hypothesis and the possible partner’s capabilities as seen in its advertisement. Applying the conservative strategy, a firm will be attracted by a possible partner who has similar capabilities; using a progressive strategy the attraction is based on the difference between the capability sets. Previously good experience with former contacts generally augurs well for renewing a partnership. This is mirrored in the model: to find a partner, the firm will look at previous partners first, then at its suppliers, customers and finally at all others. If there is a firm sufficiently attractive according to the chosen search strategy (i.e. with attractiveness above the ‘attractiveness threshold’), it will stop its search and offer a partnership. If the possible partner wishes to return the partnership offer, the partnership is set up. The model assumes that partners learn only about the knowledge being actively used by the other agent. Thus, to learn from a partner, a firm will add the triples of the partner’s innovation hypothesis to its own. For capabilities that are new to it, the expertise levels of the triples taken from the partner are reduced by 1 in order to mirror the difficulty of integrating external knowledge (cf. Cohen and Levinthal 1989). For partner’s capabilities that are already known to it, if the partner has a higher expertise level, the firm will drop its own triple in favour of the partner’s one; if the expertise level of a similar triple is lower, the firm will stick to its own version. Once the knowledge transfer has been completed, each firm continues to produce its own product, possibly with greater expertise as a result of acquiring skills from its partner.
7
2.3.4. Networks If the firm’s last innovation was successful, i.e. the amount of its profit in the previous round was above a threshold, and the firm has some partners at hand, it can initiate the formation of a network. This can increase its profits because the network will try to create innovations as an autonomous agent in addition to those created by its members and will distribute any rewards to its members who, in the meantime, can continue with their own attempts, thus providing a double chance for profits. Networks are “normal” agents, i.e. they get the same amount of initial capital as other firms and can engage in all the activities available to other firms. The kene of a network is the union of the triples from the innovation hypotheses of all its participants. If a network is successful it will distribute any earnings above the amount of the initial capital to its members; if it fails and becomes bankrupt, it will be dissolved. 2.4.
Start-ups
If a sector is successful, new firms will be attracted into it. This is modelled by adding a new firm to the population when any existing firm makes a substantial profit. The new firm is a clone of the successful firm, but with its kene triples restricted to those in the successful firm’s advertisement, and an expertise level of 1. This models a new firm copying the characteristics of those seen to be successful in the market. As with all firms, the kene may also be restricted because the initial capital of a start-up is limited and may not be sufficient to support the copying of the whole of the successful firm’s innovation hypothesis. 3.
The Emergence of Innovation Networks in an Artificial World
The following sections introduce to the developments in our artificial world and to show the wide possibilities to analyze network evolution there. We first show developments for a scenario which we label standard scenario and then focus on some experiments, modifying parameters and settings. For the standard scenario the parameters of the starting distribution can be found in the appendix of this paper. The actors in the standard scenario apply the socalled conservative strategy, i.e. were looking for actors with similar knowledge bases and the attractiveness threshold, i.e. the threshold which has to be surpassed in order to create a new partnership is set to a low value of 0.3. In the following section 3.2 different scenarios, modifying the cooperation strategy, the number of large actors in the initial distribution as well as the attractiveness threshold are analyzed. The purpose of this analysis is to have a closer look on the determinants of network evolution, their structures as well as their impact on the performance of the artificial industry. 3.1
Innovation Networks as a persistent form of the Industrial Organization of R&D
The first aim of our modelling analysis is to show that innovation networks are a viable form of organization of industrial R&D. For this purpose we compile a scenario, labelled standard scenario, which should correspond closely to the conditions characteristic for knowledge intensive industries where the phenomenon of innovation networks frequently appear in 8
reality. The firm actors in our artificial world are engaged in innovation processes in order to survive in an environment where besides price competition the competition for innovation plays a crucial role. Among the 500 actors in the initial distribution of the standard scenario we find 50 large actors. The consideration of large actors and this particular relationship should reflect the situation characteristic for knowledge intensive industries where a few very large companies co-exist with quite a large number of small dedicated technology firms. Figure 5a displays the development of the number of actors. Due to the alignment in the first iterations - products demanded by customers have to be developed as well as adequate input factors for production have to be purchased - a large share of small firm actors do not survive this period due to their only small endowment with capital. With successful market transactions appearing after around 300 iterations, however, life becomes easier for small actors and entry processes following the successful introduction of novelties are responsible for an again increasing number of actors. This situation repeats a couple of times during the simulation leading to a cyclical development which follows the discovery of profitable regions in the innovation space, the exploitation of these possibilities and the subsequent exploration of new regions in the innovation space. These new regions are opened up by new combinations of the actors’ kenes. A look on figure 5b shows, that this development is accompanied by a continuous evolution of networks measured by their number. During the shake-out periods, where the rate of successful innovations due to depleted opportunities decrease and with it the entry processes of start-ups slow down also some networks disappear temporarily. With the upswing in innovation and the related entries consequently also the number of networks increases again. The cyclical development of cooperation activities therefore corresponds closely to the discovery of new major technologies (i.e. profitable region in the innovation space) leading to pronounced networking activities. 1 Figure 5a Number of Actors
Figure 5b Number of Networks number of innovation netw orks
number of actors 300
1600 1400
250
1200 200
1000
150
800 600
100
400 50
200 0
0
0
500
1000
1500
2000
2500
0
500
1000
1500
2000
2500
Although the steadily increasing number of innovation networks gives a first hint on the persistence of this form of industrial organisation of R&D, only a closer look on the cooperative connections and the composition of networks allows for the conclusion that innovation networks are a viable form of R&D organization leading to prolific industry development. 1
E.g. Saviotti and Nesta (2006) show that the cyclical nature in innovation networks in the biotechnology-based industry correspond to major technological waves (from RDNA, monoclonal antibodies, genetics to protein design and so on). Each technological shock introduces a new wave of cooperative activities in these industries.
9
In figure 6 the frequency of the distribution of network sizes is illustrated. Rather obviously the majority of innovation networks encompass only a few actors and quite often consist of long run bilateral cooperation. However, also a few innovation networks exist which include six and more actors. These large networks play a crucial role for knowledge flows in our artificial industry. This is underlined in figure 7 where the development of connectivity is displayed. Connectivity is a measure in graph theory which relates the number of actual connections to the number of potential possible connections in a network. It is usually applied as a rough indicator for the spread of information diffusion in networks. The considerable high values of connectivity over the whole time horizon of the simulation illustrates multichanneled knowledge flows. This indicates a high degree of knowledge diffusion which has to be considered one of the major functions of innovation networks. Figure 6 Distribution of Network Sizes frequeny 100
distribution of netw ork sizes
80 60 40 20 0 0
2
4
6
8
10 12 14 16 number of actors in the netw ork
Figure 7 Development of Connectivity conncetivity 50 40 30 20 10 0 0
500
1000
1500
2000
2500
Following the results of our standard scenario simulations we can show the persistent nature of innovation networks in knowledge based industries. In the following section we test different settings and their impact on the evolution of the innovation networks in order to develop a better intuition for the prerequisites and consequences of cooperative R&D in networks as well as of the networks’ structural composition. 3.2
Scenario Analysis of Network Architectures
After having shown that innovation networks are a persistent organizational form of industrial R&D, we will now have a closer look on the characteristics of networks and the various features of their structures. Empirically, innovation networks in knowledge intensive industries show features of so-called scale-free networks (Barabasi and Albert, 1999). E.g. among others, Powell et al. (2005) have discovered scale-free attributes in biotechnology innovation networks. The growth of these innovation networks seems to follow certain 10
advantageous conditions concerning the stability and effectiveness of networks which leads to an unequal distribution of network connections. In these networks are characterized as central actors because of their high number of collaborative relationships relative to other actors with only a few cooperative relations, In our artificial world the question arises whether these attributes of real networks can be reproduced and which conditions are responsible for finding these particular network architectures. For this purpose we run several experiments modifying parameters from the standard scenario and look at their impact on network evolution. The parameters modified are the initial distribution of firm sizes, the cooperation strategy as well as the attractiveness threshold. (i)
Modifying the initial distribution of firm sizes, i.e. whether we start with an equal distribution of similar (small) actors, or whether we include a number of considerably larger actors (big firms) in the initial distribution, can be considered as an experiment which allows the analysis of the impact large actors have on the network development. This is of particular importance in knowledge intensive industries where in reality usually large actors e.g. large pharmaceutical companies or the former national monopolists in telecommunication co-exist with small technology dedicated firms.
(ii)
Modifying the cooperation strategy should give a hint on the rationale actors apply in the real world concerning the selection of cooperation partners. Obviously, the intention is to acquire knowledge which is not existent in the own firm and only difficult to create alone. However, the degree of novelty of the external knowledge and its integration can vary from cases where firms try to reduce the difficulties of mutual knowledge exchange by looking for cooperation partners with rather similar knowledge (conservative strategy) to cases where firms try to maximise the amount of new knowledge transferred from cooperation partners (progressive strategy), hazarding the consequences of the difficulties the integration of external knowledge might cause.
(iii)
Finally, the modification of the attractiveness threshold allows analysing the general attitude of cooperation, i.e. whether the actors rather quickly decide to cooperate or not.
The different combinations of these modifications are summarized in table 1 which describes the settings of the scenarios. Table 1 Scenario settings
number of big firms cooperation strategy attractiveness threshold
standard
I
II
III
IV
V
VI
VII
50
50
50
50
0
0
0
0
conservative
progressive
conservative
progressive
conservative
progressive
conservative
progressive
0.3
0.3
0.7
0.7
0.3
0.3
0.7
0.7
Figures 8 and 9 illustrate the development of actors in the different scenarios separated according to the cooperation strategy applied.
11
Figure 8 Development of the actors population in scenarios where the conservative strategy is applied Population (conservative Strategy)
1000 900 800 700 600 500 400 300 200 100 0 0
200
400
600 standard
800
1000
1200
II
IV
VI
1400
Figure 9 Development of the actors population in scenarios where the progressive strategy is applied Population (progressive Strategy) 1000 900 800 700 600 500 400 300 200 100 0 0
200
400
600 I
800 III
1000 V
1200
1400
VII
The scenarios with the conservative cooperation strategy are more successful with respect to the entry processes, and as entry is correlated to innovation, the actors applying the conservative strategy are also more often introducing sucessful innovations compared to similar settings when only the alternative progressive strategy is applied. Table 2 shows the linear growth trends 2 of the different scenarios. Only in the case of scenario II with the high value of the attractiveness threshold the value is (somewhat) lower compared to the corresponding scenario III with the progressive strategy. Table 2 Linear trends in the growth of actors
trend of growth in the number of firms
2
standard
I
II
III
IV
V
VI
VII
0.241
0.001
-0.03
-0.021
0.167
0.153
0.371
0.063
The linear growth trends are measured as the slope of a linear regression line.
12
The lower attractiveness threshold generally is combined with more pronounced shake-outs or higher degrees of volatility of development. In these cases actors are less selective about their selection of their cooperation partners accepting thereby the potential higher risk of failures and connected market exits. The diverse development in the number of actors obviously must have an impact on the development of concentration (market shares) in the industry. Market concentration is measured by the Herfindal-index 3 , which is exemplarily displayed for the standard scenario and scenario IV in figure 10. Figure 10 Development of concentration Herfindal - Index 3.5 3 2.5 2 1.5 1 0.5 0 0
200
400
600
800
standard
1000
1200
1400
IV
In contrast to the standard scenario, in scenario IV no large actors are in the initial distribution of firm sizes. Accordingly, we start with lower concentration values. However, the considerable shake-out of unsuccessful actors in the early periods leads to a considerable increase in concentration. The few actors remaining in the market are characterized by an extraordinary relative growth in market shares which leads to higher degrees of concentration over the whole simulated development. From this one can conclude a certain stability improvement introduced into the system by having an unequal initial distribution of firm sizes. Figure 11a Comparison of Profits (standard and IV) profit development 1800 1600 1400 1200 1000 800 600 400 200 0 0
200
400
600
800
standard
3
1000
1200
1400
IV
The Herfindal index H is computed according to the following formula: H ≡
market shares of the j actors, j ∈ {0,..., n} .
n
∑s j =1
2 j
where sj stands for the
13
Figure 11b Comparison of Profits (II and III) profit development 2000 1800 1600 1400 1200 1000 800 600 400 200 0 0
200
400
600
800
II
1000
1200
1400
III
Figures 11a and b compare the development of the profit situation for different scenarios. The impact of the pronounced shake-out in scenario IV without large actors in the initial distribution of firm sizes, which has caused the higher degree of concentration, is also reflected in the profit development. Compared to the standard scenario the recovery period takes longer and during the further simulation the profit situation is almost always below to the one of the standard scenario. Similar recovery problems characterize the profit situation of scenario III (progressive strategy) relative to scenario II (conservative strategy) both with the higher attractiveness threshold (0.7). As in both cases we have large actors in the initial distribution of firm sizes, the concentration effect cannot offer an explanation. There seems to an additional effect working, stemming from the innovation networks. Figures 12 a and 12b, which show the distribution of network sizes in the last iteration (1500), together with figure 13 illustrate a further commonality of the standard scenario and scenario II compared to the scenarios III and IV. Figure 12a
Distribution of Network Sizes (conservative vs. progressive strategy, low attractivity threshold) distribution of netw ork sizes
100
10
1 1
10
100
standard
1000
I
14
Figure 12b
Distribution of Network Sizes (conservative vs. progressive strategy, high attractivity threshold) distribution of netw ork sizes
100
10
1 1
10
II
100
III
Our SKIN model also allows observing the structure of the emerging networks. Figures 12a and b show the distribution of network sizes after 1500 iterations on a log-log-scale. Besides a large number of networks encompassing only a small number of actors (up to 6) also larger networks with up to 10 members and even more can be observed. This observation indicates that even if networking behaviour seems to be a widely shared strategic alternative, the actors in the various scenarios are engaged in networking to very different degrees. The particular shape also corresponds closely to the distribution of network links one might expect in socalled scale-free networks. In order to test this feature, table 3 displays the coefficient of a power-law distribution for the eight scenarios under investigation. Table 3 The coefficients of power law distributions of the networks after 1500 iterations
coefficient of power law distribution
standard
I
II
III
IV
V
VI
VII
1.535294 (0.822)
0.670403 (0.582)
1.603684 (0.894)
0.543593 (0.603)
1.637590 (0.874)
1.434596 (0.697)
2.348545 (0.868)
1.40074 (0.521)
(R2)
The figures in the table show that scale free attributes of the underlying network emerge in the standard scenario as well as in scenario II (also the regression coefficient is close to one). In the cases of scenarios I and III the coefficients are not large enough and the regressions are not significant to claim scale-free attributes for networks emerging also in these scenarios. In scenarios VI and VI we also find coefficients sufficiently large (and regression coefficients sufficiently close to one) to state scale free attributes to emerge. In scenarios V and VII the coefficients of the power law distribution are also not too small but the low regression coefficient in these cases do not allow to speak of scale-free attributes. From this comparison of the different scenarios one commonality of the scale-free solutions clearly stands out: only in the scenarios where the actors do apply the conservative collaboration strategy networks with scale-free attributes emerge. This feature of scale-free networks over longer time periods for scenarios with the conservative strategy shows, that the SKIN-model allows for the evolution of innovation networks which are not only stable and a persistent organisational form of industrial R&D but also, under certain circumstances, structurally corresponds to network architectures found in the reality of knowledge intensive industries.
15
4.
Conclusions
The SKIN-Model is an attempt to improve our understanding of the complex processes going on in modern innovation. The model goes far beyond previous theoretical attempts in economics of analyzing the industrial organization of innovation processes. Instead of integrating strategic alliances and cooperative R&D in a standard equilibrium model of oligopolistic competition, insights coming from numerous case and industry studies are used to model the decision procedures. Using an agent-based simulation allows the modelling of innovation which can abstract from reality without assuming away the essentials of innovation processes (e.g. true uncertainty, historical time, heterogeneous agents learning experimentally and learning from each other in partnerships and networks) which are heavily emphasized by modern innovation economics (e.g. Nelson, 2001). SKIN allows the investigation of different industries whereby there are different strategies envisaged with respect to the setting up of the particular model’s parameters. First, parameters can be estimated econometrically from various industry data sets describing the industry’s cooperative behaviour which are increasingly available for e.g. biotechnology-based industries. As an alternative strategy the historical development of a particular industry can be reproduced by finding an adequate set of parameters. In this paper we followed the second strategy and reproduced some stylized facts of real world innovation networks in knowledge intensive industries. In particular SKIN can reproduce viable and persistent networks supporting the actors in their knowledge creation and diffusion processes. Furthermore, the networks evolving in the artificial SKIN-world show structural similarities with real world networks with respect to their degree distribution. Under certain circumstances SKIN innovation networks tend to be characterized by scale-free attributes which are also characteristic for the architecture of innovation networks in knowledge intensive industries.
16
APPENDIX The code for the NetLogo model on which this paper is based is available on request from the first author. The standard scenario use the following parameter settings: •
Initial capital: 20000 (big firms: 200000)
•
Initial population of firms: 500
•
Number of large firms, with extra capital at the start: 50
•
Range of product index numbers in the sector: ]0.0 to 100.0[
•
Maximum difference between product and input index numbers for them to be considered substitutable: 1.0
•
All products with a product number below 5.0 are considered to be ‘raw-materials’ and all those with numbers above 95 are ‘end-user’ products.
•
Price of raw materials: 1
•
Maximum price of end-user products: 1000
•
Profit required to attract new start-ups: 1200
•
Partnering search strategy: conservative
•
Attractiveness threshold to allow two firms to partner: 0.3
•
Capital cut-off below which firms do radical rather than incremental research: 1000
•
Taxes: per time step: 200; per incremental research attempt: 100; per radical research attempt: 100: per partner: 100
17
References Ackermann, R. (1970): The Philosophy of Science. New York: Pegasus. Ahrweiler, P., A. Pyka and N. Gilbert (2004): Simulating Knowledge Dynamics in Innovation Networks. In: R. Leombruni and M. Richiardi (eds.), Industry and Labor Dynamics: The Agent-based Computational Economics Approach. Singapore: World Scientific Press, pp. 284-296. Amable, B. (2003): The Diversity of Modern Capitalism. Oxford: Oxford University Press. Bahlmann, T. (1990): The Learning Organization in a Turbulent Environment. In: Human Systems Management 9, pp. 249-256. Barabasi, A., Albert, R. (1999), Emergence of Scaling in Random Networks, Science, Vol. 286, 509-512. Cantner, U. and A. Pyka (1998), Absorbing Technological Spillovers. Simulations in an Evolutionary Framework. In: Industrial and Corporate Change 7/2, pp. 369-397. Cohen, W.M. and Levinthal, D. (1989) ‘Innovation and learning: the two faces of R&D’, The Economic Journal, Vol. 99, pp.569–596. D’Aspremont, C. and Jacquemin, A. (1988) ‘Cooperative and non-cooperative R&D in duopoly with spillovers’, American Economic Review, Vol. 78, pp.1031–1038. Duncan, R. B. (1974): Modifications in Decision Structure in Adapting to the Environment. Some Implications for Organizational Learning. In: Decision Sciences 5, pp. 705-725. Eliasson, G. (1995) ‘General purpose technologies, industrial competence and economic growth’, Working Paper, Royal Institute of Technology, Stockholm. Gilbert, N. and Troitzsch, K. (1999) Simulation for the Social Scientist, Berkshire, UK: Open University Press. Gilbert, N. G. (1997), ‘A Simulation of the Structure of Academic Science’. In: Sociological Research Online 2/2, http://www.socresonline.org.uk/socresonline/2/2/3.html. Hanusch, H. and Pyka, A. (2006), The Principles of Neo-Schumpeterian Economics, In: Cambridge Journal of Economics, Vol. 30. Hedberg, B. (1981): How Organizations learn and unlearn. In: P. C. Nystrom and W. H. Starbuck (eds.): Handbook of Organizational Design. Oxford: Oxford University Press, pp. 3-27. Lam, A. (2003): Organizational Learning in Multinationals: R&D Networks of Japanese and US MNEs in the UK. In: Journal of Management Studies 40/3, pp. 673-703. Levin, R.C. and Reiss, P.C. (1988) ‘Cost-reducing and demand creating R&D with spillovers’, Rand Journal of Economics, Vol. 19, pp.538–556. Nelson, R.R. (2001) Evolutionary Perspectives on Economic Growth, in: Dopfer, K. (ed.), Evolutionary Economics, Program and Scope, Kluwer Academic Publishers, Boston, Dordrecht, London, 2001. Powell, W.W. (1990): Neither Market nor Hierarchy. Network Forms of Organization. Research in Organizational Behavior 12: S. 295-336. Powell W.W., Douglas R. White, Kenneth W. Koput, Jason Owen-Smith (2005), Network Dynamics and Field Evolution: The Growth of Inter-organizational Collaboration in the Life Sciences. American Journal of Sociology 110(4):1132-1205 18
Pyka, A. (1999) Der kollektive Innovationsprozess – Eine theoretische Analyse absorptiver Fähigkeiten und informeller Netzwerke, Berlin: Duncker and Humblot. Pyka, A. (2002) ‘Innovation networks in economics: from the incentive-based to the knowledge-based approaches’, European Journal of Innovation Management, Vol. 5, pp.152– 63. Pyka, A. and Saviotti, P.P. (2005), The Evolution of R&D Networking in the Biotech Industries, International Journal of Entrepreneurship and Innovation Management, Vol. 5, 2005, 49-68 Saviotti, P.P. and Nesta, L. (2006), Firm knowledge and Market Value in Biotechnology, Industrial and Cooperate Change, forthcoming. Summerton, J. (1999): Linking Artifacts and Actors in Electricity. In: O. Coutard (Hg.) (1999): The Governance of Large Technical Systems. London: Routledge. Tesfatsion, L. (2001) ‘Agent-based modelling of evolutionary economic systems’, IEEE Transactions on Evolutionary Computation, Vol. 5, pp.1–6. Toulmin, S. (1967): The Philosophy of Science. An Introduction. London: Hutchinson. Windrum, P. (2006) ‘Neo-schumpeterian simulation models’, in H. Hanusch and A. Pyka (Eds) Elgar Companion to Neo-Schumpeterian Economics, Cheltenham, UK: Edward Elgar.
19