Assuming some initial node distribution in a simulation area, we can guarantee, with some probability, that the network is connected at that moment in time.
Simulating Mobile Ad Hoc Networks: Estimation of Connectivity Probability Tatiana K. Madsen, Frank H.P. Fitzek and Ramjee Prasad Dept. of Communication Technology Aalborg University Aalborg DK-9220 Denmark Email: tatiana ff prasad @kom.aau.dk �
Abstract— The network connectivity is one of the important parameters for ad hoc networking, where the communication between nodes relies on the multihop links. It can have a significant impact on the system performance. Therefore, it is important to be aware of the network properties for the correct interpretation of simulation results. The paper shows how to define and evaluate the connectivity probability of a mobile network where the position of the nodes and the link quality changes over time. A number of mobility models is considered including Virtual World model based on the mobility measurements of a multi-player game. Keywords— ad hoc network, mobility models, simulations, connectivity probability
I. I NTRODUCTION A wireless ad hoc network is formed by a group of nodes without help of fixed network infrastructure. Nodes, that are not within proximity, can communicate with each other using multihop capabilities of the neighboring nodes: intermediate nodes act as routers forwarding traffic from the source node towards the destination. Spontaneous creation and subsequent maintenance of a network is a desired property in a wide range of application scenarios, ranging from sensor networks to conferencing and home networking. For efficient design of ad hoc networks, new types of routing protocols are required that are able to operate in the distributed manner and react fast on the fluctuating link and route quality. It has been realized that the mobility pattern of nodes has a significant impact on the performance of routing protocols [1]. To incorporate user mobility in the simulation evaluation, a variety of models have been proposed (see [2,3] and references therein). To represent unpredictable behavior of mobile users, these models include some form of randomization, when initial position, direction and/or speed of movement are chosen randomly. For the correct interpretation of evaluation of simulation results, researchers should be aware of the properties of a network with a chosen mobility pattern. For multi-hop networks one of the most important issues is the frequency of link breakages (or in other words, the life-time of a route [1]). But the first question to be answered is whether or not a route between source and destination exists at a given moment in time. This issue is the focus of this paper. Observing a network at a given moment in time, we can determine whether or not some of the nodes are isolated from other nodes. Assuming some initial node distribution in a simulation area, we can guarantee, with some probability, that the network is connected at that moment in time. The problem of network connectivity has been studied in the static environment [4]. But what will happen when the nodes start moving around? Some links will be broken and new links will be established, but can we be sure that the network remains connected? This paper gives answers to these questions and it provides an analysis of the connectivity of a mobile network considering different mobility models. This is especially important for scarce networks where the node density is low. We introduce the measure
�
�
of connectivity, called connectivity probability, that reflect the status of a network under mobility of nodes. We illustrate its usage with examples of Random Direction [3], Random Waypoint [3] and Attractor mobility models. Random Waypoint model is widely used for protocol performance evaluation and is implemented in the network simulator ns-2. Ergodic properties of Random Direction (RD) model allow us to derive analytically an expression for connectivity probability when node movements follow the RD pattern. The attractor model is a simple enhancement of the RD model when regions of slow movements are introduced. This leads to non-homogeneous node distribution on the simulation area. There is an ongoing discussion [5] if one can use mobility models based on random processes for simulating ad hoc networks. It is unclear whether such models are applicable to real world situations, such as public hotspots, military and rescue operations. In [6] a new approach for mobility measurements in virtual worlds is introduced. The mobility measurements of a multi-player game, such as Quake II, can be used for investigation of the impact of mobility on the performance of multi-hop protocols. We adopt this approach and illustrate that in the case of Virtual World mobility models the connectivity probability is an important parameter to consider. It is expected that applications of ad hoc networks will have a wide range including both large-scale outdoor and small-scale indoor scenarios. For the latter the presence of obstacles that block node movement and hinder propagation of wireless signals can have a significant influence on the network connectivity. A discussion on how different signal propagation models can be simulated is provided in the paper. The remainder of the paper is organized as follows. Section 2 introduces a formal definition of the connectivity probability. Section 3 explains how the connectivity measure can be calculated for different mobility models. In Section 4 an example of a simulation area with obstacles is considered and different propagation models of the signal between a pair of nodes are discussed. Section 5 offers some concluding remarks. II. D EFINITION OF C ONNECTIVITY P ROBABILITY To estimate the properties of connectivity of a network in presence of mobility, we introduce a measure, called the connectivity probability. This parameter is defined as a measure of a time intervals during which the network is connected. It gives the probability that observing the network in randomly chosen point in time we will find it connected. It is convenient to use connectivity probability because it can capture the important properties of a network when position of nodes and states of the links change over time. We start with giving definitions of a connected network in a static environment. This is essentially the same as observing a network in one snap-shot of time. Then we provide a formal definition of the connectivity probability.
�
Let us consider inside a bounded domain on the �nodes Euclidean Let be a bounded domain on the Euclidean ��� plane. �� �� with piecewise smooth borders. Inside domain plane � �� � there are nodes. In the initial moment nodes �� � ������ �are��� somehow placed and then they start moving. Let ��� be the radius-vector of node � . Further, we assume that every node has a transceiver with communication range � : if the distance between two nodes is larger than � , they cannot establish a direct communication link. Nodes can transmit information by using multihop connections. Definition 1. At a given moment in time a network is connected (or fully connected) if for every pair of nodes there exists a path between them. One can define a weakly connected network as a network where none of the nodes is isolated, or formally Definition 2. At a given moment in time a network consisting of nodes is weakly connected if �
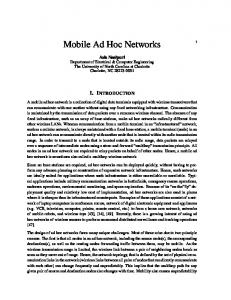
Especial interest has a case when a new direction is chosen such that the trajectory of movement forms equal angles with the boundary. This movement pattern is well-known in the theory of dynamical systems. It presents a remarkable example that successfully realizes ergodic properties which makes this model amiable to theoretical analysis. To distinguish this model from the Random Direction model, we have borrowed a term from ergodic theory and called it the Billiard model. One of the important characteristics of the Billiard model is a uniform node density distribution (Fig. 1). This can be shown directly or by using the following well-known fact from the theory of dynamical systems: in a billiard system for almost every initial conditions a trajectory of a node covers a region of motion everywhere dense.
��� �! # � &(' "%$ + ) � * � ��, ��- !* . � where � is the communication range, �!/ is the radius-vector of � node 0 and *�1�* is a metric in � . Under motion of nodes a semiaxis of time �32 is divided into intervals 465 � 4�8 � 4�5 �;:;:;: 7 � 9 4 2 � 4>= � < denotes a time interval during which the network where < is connected (disconnected) (Figure 1). Denote ? 2 �A@ 4 < 2 � ? = �A@ 4 < =
Now the probability that a network is connected
be defined as ? 2 on a semiaxis �32 � 3B can a measure of set . This measure is defined as it is customary in number theory: �
C 2 ��D "%� 4LKNM!O � ? Q 2 PJR � 4TS � E�FHGJI
� � I
if this limit exists. Analogously the probability that a network is disconnected can be introduced:
C = ��D "%� 4 KNM!O � ? = P R � T4 S � E�FHG I
In the similar way, one can define the probability that a network is weakly connected. If other aspects of the network connectivity are of interest, e.g. we require that a certain number of nodes can communicate, the definition of probability can be derived following the same described above principle. For simplicity (not to confuse a reader), we consider only the probability of a fully connected network in the ? =WV paper. R � 4XSZY>[ U ? =QV R � 4TSZY � R � 4XS , C 2]\ C = � . Since U I Therefore, the problem of connectivity of a network consisting of moving nodes is reduced to the problem of existence and calculation of the limit (1).
0.00364 0.00363 0.00362 0.00361 0.0036 0.00359 0.00358 0.00357 0.00356 16 14 12 10
0
2
4
8
Fig. 1.
Y/10, m
6
6
8
4
10
X/10, m
12
14
2 16 0
Node density distribution for Billiard model
Using ergodic properties of a billiard and applying Birkhoff individual theorem [7], it can be shown that the limit (1) always exists. Therefore, the measure of connectivity is defined correctly. Moreover, the following formula for the probability connectivity can be derived: � � C � mes`ba
2
c is a number of nodes, � �d
ced
^
where is an area of a simulation region, and ` a is a domain in consisting of all possible positions of the nodes such that the network is connected (for detailed derivations see [8]). It seems to be difficult to find a close form expression for the measure of `fa as a function of � . Instead, Monte-Carlo simulations can be used: nodes are placed randomly, independently and uniformly in a simulation area and the connectivity of the C network is verified. Then 2hgjilknm , where m is a total number of simulation trials and i is a number of successful trials (when the network is connected) if m is chosen sufficiently large. 1
III. C ALCULATION OF C ONNECTIVITY P ROBABILITY
A. Random Direction model In Random Direction model, nodes select a direction in which to move, uniformly between 0 and ^!_ , and speed from a given distribution. Subsequently motion starts. Once the simulation boundary is reached, a node pauses for a specified period of time, then it chooses a new direction uniformly toward the inside of the simulation domain and the process continues.
0.8 Connectivity probability
In order to find the connectivity probability for a particular movement pattern, one should calculate the limiting value of (1). Though in some special cases, a simpler expression can be derived C for 2 , for example, as in the case of Random Direction mobility model.
0.6
5 nodes 10 nodes 50 nodes
0.4
0.2
0 0
20
40
60
80
100
Communication radius
o �
Fig. 2. Connectivity probability as a function of communication radius. Simulation area 100x100
r = 30, n = 100 r = 40, n = 80
B 0.91 0.99
RW 0.85 0.97
Att 0.55 0.90
Tab. 1. Connectivity Probability for Billiard, Random Waypoint and Attractor models
By using formula (2) and Monte-Carlo simulations, we have calculated the connectivity probability dependence on a communi-� K cation radius where the simulation area is a square of 100x100 and the number of nodes is equal to 5, 10 and 50 (Figure 2). When the density of nodes is high, in order to have a connected network with probability 95% at any moment of time, we should require the communication radius of 20 m. One should note that in the case when all nodes move with the same speed, the connectivity probability would not depend on the actual value of the speed. To obtain Figure 2 one could choose to use directly the definition. Comparing two approaches, we have done some measurements of cpu time. To obtain connectivity probability for one set of parameters, using formula (2) it takes approx. 132 sec, whereas if we calculate directly by using (1), cpu time is more than 2000 sec. The big difference in cpu times can be explain by the fact that in the second case modelling in time is required and at each time stamp we have to recalculate the positions of the nodes. Moreover, using Monte-Carlo approach, we can estimate how many simulation runs is required in order for results to lie within a specified confidence interval. Applying direct calculation, it is not possible by any analytical means to estimate how long in time we have to perform the simulation, - it can differ in each particular case. Therefore, it is computationally less expensive to use the second approach for the simulations. It can be shown that formula (2) can be used not only for the Billiard model, but also in general � is a domain in � 9 ormore � is cases of RD model [8]: when when a rectangular domain containing rectangular-shape obstacles (see Section 4). Considering other mobility models, in order to estimate the connectivity probability one should perform direct calculation of the limit (1). B. Random Waypoint model Another widely used for protocol performance evaluation model is the Random Waypoint model. A node chooses a random destination and a travelling speed and travel towards the destination along a straight line. Upon arrival, it pauses and repeats the process. Table 1 shows connectivity probability for following set of K � , the parameters: simulation area is 150x150 number of� nodes ( is � 100 and ( and communication radius � is 30 m, and � m. Comparing results for Billiard and Random Waypoint, one can observe that the connectivity probability for RW model is lower, though the same set of parameters were considered. This result can be explained if we consider the node distribution in the simulation area for these two models. As it was already noticed (see e.g. [5]), the node density distribution for RW is not uniform, but has a convex shape. Figure 3 shows histogram obtained K � areaa with through simulation on a 150x150 80 nodes. The area is divided into 15x15 subareas and the number of nodes in the subarea at every time step is counted. A higher node density in the middle of the area and a significantly lower density at the area edges id due to the fact that nodes at the borders are more likely to move back to the middle by randomly choosing a new direction of movement. The node density has a direct impact on the connectivity probability. The existence of areas with low density leads to the decrease in the connectivity, as we can see from Table 1. If a scarce network is considered with low number of nodes, then the opposite effect can be observed. Table 2 shows results when the
��
�
number of nodes is equal to 13. The probability to find a network fully connected under Random Waypoint is higher than for Random Direction model. In this case the density of nodes is so low even in the high density region, that the number of nodes might not be enough to form a connected network. Therefore, here the fact that for RW model in the central part of the simulation area the node density is higher plays crucial role.
0.0036 0.0034 0.0032 0.003 0.0028 0.0026 0.0024 0.0022 0.002 0.0018
0
2
4
6 X/10, m
Fig. 3.
8
10
12
14
16 0
2
4
6
8
10
12
14
16
Y/10, m
Node density distribution for Random Waypoint model
C. Attractor model The considered above models result in almost uniform spatial node distribution. Tough we can imagine situations when mobile users tend to gather in one subarea (shopping mall or traffic jam due to a road construction). These scenarios can not be captured by group mobility models when a group of users exhibit similar behavior. To reflect individual trajectories of users movement that willingly or due to some circumstances spend some time in one subarea, we introduce a mobility model called Attractor model. The main feature of this model is the presence of gravity points or areas that attract mobile users. One can think of many ways how attractors can be simulated. For example, one can specify points of attraction and how the users move from one point to another by borrowing methods of fluid dynamics. Here we propose another, very simple way introducing areas of viscosity. We can take any movement pattern as underlying mobility model and enhance it with regions of slow movement. K � As an example, we consider 80 nodes moving in the� 150x150 K O area according to Random Direction model with k . Two attractors are introduced: one viscosity region is a disk with center in (50, 50) and radius 30 m, the second is a disk with center located in (100,100) and radius 20 m. When coming to the first attractor, the users slow down to 1 m/s and in the second region the speed of movement is 0.5 m/s. This results in non-uniform density distribution (see Figure 4). High density corresponds to the attractor areas. One can observe that the node density is inverse proportional to the speed of� movement: density in the second is approx. M!O k K , in the first 0.048 M!O k K � , in attractor 0.1 the rest of the area � M!O k K . 0.001 As expected, the probability to have a fully connected network for Attractor model is significantly lower than for Billiard and Random Waypoint models if the same number of nodes are considered (Table 1). For Attractor model nodes tend to spend more time in the viscosity regions where nodes are located close enough to be able to communicate directly or where there are enough nodes to support multihop connections. In the rest of the area, due to the low node density, the probability that the network becomes disconnected is higher.
� ��
�� ��
��
0.12 0.1 0.08 0.06 0.04 0.02 0
0
2
4
6 X/10, m
8
10
12
14
16 0
2
4
6
8
10
12
14
16
is to apply the definition directly and observe if the limiting value exists. It could, in principle, happen that the expression in (6) does not converge to any value. In this case, we can not speak about the connectivity probability and the universal measure to characterize the connectivity of a network under mobility of nodes does not exist. Fortunately, in many cases a collection of nodes comprises a “good” dynamical system and for almost all initial conditions the limit exist. 1
Y/10, m
0.9
Fig. 4.
Node density distribution for Attractor model
r = 85, n = 13 r = 70, n = 13 r = 50, n = 13
Quake 0.94 0.8 0.15
B 0.98 0.84 0.21
RW 0.99 0.97 0.61
Connectivity Probability
0.8 0.7 0.6 0.5 0.4
r = 85 m r = 70 m r = 50 m
0.3 0.2 0.1
Tab. 2. Connectivity Probability for Quake, Billiard and Random Waypoint models
0 0
1000
2000
3000
4000
5000
6000
7000
time
D. Virtual world model Presented above models are generally used for simulations because they provide an easy way to simulate movements of nodes. It is a common concern among researchers in the field of selforganizing networks how realistic these models are and if the results obtained with the help of these models reflect the real-life situation. From the other hand, obtaining realistic measurements of mobility is complex and expensive. To create a more realistic model, multi-player games can be used since they can measure the mobility of the players in the game’s virtual world [6]. The software for multi-player games is no longer limited to games, but it is also used to emulate the real world. Therefore, it is possible to create new virtual world and adopt them to specific needs. Following the approach presented in [6], we use virtual world scenarios to explore mobility issues. To obtain mobility patterns, a multi-player game, Quake II, is used. The traces of 13 players moving in the square area were recorded (Figure 5). The position of each player was logged every time the server updated a frame, that is approx. every 100 ms. The data was collected for about 12 min (for more details see [6]). For post-processing the data, the area of players movement,� 4000 x 4000 units of the map editor, K . was scaled to 150x150
Fig. 5.
Sample of trajectories of 3 players
Using the measurement data, we can try to estimate the connectivity probability in this case. The only way to perform calculation
Fig. 6.
Connectivity probability for Virtual world model
In the considered example we plot the expression under (1) calculated assuming different communication radius (Figure 6). One can observe that the limiting value exists (curves asymptotically approaches constant lines).
0.09 0.08 0.07 0.06 0.05 0.04 0.03 0.02 0.01 0
0
2
4
6 X/10, m
Fig. 7.
8
10
12
14 0
2
4
6
8
10
12
14
16
Y/10, m
Node density distribution for Virtual World model
The difficulty of using virtual traces is that the limited material is at dispose for the analysis. We can not predict how the users will move in the future, at the times when we stop recording traces. The conclusion to be made here is if the users would have the similar type of behavior that the one observed, then at any point in time we would find the network fully connected with the probability 80% if communication radius is 70 m. The connectivity probabilities of Quake and Billiard models (Table 2) are close, but for the Billiard it is slightly higher. Though the density histograms looks quite different for these two models. In Quake the players were given the mission to explore the area. In principle, it could mean that a user would try to visit every subarea at least once, and if we would observe the users behavior for sufficient long interval of time and record the density distribution, we could expect it to be close to uniform. In reality, the density graph (Figure 7) differs from RD model. The area along the right wall was almost unvisited, whereas in the rest of the territory small density picks are almost uniformly spread. Some player were more
1
”lazy” than others and they preferred to spend more time in one place. This and may be the presence of some interesting objects contributed to the non-uniform distribution.
One way to make simulation scenarios more realistic is to incorporate obstacles in the simulation area [9]. This is especially actual when simulating indoor scenarios where the influence of walls and other objects can not be ignored. As an example we consider a situation pictured in Figure 8. 6 users move in a room 30m by 20 m is divided by a 20 meter wall (e.g. a museum or exhibition hall). For some positions of the nodes the wall is blocking the communication and no line-of-sight (LOS) path exists. The question to answer is if the communication is still possible between a pair of nodes in such situations. Some assumptions should be made about the propagation characteristics and the signal strength decay.
0.8 0.7 Connectivity Probability
IV. M OBILITY MODELS WITH OBSTACLES
0.9
0.6 0.5 0.4 0.3 0.2 line A line B line C
0.1 0 0
5
10
15 20 25 Communication radius
30
35
40
Fig. 9. Connectivity probability as a function of communication radios. Number of nodes = 6. Line A: LOS always exists, Line B: signal is decayed in NLOS cases, Line C: signal is completely blocked in NLOS cases
connectivity. On examples of Random Direction, Random Waypoint and Attractor mobility models we illustrate the applicability of the developed framework. The connectivity probability can be also estimated if some measurement data is available, e.g. traces of players in Quake game. The relationship between the connectivity probability and the node density is underlined. The method is further illustrated on a scenario with obstacles with different propagation models of the signal. Fig. 8.
Simulation area with an obstacle
Line C (Figure 9) is plotted under the assumption that when a signal is propagated between a pair of nodes and there is an obstacle obstructing the direct transmission path, the signal is completely blocked by the obstacle. We can observe that the probability of having a connected network is not higher than 0.9 regardless of the communication range/ transmission power of the device. This is not very realistic. For comparison the connectivity probability is shown when no wall is present (line A). This is equivalent to the situation when the wall is made of such light material that it does not seriously obscure the communication. Usually, simulating ad hoc networks, a simple propagation model is used: a receiving power decreases with the distance and the communication radius is specified (within this distance the direct communication between two nodes is possible). To keep simulation complexity low, something the same simple is desirable to define for the case when obstacles are present in the simulation area. We propose to use the following simplified propagation model: a signal can reach the receiver (the signal is not completely blocked by an obstacle or we rely on non LOS propagation mechanisms, such as reflection, diffraction and scattering), but in this case the receiving power is 20dB smaller compared with the case when a LOS path exists. Line B is obtained under this assumptions. The number 20dB seems to be realistic for an indoor environment, but one should be careful choosing it. It can vary a lot depending on materials of walls and ceiling, size of the room and the size and form of other objects. A proper number should be chosen in each particular case. From Figure 9 one can see that in contrast with the line C, for the line B there exist parameters of the system where the connectivity probability is almost one. V. C ONCLUSION We present a new method of describing the connectivity of a mobile ad hoc network as a measure. The results of the paper consist of a number of theoretical insights and proofs, which also can be of interest to researchers in the area of ad hoc networking, since they highlight the important issue of mobile ad hoc network
ACKNOWLEDGEMENTS The authors would like to thank L. Badia, G. Schulte, and T. Henderson for their help in collecting the measurement data of the multi player game. R EFERENCES [1] N. Sadagopan, F. Bai, B. Krishnamachari, A. Helmy,“PATHS: Analysis of PATH Duration Statistics and their Impact on Reactive MANET Routing Protocols”. In Proceedings of the 4th ACM international symposium on Mobile ad hoc networking & computing, June 2003. [2] C. Bettstetter. “Smooth is Better than Sharp: A Random Mobility Model for Simulation of Wireless Networks”. In Proceedings of the 4th ACM International Workshop on Modelling, Analysis, and Simulation of Wireless and Mobile Systems, Italy, July 2001. [3] T. Camp, J. Boleng and V. Davies. “A Survey of Mobility Models for Ad hoc Network Research”. WCMC: Special Issue on Mobile Ad Hoc Networking, 2(5): 483-502, 2002. [4] C. Bettstetter. “On the minimum node degree and connectivity of a wireless multihop network”. In Proceedings of the 3rd ACM international symposium on Mobile ad hoc networking & computing, June 2002. [5] J. Yoon, M. Liu, B. Noble. “Random Waypoint Considered Harmful”. In Proceedings of INFOCOM 2003, April 2003. [6] F. Fitzek, L. Badia, M. Zorzi, G. Schulte, P. Seeling, T. Henderson. “Mobility and Stability Evaluation in Wireless Multi-Hop Networks Using Multi-Player Games”. In Proceedings of NETGAMES’03. May 2003. [7] V. Arnold and A. Avec, Ergodic problems of classical mechanics. Benjamin, New York. 1968. [8] T. K. Madsen, F. Fitzek, R. Prasad. “Impact of Different Mobility Models on Connectivity Probability of a Wireless Ad Hoc Network”. In Proceedings of International Workshop on Wireless Ad Hoc Networks. June 2004. [9] A. Jardosh, E.M. Belding-Royer, K.C. Almeroth, S. Suri, “Towards realistic mobility models for mobile ad hoc networks”, In Proceedings of the 9th annual international conference on Mobile computing and networking, September 2003.