For âventricular flutterâ simulation (irregular characteristic and higher frequency rhythm when compared with the normal ECG), it is employed. (elimination of ...
ADVANCES IN BIOMEDICAL RESEARCH
Simulation and Control of Heart Rhythm Dynamics M. J. LOPEZ, A. CONSEGLIERE, L. GARCIA, J. LORENZO Departamento de Ingeniería de Sistemas y Automática Universidad de Cádiz Escuela Superior de Ingeniería SPAIN {manueljesus.lopez, agustin.consegliere, luis.garcia, jose.lorenzo}@uca.es http://www2.uca.es/dept/isa-tee/ Abstract: - In this paper we propose a method for controlling heart rhythm behavior. A control law based on the electrocardiogram signal is used. Controller algorithm is based on two parameters, the controller gain and the norm of tracking error signal. The objective is to take out the heart rhythm dynamics from a non desirable situation (cardio-pathology) to a normal specified behavior, which is given by a signal generated by the reference system. System chaotification and synchronization of two chaotic systems are also considered. All these issues are interpreted as a tracking problem of a variable set-point signal, or by means of systems synchronization. Simulations are carried out using a mathematical model composed with six differential delayed equations, which provides different dynamical behaviors related with cardio-pathologies. By means of the proposed control law application, the heart rhythm is conduced to the specified behavior and satisfactory results are obtained in numerical simulations. Key-Words: - control law, heartbeat control, simulation, chaotic behavior, synchronization. dynamics [4, 5, 6, 7, 8]. Synchronization of two system can be seen as a particular problem of control, where the reference signal is generated by the drive system, and the controlled process corresponds to the response system. Control engineering techniques, as well as specific methods based on special properties of chaotic systems, have been applied to the synchronization problem [4, 5, 6, 7, 8, 9, 10,11]. In this paper we set out the problem of the heartbeat control where the reference signal is generated following a response patron or set-point. To carry out the proposed method the ECG signal is used, and a mathematical model for heartbeat based on three VdP type oscillators are employed, which captures the general behavior of the heart rhythm reproducing normal behavior and some heart disease cases. The rest of this paper is organized as follows: in section two control and synchronization problems are set out. Dynamical models used in simulations are described in section three. Simulation results are presented in section four, and finally conclusions are resumed in section five.
1 Introduction Heartbeat dynamics control must be carried out in some heart pathologies, which can be detected by means of the electrocardiogram (ECG). The electrocardiogram is a time-varying signal reflecting the ionic current flow which causes the cardiac fibers to contract and subsequently relax. The surface ECG is obtained by recording the potential difference between two electrodes placed on the surface of the skin. A single normal cycle of the ECG represents the successive atrial depolarization/polarization and ventricular depolarization/polarization which occurs with every heartbeat. These can be approximately associated with the peaks and troughs of the ECG waveform labeled P, Q, R, S and T. Maximum peak of wave is named R-peak, and the RR-interval is the time between successive R-peaks. The inverse of RRinterval gives the instantaneous heart rate. The normal cardiac rhythm is generated by a specialized aggregate of cells in the right atrium called sino-atrial (SA) node, which is considered the normal pacemaker. In addition, there is another pacemaker, the atrio-ventricular (AV) node [1, 2, 3]. Controlling irregular and chaotic heartbeats is a key issue in cardiology, underlying the experimental and clinical use of artificial pacemakers. There are different strategies of control, based on either in the use of external sources of periodic or quasi-periodic signals, as well as the use of small perturbations to stabilize periodic orbits embedded in the chaotic
ISSN: 1790-5125
2 Control and synchronization Synchronization and control are two equivalent terms, that nevertheless are used in different contexts. The term control is mainly used in relation with automatic control systems in engineering
509
ISBN: 978-960-474-164-9
ADVANCES IN BIOMEDICAL RESEARCH
[9,10,11], while the term synchronization is mainly used in the context of chaotic systems dynamics [4,5,6,7,8]. Since the seminar paper by Pecora and Carroll [4] on synchronization of chaotic systems, many attention and applications have been dedicated on this issue. Two basic situations are typical, the first corresponds to the case when the drive system and the response system have the same mathematical model except that parameters are lightly different, and the second case outlines the situation when the drive system and the response system are different. The experimental configuration known as unidirectional coupling supposes two chaotic oscillators, which are assumed to be identical, or nearly identical. In this case, the drive system and the response system correspond to systems of the same nature, i.e. the two have the same physical structure (dynamical model) and the model parameters take very similar values. Other practical situations correspond to when the response system parameters are very different to the corresponding parameters of the drive, and when the nature of the two systems is different, i.e. the systems are structurally different. Depending on case, several types of synchronization are considered, such as: complete (CS), lag (LS), phase (PS), rhythm (RS), frequency (FS) and generalized (GS) [4,5,6,7,8]. If an autonomous nonlinear dynamical system is considered, its dynamics can be expressed by a set of n ordinary differential equations
In case of unidirectional drive, the response system results modified to become a new system with its dynamics given by
with G(x,x’) verifying the condition G(x,x’) = F(x), for x’=x. This means that a signal made of the variables of the drive system, x, acts on the response system, which does not act on the drive system. This coupling describes a variety of practical situations, and two particular schemes are used: 1) continuous control method, as for example if it is employed (2) where Kp is a constant square matrix, and 2) replacement of variables or replacement method, which has a particular implementation known as subsystem decomposition due to the fact that the vector field F is decomposed in two components F = [Fa Fb]T, and likewise the state vector is decompose as x = [xa xb]T. In this case, the dynamics of the whole system is given by: The drive or reference system:
The response system:
(1) where its dynamical state, or state vector, is given by a n-dimensional vector and F(x) is a vector field of the same dimension. In case of chaos behavior it is assumed that the system parameters and initial condition are such that the steady evolution of the system occurs in a chaotic attractor, . In case of the vector field F depends explicitly on time, or if an external signal (scalar or vector) is used for control,
Identical synchronization (IS) is achieved between the response system and the drive system when there are sets of initial condition, for the drive system and for the response system, such that for all and for all
where ||.|| represents the Euclidean norm. This definition is still valid in case of using the replacement method named subsystem decomposition, if the initial condition of the response system is restricted to , and it is used the difference instead of in the previous definition. Generalized synchronization (GS) is considered when the equations of the response system are
(2) then the system is considered as non-autonomous. This occurs when control or synchronization between two systems are considered. A particular case corresponds to when the response system (indicated with prime) has the same structure than the drive system given in (1),
ISSN: 1790-5125
510
ISBN: 978-960-474-164-9
ADVANCES IN BIOMEDICAL RESEARCH
different from the drive system. In this case a condition for GS is given by
where is a vector function depending on x. From the point of view of control engineering, a control law as given in (2) corresponds to linear state feedback with proportional gain matrix Kp. If state vector variables are not available, then a measurement variable (scalar magnitude ) can be used,
where the parameters are related with physiological properties of the heart conduction system, and can be obtained and are voltage experimentally. The functions sources depending on currents and respectively. Other approach to characterize the cardiac pacemaker is based on the Van de Pol (VdP) ordinary differential equation (ODE), which is frequently used in theoretical models for modeling relaxation oscillators. The general expression of the VdP ODE has the form
It can be found in literature many design techniques based on a model of the process to control, such as optimal control, predictive control or robust control among others methods [9,10,11]. In this paper we employ a control strategy for heartbeat with pathological behavior. In first place we use a reference signal generated by a reference or drive system with the same structure than the response system (MS1 in section three) and the model parameters take very similar values (it can be associated with identical synchronization problem). In second place, the reference signal is generated by a system with different structure (MS2 in section three) or the response system has the same structure than the drive system (MS1) but its parameters are very different; and therefore it can be interpreted as a generalized synchronization problem. In both cases we outline the synchronization between systems as a control problem using the continuous control method, where the control law is based on the measurement of the ECG signal.
where a, b, and c are parameters and f(t) is an external forcing signal. The VdP system is a useful phenomenological model, due to it displays characteristic behaviors observed in physiological systems such as limit cycles, complex periodicity, synchronization and chaotic dynamics [5,8]. Although in this case no direct biophysical relation is taken with the dynamical variables of the VdP equation, it may be related the dynamical variable with the action potentials in the heart cells. Basically, an action potential is generated when the cell membrane is excited high enough to reach the threshold potential and activate the ion channels. Activated channels allow ionic currents to flow into or out the cell, thus changing its potential and resulting in the generation on an action potential [15]. A modified VdP equation used in practice for improved modeling of cardiac pacemakers is given by [ref Grudzinski-Zebrowski]
3. Dynamical model The cardiac conduction system is considered to be a network of self-excitatory pacemakers, with sinoatrial (SA) node having the highest intrinsic rate, and where the SA node is the dominant pacemaker of the heart. Others pacemakers with slower excitation frequencies are located in the atrioventricular (AV) node and the His-Purkinje system (HP). A candidate for simulations is a mathematical model with correspondence to the physiology of the heart conduction system [12,13,14], where two-coupled nonlinear oscillators are used:
ISSN: 1790-5125
are obtained where parameters experimentally. In order to describe the interaction between the rhythms generated by the SA and AV nodes, a set of two modified VdP equations are used [16], written in the general form of a pair of Lienard equations as
511
ISBN: 978-960-474-164-9
ADVANCES IN BIOMEDICAL RESEARCH
In simulations, as parameters values the suggested by [15,16,17] are used in simulations, with some modifications for magnitude ( ) and time scaling ( ) that we have included. The following parameters are used to simulate the normal heart functioning: and where the pairs of variables refer to the SA and AV nodes respectively, and model parameters are obtained experimentally. Usually, two oscillators are considered representing the SA and AV nodes, however, it is observed that these two oscillators are not enough to reproduce the ECG signal. This motivates the inclusion of a third oscillator that represents the pulse propagation through the ventricles, and it is included to take into account the His-Purkinje (HP) complex. If time delays in signals transmission are considered, the following system of delay differential equations (DDE) is obtained. This model has been adapted form from [17], due to it has been included a control signal , and also that in original equations the coupling terms are summing instead of subtracting,
with scaling factors β = (1.15/1.5) and α = 16. The model MS1 is used in order to simulate some heart pathologies identified from ECG, such as: 1) ventricular flutter (eliminating the coupling between first and second oscillators, , a chaoticlike response is obtained), 2) sinus bradycardia (obtained with , regular behavior with lower oscillation frequency), 3) ventricular fibrillation (chaotic-like signal is suggested). In our study we use this model (MS1) as process to control when an anomalous heart rhythm behavior is given. MS1 is also used for generating normal heartbeat and in this case MS1 is employed as reference system. In order to dispose another method for generating a reference signal, corresponding to a different dynamical system, we employ the mathematical model given by [18]. This model (MS2) generates typical (normal) human ECG, signal with a-priori specified characteristics of heart rate variability. Equations of MS2 are given by:
where , and represents the time delay. With this mathematical model (named as MS1 from now on) composed by three coupled oscillators, the ECG signal is built from the composition of signals as follows (where is a magnitude scaling factor that we have added for this work):
ISSN: 1790-5125
where
512
ISBN: 978-960-474-164-9
ADVANCES IN BIOMEDICAL RESEARCH
We propose in this work to use as set-point (SP) or reference signal the electrocardiogram signal generated by the reference system (ECGr), and as process variable (PV) or controlled variable (CV) signal the ECG produced by the heart to be controlled, which it is obtained by experimental measurement. We have studied by simulation different options for applying a control signal given by
and is the respiratory frequency. The aim of this model is to provide a standard realistic ECG signal ( in the previous ODEs system) with known characteristics, which can be generated with specific statistics such as the mean and standard deviation of the heart rate and frequency-domain characteristics of heart rate variability (HRV). Although authors [18] do not study possible chaotic performance of the system for determined parameters values, it would be interesting for synchronization and control analysis of chaotic systems. In our work we use this model (MS2) as reference system which generates a signal to follow by the closed-loop heart rhythm dynamics.
and we have concluded that if is applied as a input signal acting on equation of , as it appears in the MS1, better results are obtained than other options with scalar control signal are adopted. Therefore, control vector components in MS1 are given by:
The controller proportional gain, Kp, is adjusted to achieve a tracking error signal sufficiently small
Table 1. Parameters for the ECG ( specified a priori.
where is taken one half second after to connect the controller, the tracking error is given by , and the norm of a scalar signal e(t) is defined as
signal) model
4 Simulation results As process to control it is used the model MS1 (with non desirable behavior or pathology), and as reference system it is employed the model MS1 or the model MS2 to generate an specified reference signal. Three types of simulation experiments (SE) are considered: SE1, SE2 and SE3. In SE1 the objective is to take out the heart rhythm dynamics from a non desirable situation (cardio-pathology) to a normal specified behavior, which is given by the reference system. This is interpreted as a tracking problem of a variable set-point signal. In SE2 the problem of synchronization of two chaotic systems are considered, this is to say: the drive (reference) system has a like-wise chaotic behavior (ventricular flutter) and the response system has also an irregular behavior which seems to be chaotic (ventricular fibrillation or ventricular flutter with initial condition different to the drive system). In SE3 the response system presents a normal functioning and drive system has a like-wise chaotic behavior (ventricular flutter), and therefore a chaotification problem is established.
ISSN: 1790-5125
Adjusted values of and Kp are used as tuning parameters for obtaining more precise tracking. Simulation data presented in Fig. 1 to 6 have been carried using: i) Kp = 800 and in case of the reference signal is generated by MS2, and ii) Kp = 2500 and in case of the reference signal is generated by MS2. For simulation results obtained in Fig. 8 it is used Kp = 3000, and for Fig. 9 and 10 it is used Kp= 6000. These values have been obtained experimentally in an iterative simulation procedure. The following control problems have been carried out in simulations: 1) SE1 where the reference system is MS1 with heartbeat normal behavior, and the process to be controlled corresponds also to MS1, but with u=0 and different parameters values for three dynamical situations: 1.a) ventricular flutter, 1.b) sinus bradycardia, 1.c) ventricular fibrillation. 2) SE1 where the reference system is MS2 with normal heartbeat properties specified a priori, and the process to be controlled is MS1 in different
513
ISBN: 978-960-474-164-9
ADVANCES IN BIOMEDICAL RESEARCH
after controller is turned on. The reference signal (ECGr) is generated with MS1 in ventricular flutter oscillation. In this case, synchronization of two systems with chaotic behavior are obtained. The ECG signal shows ventricular fibrillation before controller is activated in t = 10 sec. Fig. 10 shows a chaotification experiment. It can be seen the tracking error signal, before an after controller on. In this case, the reference signal (ECGr) has been generated with MS1 in ventricular flutter oscillation (like=wise chaotic). The ECG signal shows normal heartbeat before controller is activated in t = 5 sec, and after a chaotification of the systems is achieved. The results showed in Fig. 8 and 9 are used to demonstrate how it is carried out synchronization between two oscillators with chaotic behavior; and the experiment showed in Fig. 10 has been carried out to show how chaotification of the system response is obtained.
dynamical situations: 1.a) ventricular flutter, 1.b) sinus bradycardia, 1.c) ventricular fibrillation. 3) SE2 where the reference system acts as drive system in a synchronization problem of two like-wise chaotic systems. 4) SE3 where a chaotification problem is considered. In case of using as reference (or drive) signal the generated by means of MS2, heart rate mean = 70 bpm and heart rate std = 1 bpm have been employed. For that, it is used the function ecgsyn.m for Matlab given by [18,19]. In order to obtain satisfactory results (signal magnitude and time response) in the ECG signal generated with the DDEs given previously (MS1), it is necessary introduce a time scaling in the DDE equations with scale factor , and an adequate value for in equation of ECG signal. Experimentally, we have obtained that these values are respectively: . As initial condition it is used . For “ventricular flutter” simulation (irregular characteristic and higher frequency rhythm when compared with the normal ECG), it is employed (elimination of coupling between first and second oscillators, which corresponds to communication interruption in the heart electric system). A chaotic-like response is obtained in this case, although to verify chaotic nature specific data analysis must be carried out for chaos testing, such as the maximal Lyapunov exponent or other techniques to distinguish between regular and chaotic dynamics in deterministic time series data [5,20,21]. In Fig. 1 it is shown as controller avoids the irregular behavior when it is connected. In Fig. 2 it is shown the tracking error obtained when MS1 and MS2 are respectively used as reference system. In order to obtain “sinus bradycardia” (regular behavior presenting a lower frequency rhythm), two and . parameters are changed, Fig. 4 and 5 show simulation results when MS1 and MS2 are respectively used as reference system. Simulation of “ventricular fibrillation” (irregular response which seems to be chaotic) is carried out modifying the following parameters:
2
ECGr
0 -1 0
2
4
6 Time (sec.)
8
10
12
2
4
6 Time (sec.)
8
10
12
2
ECG
1 0 -1 0
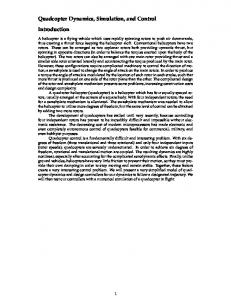
Fig. 1. Reference signal (ECGr) generated with MS1. The ECG signal shows ventricular flutter before controller is activated in t = 5 sec. 2
ECGr
1
0
-1 0
2
4
6 Time (sec.)
8
10
12
2
4
6 Time (sec.)
8
10
12
2
ECG
1
0
-1 0
Fig. 2. Reference signal (ECGr) generated with MS2. The ECG (mV) signal shows ventricular flutter before controller is activated in t = 5 sec.
Fig. 6 and 7 show simulation results when MS1 and MS2 are respectively used as reference system. Synchronization results of two systems whose behaviors have almost chaotic aspects are shown in Fig. 8, 9 and 10. In Fig. 8 the reference signal (ECGr) is generated for MS1 in ventricular flutter oscillation with initial state vector lightly different to the . response system one, In Fig. 9, the tracking error signal is shown, before an
ISSN: 1790-5125
1
514
ISBN: 978-960-474-164-9
ADVANCES IN BIOMEDICAL RESEARCH
Fig. 6. Reference signal (ECGr) generated with MS1. The ECG signal shows fibrillation ventricular before controller is activated in t = 5 sec.
|e|=|ECGr-ECG|
0.1
0.05
0 5.5
6
6.5
7
7.5 8 Time (sec.)
8.5
9
9.5
10
2 0.05
0 5.5
6
6.5
7
7.5 8 Time (sec.)
8.5
9
9.5
EC Gr
|e|=|ECGr-ECG|
0.1
10
Fig. 3. Tracking error obtained with Kp=800 when the reference system is MS1, and with Kp=2500 when the reference signal is MS2, for . Previous to t=5 sec., uncontrolled system has a ventricular flutter behavior.
2
4
6 Time (sec.)
8
10
12
2
4
6 Time (sec.)
8
10
12
EC G
2 1 0 -1 0
Fig. 7. Reference signal (ECGr) generated with MS2. The ECG (mV) signal shows fibrillation ventricular before controller is activated in t = 5 sec.
1
ECGr
0 -1 0
2
0 -1 2
1
4
6
8
10 12 Time (sec.)
14
16
18
20
2 0.9
ECG
1 0.8
0
0.7
4
6
8
10 12 Time (sec.)
14
16
18
|e|=|ECGr-ECG|
-1 2
20
Fig. 4. Reference signal (ECGr) generated with MS1. The ECG signal shows sinus bradycardia before controller is activated in t = 5 sec.
10 12 Time (sec.)
14
16
18
5
10
15
Time (sec.)
Fig. 8. Tracking error signal, before an after controller on. Reference signal (ECGr) generated with MS1 in ventricular flutter oscillation (like=wise chaotic) with initial state vector [0.1 0.71 0.1 0.21 0.1 0.71]. The ECG signal also shows ventricular flutter (obtained with other initial sate vector [0 0.7 0 0.2 0 0.7] before controller is activated in t = 10 sec. . Controller parameters are Kp=3000,
ECGr
8
0.3
0 0
0
6
0.4
0.1
1
4
0.5
0.2
2
-1 2
0.6
20
2
ECG
1
0
2 1.8
4
6
8
10 12 Time (sec.)
14
16
18
1.6
20
1.4 |e|=|ECGr-ECG|
-1 2
Fig. 5. Reference signal (ECGr) generated with MS2. The ECG (mV) signal shows sinus bradycardia before controller is activated in t = 5 sec.
1.2 1 0.8 0.6 0.4 0.2 0 0
ECGr
2
10
15
Time (sec)
Fig. 9. Tracking error signal, before an after controller on. Reference signal (ECGr) generated with MS1 in ventricular flutter oscillation (like=wise chaotic). The ECG signal shows ventricular fibrillation before controller is activated in t = 10 sec. Controller parameters are Kp=6000, .
1 0
-1 0
5
2
4
6 Time (sec.)
8
10
12
2
4
6 Time (sec.)
8
10
12
2
ECG
1 0
-1 0
ISSN: 1790-5125
515
ISBN: 978-960-474-164-9
ADVANCES IN BIOMEDICAL RESEARCH
[7] Pikovsky A., M. Rosenblum, J. Kurths (2001). Synchronization. A universal concept in nonlinear sciences. Cambridge University Press. [8] Guckenheimer J., P. Holmes (1983). Nonlinear oscillations, dynamical systems, and bifurcations of vector fields. Springer. [9] Skogestad S., I. Postlethwaite (2001). Multivariable Feedback Control. [10] Grimble M. J. (2001). Industrial control system design. Wiley. [11] Zhou K., J. C. Doyle, K. Glover (1996). Robust and optimal control. Prentice Hall. [12] Signorini M. G., S. Cerutti (1998). Simulation of heartbeat dynamics: A non-linear model. International journal of Bifurcation and Chaos, 8, pp 1725-1731. [13] Di Bernardo, M. G. Signorini, S. Cerutti (1998). A model of two non-linear coupled oscillators for the study of heartbeat dynamics. International journal of Bifurcation and Chaos, 8, pp 19751985. [14] Brandt M. E., G.Wang, H-T Shih (2003). Feedback control of a nonlinear dual-oscillator heartbeat model. Bifurcation Control, Eds. G. Chen, D. J. Hill, X. Yu. pp 265-273. Springer. [15] Grudzinski K., J. J. Zebrowski (2003). Modeling cardiac pacemakers with relaxation oscillators. Physica A 336, pp 153-162. [16] Santos dos, A. M., S. R. Lopes, R. L. Viana (2004). Rhythm synchronization and chaotic modulation of coupled Van der Pol oscillators in a model for the heartbeat. Physica A 338, pp 335355. [17] Gois S R. F. S. M., M. A. Savi (2009). An analysis of heart rhythm dynamics using a threecoupled oscillator model. Chaos, Solitons and Fractals 41, pp 2553-2565. [18] McSharry P. E., G. D. Clifford, L. Tarassenko, L. A. Smith (2003). A dynamical model for generating synthetic electrocardiogram signals. IEEE Transactions on Biomedical Engineering, Vol. 50, No. 3, pp 289-294. [19] Mathworks. Matlab & Simulink. www.mathworks.com. [20] Stefanovska A., M. Bracic (1999). Reconstructing cardiovascular dynamics. Control Engineering Practice 7, pp 161-172. [21] Small M. (2005). Applied nonlinear time series analysis. Applications in physics, physiology and finance. World Scientific.
|e|=|ECGr-ECG|
2 1.5 1 0.5 0 0
1
2
3
4
5 Time (sec.)
6
7
8
9
10
1
2
3
4
5 Time (sec.)
6
7
8
9
10
1.5
ECG
1 0.5 0 -0.5 0
Fig. 10. Tracking error signal, before an after controller on. Reference signal (ECGr) generated with MS1 in ventricular flutter oscillation (like=wise chaotic). The ECG signal shows normal heartbeat before controller is activated in t = 5 sec (chaotification). Controller parameters are . Kp=6000,
5 Conclusion A controller law based on the ECG signal is proposed based on two parameters: Kp and , where Kp is the controller gain and by means of parameter the maximum tracking error is established.. A mathematical model based on six differential equations with dead-times is used for heart rhythm dynamics simulation, and different non-desirable behaviors (cardio-pathologies) are used for testing our control algorithm. The objective of taking out the heartbeat from anomalous behavior to normal rhythm is achieved as results from simulation studies carried out. Chaotification and synchronization systems are also evaluated. In future works, clinic applications viability and other control methods will be considered.
References: [1] Enderle J. S. Blanchard, J. Bronzino (2005). Introduction to Biomedical Engineering. Elsevier. [2] Ottesen J. T., M. S. Olufsen, J. K. Larsen (2004). Applied Mathematical Models in Human Physiology. SIAM (Society for Industrial and Applied Mathematics). [3] Khoo M. C. K. (2000). Physiological Control Systems. IEEE Press. [4] Pecora L. M., T. L. Carrol (1990). Synchronization in chaotic systems. Physical Review Letter, 64, pp 821=824. [5] Sprott J. C. (2006). Chaos and Time-Series Analysis. Oxford University Press. [6] Gonzalez-Miranda J. M. (2004). Synchronization and control of chaos. Imperial College Press.
ISSN: 1790-5125
516
ISBN: 978-960-474-164-9