Abstract -- A new chip design paradigm called Network on Chip (NOC) offers a promising architectural choice ... A graphical animator tool, nam ... events. Simulation control also helps in selecting a subset of switches for monitoring and tracing.
Simulation and Evaluation for a Network on Chip Architecture Using Ns-2 Yi-Ran Sun, Shashi Kumar, Axel Jantsch the Lab of Electronics and Computer Systems (LECS), the Department of Microelectronics & Information Technology (IMIT), Royal Institute of Technology (KTH), Stockholm, Sweden {yiran,shashi,axel}@imit.kth.se Abstract -- A new chip design paradigm called Network on Chip (NOC) offers a promising architectural choice for future systems on chips. NOC architectures offer a packet switched communication among functional cores on the chip. NOC architectures also apply concepts from computer networks and organize on-chip communication among cores in layers similar to OSI reference model. We constructed a protomodel using a public domain network simulator ns-2 and evaluated design options for a specific NOC architecture which has a twodimensional mesh of switches. In particular, we analysed the series of simulation results about the relationship between buffer size in switch, communication load, packet delay and packet drop probability. All the results are useful for design of an appropriate switch for the NOC.
I. INTRODUCTION Moore's law predicts that by 2008, it will be possible to integrate over a billion transistors on a single chip. Current core based on SOC methodologies will not respond to the needs of the billion transistor era. Network on Chip (NOC), a new chip design paradigm concurrently proposed by many research groups[1],[2],[3] is expected to be an important architectural choice for future SOCs. The proposed NOC architectures offer a general but fixed communication platform which can be reused for a large number of SOC designs. A concept of computer network in layers based on the classical OSI reference model is used by all of proposed NOC architectures. We predict that NOC architecture would facilitate reuse at various levels of system design, thus reducing the time to design and test. However, NOC research is still in its infancy. A higher-level modelling will give us the insight of knowing more about its architecture. We would use the tool, Network Simulator ns21 [4],[5] which has been extensively used in the research for design and evaluation of public domain computer network, to evaluate various design options for NOC architecture, including the design of router, communication protocol, routing algorithms. This paper reports some experimental results based on the simulation of NOC using ns-2. In the following, we give a brief overview of our NOC architecture and introduction to ns-2. In section II, we describe how various aspects of our NOC architecture was modelled using ns-2. Section III gives a description for our simulation experiment, and in section IV some experimental results and corresponding analyses are presented. Finally, we draw some conclusions in section V. A. Overview of Our NOC Architecture Our NOC is a scalable packet switched communication platform for single chip systems. The NOC architecture consists of a m × n mesh of switches together with some resources which are placed on slots formed by the switches. Figure 1 shows a NOC architecture with 16 resources. Each switch is connected to four neighboring switches and one resource. Resources are 1. Ns is a simulation tool developed by the Network Research Group at the Lawrence Berkeley National Laboratory. Ns-2, or ns version 2 uses MIT's Object Tcl instead of previous Tcl.
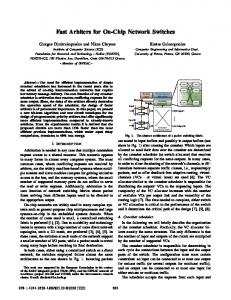
heterogeneous. A resource can be a processor core, a memory block, an FPGA, a custom hardware block or any other intellectual property (IP) block, which fits into the available slot and complies with the interface with the NOC switch. We assume switches in NOC have buffers to manage data traffic. Figure 2 shows the internal organization of a typical
Figure 1: A 4 × 4 NOC architecture
Figure 2: A NOC switch
switch. Every resource has a unique address and is connected to a switch in the network via a resource network interface (RNI). The NOC platform defines four protocol layers: the physical layer, the data link layer, the network layer, and the transport layer. The RNI implements all the four layers, whereas every switch to switch interface implements the three of four layers except physical layer. The NOC architecture also has a concept of region. A region allows us to handle physically larger resources and can be used to provide fault tolerance[3]. For our evaluation purposes, we assume a homogeneous NOC architecture, without any region. B. Network Simulator Ns-2 The simulator, ns-2, has facilities to describe network topology, network protocols, routing algorithms and communication traffic generation. It provides basic TCP and UDP as the network transmission protocols, four routing strategies (Static, Session, Dynamic and Manual) and many mechanisms for modelling traffic generation. It is possible to generate a traffic at random, by burst or with bias towards destinations. Additionally, the simulator has the possibility of incorporating protocols, routing algorithms and traffic generation defined by the user. The simulator is written in C++ and uses OTcl (Object Tool Command Language) for building command and configuration interfaces. The source code of ns-2 is also available[5]. Ns-2 provides well documented trace format for interpreting simulation results. A graphical animator tool, nam (Network AniMator), is also built into ns-2 for user's friendly visualization of the flow of messages and the whole system simulated. In this paper, a generic NOC architecture would be modelled and simulated in ns-2 with only built-in options. Tcl is used for specifying the NOC simulation model and running the simulation.
II. MODELLING NOC ARCHITECTURE The overall NOC simulation model (NOC-S thereafter) consists of four parts: topology, traffic generator,simulaton controller and recorder/monitor,as shown in figure3.
The Topology: A 5 × 5 two-dimensional mesh topology was modelled and simulated. This topology is easily scaled to different sizes. We don't distinguish among resources except that different resources have their unique communication addresses. Each resource connects with a switch through a RNI. Resources and switches are also treated similarly except Figure 3: The NOC simulation model that a traffic generator can be attached to a resource. Switch, resource and link are three basic elements in the topology. We assume that the buffer size in each resource is infinite but finite in switches. This implies that the packet being dropped cannot happen in resources but only take place in switches. There are two types of links in NOC-S, switch-toswitch and switch-to-resource. An inter-communication path is composed of a set of links identified by the routing strategy. Link delay and maximal bandwidth are two architecture parameters for modelling links. All these topology parameters can be described as a script file in Tcl. A part of the ns-2 script file [6], [7] about constructing the topology is shown below. # Set default values for topology construction set max_bandwidth 200Mb ;# the maximal link bandwidth set buffSize 8 ;# buffer size in each switch set linkDelay 0.1ms ;# delay on each link set nn 25 ;# total number of source/switch nodes # Create a simulator object set Nocns [new Simulator] # Create 25 resource nodes represented by different marks for {set i 0} {$i < $nn} {incr i} { set r($i) [$Nocns node] $r($i) shape square set n($i) [$Nocns node] } # Create links row-by-row for {set j 0} {$j < $x} {incr j} { set id [expr $j*$x] for {set i 0} {$i < [expr $x-1]} {incr i} { # define a link through setting duplex link, maximal link bandwidth, # link delay and queue management machenism with DropTail $Nocns duplex-link $r([expr $id+$i]) $r([expr $id+$i+1]) $max_bandwidth $linkDelay DropTail ... ... } } # Create links column-by-column ... ...
The Traffic Generator: is used for specifying a special communication scenario (to be introduced later) for our evaluation purpose, including the selection of traffic source-sink pairs, the traffic source behavior (e.g., telnet, ftp, or traffic On/Off by exponential distribution), the rate of traffic generation. The Simulation Controller: helps to control the simulation period by generating appropriate events. Simulation control also helps in selecting a subset of switches for monitoring and tracing. It can also help to control other aspects of a simulation. The Recorder/Monitor: is required for dynamically and instantaneously collecting useful simulation result.
III. SIMULATION EXPERIMENT For evaluation of performance, we define a communication scenario in which many traffic source-sink pairs are selected randomly and are concurrently active. The principle of communication locality was assumed that the shorter the distance between a traffic pair, the higher the probability that traffic takes place between them. We assume that 75% of traffic takes place between neighbor resources and 25% traffic is uniformly distributed among the rest. Each traffic source was attached to a traffic generator. When the event START triggers a simulation, every source starts to generate packets with the behavior defined by the attached traffic generator. A traffic generator with the behavior exponential On/Off distribution was adopted. It is mainly defined through three parameters, burst time, idle time and real traffic rate. The real traffic rate determines the total number of packets generated on the network within a unit time. The static routing strategy was used in each switch. A shortest communication path have been selected for each traffic pair before a simulation starts. Drop-tail of queue management mechanism which maintains exact FIFO queue management was used. It implies that the buffer size is a crucial parameter and it interacts with other performance parameters, such as drop probability, buffer utilization, and packet delay. The buffer sizes in the range of 1 packet to 8K packets were used in the simulation. We assumed a packet size of 8 bytes and maximal link bandwidth of 200 Mbits/s in our experiments. Two parameters, communication load and packet delay are defined for our evaluation of performance. A. Communication Load We define communication load ( L NOC ) as a measure of average traffic in the network. It is given by L NOC = L REAL ⁄ L MAX where L REAL and L MAX are the real network load and the maximal network load, which can be expressed as 2N link
L REAL =
∑
( N arrival ) i
i=1
T stop – T start L MAX = ------------------------------------ × 2N link ( 8 × P )BW max
respectively. N link represents the total number of links in the topology and two times means each link is a duplex link. ( N arrival )i is the total number of packets which are received by someone sink node from the beginning of simulation to the end. It is obvious that L NOC depends on the real traffic rate. The cross-reference between real traffic rate and communication load implemented in our experiments is listed in the first two columns of table 1. Real traffic rate (unit: Mbits/s) 190 150 120 100 80
Communication load (8192 >8192 7800 8 2
Table 1: Cross-reference between real traffic rate, communication load and boundary buffer size
B. Packet Delay Packet delay equals to the time taken by a packet to go through a communication path from its source to its intended sink. It can be given by
m
G delay = ( m + 1 ) × ( D t + D l ) +
∑ ( Dq )i i=1
where m is the number of hops. As shown in figure 4, Transfer ( Dt ) refers to the delay to put a packet on the link from a node, on the Link ( Dl ) refers to the delay on the link, and EnqueueDequeue ( Dq ) refers to buffer delay in a switch. We assumed that Dl is so small as to be ignored. Besides the two parameters mentioned above, two more else, drop probability and buffer utilizaFigure 4: General communication path in NOC-S tion were evaluated in our experiments as well. The drop probability can be simply expressed as the number of packets dropped divided by the total number of packets generated by traffic sources. Buffer utilization equals to the average buffer size occupied by packets in a buffer divided by the buffer size.
IV. SIMULATION RESULTS A. Drop Probability and Reasonable Buffer Size As shown in figure 5, the drop probability decreases as the buffer size increases. Different real traffic rates have different decreasing rates with the buffer size increasing. For higher traffic rates which are greater or equal than 120 Mbits/s, it is not significant that the drop probability decreases with the buffer size increasing from 4 packets to 1024 packets. It implies that the drop probability is not sensitive to the buffer size when the buffer size is large. Evaluating a reasonable buffer size is a crucial work for switch design. The third column of table 1 gives out boundary values of buffer size at which no packet is dropped for different real traffic rates. We made trade-off between buffer size and packet drop probability and got the conclusion that the reasonable buffer size should be less or equal than 8 packets while the real traffic rate is 100 Mbits/s or less.
Figure 5: Drop Probability vs. Buffer size
Figure 6: Drop probability vs. Communication load
B. Drop Probability and Communication Load The figure 6 shows that the drop probability increases as the communication load increases over some value of communication load. When communication load is less or equal than 0.3020, the drop probability remains zero, which means the network has a light traffic and few packets are dropped. However, it is obvious that increasing buffer size cannot provide significant compensation to the increasing of drop probability. We concluded that the drop probability is more sensitive to the communication load than to the buffer size.
C. Packet Delay, Communication Load and Buffer Size As shown in figure 7, the packet delay for five different buffer sizes are nearly 1 us when communication load equals to 0.3020. It implies that the buffer is little utilized when the communication load is low. With the communication load increasing, a number of packets are dropped, and the packet delay increases from 3 us to 10 us with the buffer size increasing from 4 packets to 64 packets. However, the packet delay almost is constant if buffer size is constant. It indicates that packet delay is not sensitive to the communication load when there are some packets dropped but is basically dominated by Figure 7: Packet delay vs. Communication load for differqueue delay. ent buffer sizes
V. Conclusion A higher-level modelling and simulation is required to evaluate various options in a NOC architecture. In this paper, ns-2 was used for carrying out some simulation experiments on the model of NOC-S for this purpose. From the simulation results we conclude that for a load of upto 30% a buffer size of 8 packets in each switch is sufficient to ensure zero drop probability; drop probability is more sensitive to communication load than to buffer size; packet delay is mainly dominated by delay in queue on the communication path. Since the results are theoretically reasonable, we conclude that ns-2 may be used for the simulation of NOC-S for our purpose. Adding models of actual NOC protocols and actual NOC routing algorithms to ns-2 will lead to more useful results. However, generating message traffic synthetically, corresponding to real applications is an important but hard open problem. Acknowledgements This work is a part of the joint Finnish-Swedish EXSITE (Explorative System Integrated Technologies) research program sponsored by TEKES (The National Technology Agency of Finland), VINNOVA (Swedish Agency for Innovation Systems), Nokia Oyj, Ericsson Radio Systems AB, and Spirea AB Kista. References [1] M. Sgroi, et al, "Addressing the System-on-a-Chip Interconnect Woes Through Communication-based Design", 38th Design Automation Conference, June, 2001. [2] Luca Benini, Giovanni De Micheli, "Network on Chips: A new SoC Paradigm", IEEE computer, Jan., 2002. [3] Shashi Kumar, et. al, "A Network on Chip Architecture and Design Methodology", IEEE Computer Society Annual Symposium on VLSI, Pittsburgh,Pennsylvania, USA, April 2002. [4] LBNL Network Simulator, http://www-nrg.ee.lbl.gov/ns/ [5] The network simulator - ns-2, available at http://www.isi.edu/nsnam/ns/ [6] Kevin Fall, Kannan Varadhan, "The ns Manual", the VINT Project, June 20, 2001. http://www.isi.edu/nsnam/ns/ns-documentation.html [7] Yi-Ran Sun, "Simulation and Performance Evaluation for Network on Chip", MSc. thesis, Department of Microelectronics and Information Technology, Royal Institute of Technology, Stockholm, Sweden, Dec., 2001.