evaluating and predicting Order-to-Delivery (OTD) sys- tems and processes. In order for more people to be able to access this simulator, to share the simulation ...
Proceedings of the 2002 Winter Simulation Conference E. Yücesan, C.-H. Chen, J. L. Snowdon, and J. M. Charnes, eds.
SIMULATION ANYWHERE ANY TIME: WEB-BASED SIMULATION IMPLEMENTATION FOR EVALUATING ORDER-TO-DELIVERY SYSTEMS AND PROCESSES
Jeffrey Tew Shang-Tae Yee
Soundar R.T. Kumara Yong-Han Lee Kaizhi Tang Chad Dodd
Enterprise Systems Laboratory GM Research and Development Center Warren, MI 48088, U.S.A.
Dept. of Industrial and Manufacturing Engineering The Pennsylvania State University 310 Leonhard Building University Park, PA 16802, U.S.A.
program. This program generates huge amount of simulation result to be analyzed, such as the individual vehicle’s status transition history. The simulation model and the governing algorithms were successfully validated using the implemented program and the sample simulation data sets. However, the OTD simulator was not widely used due to the following drawbacks: (a) lack of data management (the inputs and outputs are in the form of huge flat text files), (b) low usability of user interface (users have to edit the whole input text files using a text editor, and have no tools to analyze the huge output files), (c) lack of scalability (this is basically single user program), (d) lack of information sharing (simulation data sets can be managed by individual users in their local storage). The objective of this research and development reported is to enable the GM personnel to conduct the simulation study anywhere at any time through the Internet, and yet maintain simulation study models and results in a central database system for achieving higher level of information sharing among users. In order to enable simulating and analysis anywhere at any time via the Internet, our research problems are focused on:
ABSTRACT GM Enterprise Systems Laboratory (GMESL) has developed a stand-alone single user simulation program for evaluating and predicting Order-to-Delivery (OTD) systems and processes. In order for more people to be able to access this simulator, to share the simulation results, and to analyze simulation collaboratively, we have designed, developed and implemented an Internet-based three-tiered client/server framework, which consists of the three tiers: database, execution and user interface. The corresponding components are: database server, execution server, and web based user interface. The relational database server enables users to interact with the persistent data sets for simulation study and maintains data integrity. The multiagent based execution server guarantees stable user responsiveness by virtue of multi-agent’s flexible architecture, accordingly achieving a high level of processing scalability. Finally the web-based graphical user interface helps users to easily conduct the simulation study from anywhere at any time, and the visual simulation analysis tool helps users to make decisions effectively.
• 1
INTRODUCTION •
Due to the complexity of the modern supply chain networks, simulation studies often help support the decisionmaking processes in the supply chain management problems. Especially when analysts are interested in the dynamics of the system and the system performance for a given design, simulation-based supply chain analysis is the right approach (Simchi-Levi et. al. 2000). GM Enterprise System Laboratory (GMESL) has developed a discrete event driven simulation model for evaluating and predicting Order-to-Delivery (OTD) systems and processes, which is implemented in a single-user stand-alone C++
• •
Implementing the simulation study through the Internet Supporting multiple users with multiple simulation data sets (inputs) for each user Implementing graphical user interfaces for supporting simulation result analysis Achieving flexibility and scalability of the system
In the following two sections, we present overview of our approach and the system architecture. Then we mainly introduce the design of the centralized database, multiagent execution server and user interface in the subsequent sections, followed by the conclusion in section 7.
1251
Kumara, Lee, Tang, Dodd, Tew, and Yee 2
separate computational components – the relational database server, multi-agent based execution server, and webbased user interface respectively. The general three-tiered client/server model can be customized into various architectures thanks to the flexibility of placing the three functions (data management, analysis and presentation) on separate multiple machines. In our client/server architecture, not only the data management and analysis functions but also a large portion of the data presentation function are carried out on the server side in order to minimize the computation on the client side. This thin client approach enables the anywhere-anytime simulation. Figure 1 shows an overview of the physical system.
GENERAL APPROACH
Our approach is based on the current available information technology. We use web-based three-tiered client/server architecture as the framework of the system. The main server components are the relational database system and the multi-agent based virtual execution server. Our general approach can be summarized as follows: 1.
2.
3.
3
Internet based client/server architecture: We have employed the client/server paradigm (Askren 1996)(Stevens 1996) as the basic architecture. The client side is responsible for providing user interfaces, which helps the users to interact with the system through the Internet. The client-side functionalities include user registration, user login, job creation, job management, data entry for the simulation input data set and the result analysis. The server side holds all the data on users and simulation jobs including user profiles, job descriptions and simulation input and result data sets. The server side software needs to schedule the simulation orders, execute the simulation jobs, and save the simulation outputs in a database for further analysis. Relational database model: The relational database management system gives a compact and well-organized description of all the information that is used in the system and in that sense it is the backbone of the scalable simulation system. Logically, the information in the database is organized hierarchically into three layers: user information at the top, job information in the middle, and simulation information at the bottom layer. The system supports multiple users; a user possesses multiple jobs; and a job holds a set of simulation data. Thus, the relational database enables different users to conduct different simulations. Multi-agent based execution server: In order to achieve a high degree of user responsiveness and system scalability, we have built a multi-agent based execution server. The execution server consists of a broker agent and multiple execution agents. The broker agent is in charge of adaptive job dispatching among multiple execution agents, so that simultaneous multiple job requests can be scheduled and executed within a reasonable response time.
WWW Clients
Web Server Broker Data bases DBMS Executors Database Server
Virtual Executor Server
Figure 1: Three-Tiered Architecture There are three primary reasons for creating the threetiered client/server architecture in general. First, applications can be partitioned in a way that best fits the organizational computing needs. Second, in a three-tiered architecture, data analysis can reside on a powerful application server, resulting in substantially faster response times for users. Third, a three-tiered architecture provides greater flexibility by allowing the partitioning of applications in different ways for different users in order to optimize performance (Stevens 1996). Figure 2 shows how these three components of the information system are integrated through out the whole workflow – simulation job request, simulation execution, result analysis, and visualization of the analysis results. Users create the simulation input data sets and request the simulation job through the web interfaces. The input data set and the job information are stored in the central database. The Broker Agent (BA) in the execution server checks the new job arrival, maintains the job requests in the job queue, and dispatches the jobs to the Executive Agents (EAs) under her control. Each EA retrieves the simulation input data set from the central database, executes the GM OTD simulator, uploads the simulation outputs, and finally runs the batch analysis module. EAs keep reporting the job status to the BA whenever it changes, so
OVERALL SYSTEM ARCHITECTURE
As stated in section 2, the overall system architecture is a three-tiered client/server architecture, which separates the functions of data management, analysis and presentation (Hoffer 2002). These three functions are carried out by
1252
Kumara, Lee, Tang, Dodd, Tew, and Yee Virtual Execution Server
queue
DB / Web Server
Data Input / Job Request
Notice with Job Number
Job Status Browse
Job Status Update
Analysis Result Browse
agents status Job Allocation
WWW (Users)
DBs
Status Report
Input Data DB / Web server Executor Agent Output/Analysis Data
Broker Agent Web browser
Figure 2: Workflow Through Out the Three-Tiered Architecture 3.
that BA can update the job status in the central database and judiciously allocate new jobs to the EAs based on this information. Users can check the job status through the web browser and investigate the simulation analysis results, which are presented graphically. 4
4.
CENTRAL SIMULATION DATABASE
4.1 Requirement Analysis
In order to realize the objectives requested in the multi-tier architecture, the database acts as the intermediary between the client and the execution server. Figure 3 shows the roles of database system in our three-tiered architecture. The central database server manages different parts of information, these parts are respectively called: (1) user profile database, (2) simulation job database, (3) simulation input data set database, (4) simulation output database, and (5) analysis result database. From the point of view of functionalities, these five databases support the software blocks in the client and execution server sides in the following ways:
In the multi-tier client/server architecture, the design of a database system plays an important role in the overall performance of the system. The database system does not only provide the persistent workspace for the data entry driven by users, but also conducts data fusion between different tiers of the servers. In our development, the database system aims at the following objectives: 1.
2.
Enabling the monitoring of the system: Status of the system stored on the database can be displayed as requested by users. Providing the interfaces of the programs on the server side: Through the sharing of information in the database, the simulation program can obtain the inputs from the users and the batch analysis program can obtain the simulation results generated by the simulation program.
Providing a persistent storage for the simulation data: The database system does not only statically store the user profiles, simulation configurations, simulation results, and analysis results persistently on the server, but also dynamically keeps tracks of the parameter modifications of the simulation data set. This is a strong support for “simulating anywhere at any time”. Enabling web access in the client/server architecture: The effects of all users’ activities such as browsing, insertion, deletion and modification will be reflected instantly on the database server via the Internet.
1. 2.
3.
1253
User profile database: The user database is accessed by the user profile administration. Simulation job database: Users manage jobs through the job database, and the commands to control the jobs are submitted to and accessed by the execution server from the job database. Simulation input data set database: The simulation models and configurations are stored in the input data set database, and from the database, the execution server extract the whole set of information as the input of the simulation program.
Kumara, Lee, Tang, Dodd, Tew, and Yee User Profile Administration
Job Management
Insert, Update, Delete,
Simulation Modeling
Insert, Update, Delete, Copy, Query, Submit
Analysis Result Visualization
Client
Query, Visualization, Data mining
Insert, Update, Delete,
DB/Web Server User DB
Job DB
Input DB
Query Order Check
Output DB
Delete, Insert
Extract Schedule
Analysis DB
Create
Upload
Execute
Analysis
Write
Input files
Simulator
Output files Rea d
Execution Server
Figure 3: Database-Centered View of Three-Tiered Architecture 4.
5.
Simulation output database: The outputs of the simulation program are stored in the output database and the analysis program in the client side can access these results. Analysis result database: The execution server generates the preliminary analysis tables in order for the analysis program in the client side to conduct query, visualization or data mining.
4.2 Design Approach Design of a database system is a standard process and designers can reduce the redundancy of data by normalization. However, the work of design is an art when different requirements and restrictions are considered. In this section, we discuss four methods to translate the administration hierarchies, industrial objects, or the restrictions on the speed and storage into relational tables in a relational database system. These four methods are: (1) translate the entity-relationship model into the relational tables, (2) translate the hierarchical model into the relational tables, (3) translate the network model into the relational tables, and (4) fragment long tables into shorter tables horizontally. 1.
2.
Translate the entity-relationship model into the relational tables: The entity-relationship can be one-to-one, one-to-many and many-to-many. The first two relationships can be translated into rela-
3.
1254
tional tables directly, but the third relationship needs more work. Besides two tables representing the two entities in the many-to-many relationship, we need to define another table called bridge table, in which each record is a relationship in the many-to-many relationship. For example, in order to monitor the status of the execution agents, we need to have the information on which job is executed in which agent. In this case, their relationship is many-to-many and we need to define a table called simulation history as the bridge table between the table agent and job. Translate the hierarchical model into the relational tables: As discussed in section 1, the information in our database is organized into three hierarchies logically. We need to translate the hierarchical relationship into relationship tables. In a simple way, the sub-hierarchy tables take a foreign key from the parent-hierarchy so that the records in the sub-hierarchy can be divided by this foreign key. For example, if we set the customer identification as the primary key in the table customer (user) and the foreign key in the table job, then the hierarchical relationship between users and jobs is presented in the relational tables. Translate the network model into the relational tables: In the supply chain OTD simulation, the supply chain network is the basic configuration for
Kumara, Lee, Tang, Dodd, Tew, and Yee
4.
4.
the simulation task. We can use the same method to deal with the many-to-many entity-relationship. The example will be given in section 4.3. Fragment long tables into shorter tables horizontally: The output tables are usually very long because they record many details of the simulation history. The performance of querying, data mining and visualization on these tables is low and it is not handy to export these tables to other analysis software if we store the output results of all the jobs into the same table taking the job identification as the foreign key. Therefore, we fragment the long output tables into short ones by storing the output results belonging to a single job into individual tables. This is called fragmentation horizontally in the literature of database design. This horizontal fragmentation technique can easily extend the central database to distributed database in order to satisfy the requirements of high volumes of simulation data.
In the overall structure of relational tables (see Figure 4), the input tables and output tables are compressed. The translation of the output tables is straightforward, but part of the translation of the input tables is difficult. As introduced in section 4.2 about translating a network model into relational tables, we need to translate the many-to-many relationship into two one-to-many relationships. Figure 5 gives an example. There are three kinds of entities: system nodes (sysNodes), system links (sysLinks) and paths. A system link defines a relationship between a system node with another. A path defined with a starting system node and a destination system node can contain multiple system links and a system link can be related to multiple paths. Therefore, a system link is a bridge between two system nodes; a path is a bridge between two system nodes; a path link is the bridge between a path and a system link.
4.3 Implementation We applied the approaches in section 4.2 to design the relational tables in SQL server. Figure 4 shows the overall structure of the relational tables. There are accessory tables, input tables, output tables and monitoring tables, described as follows: 1.
2.
3.
Monitoring tables: These tables are used by an administrator to monitor the status of agents (broker and executors). In the table called simulation history, one entry is pointed to the table job and another entry is pointed to the table agent. So the configuration history between agents and jobs can be presented in this table.
5
MULTI-AGENT BASED EXECUTION SERVER
5.1 Requirement Analysis
Accessory tables: Two tables called customer and job are designed to enable multiple users to generate multiple simulation jobs. Input tables: These tables hold the user inputs, which describe the simulation models including product configurations, supply chain configuration network, demand profile and production schedule. Output tables: These tables hold the simulation outputs, which include simulation results for individual vehicles, simulation event records in a chronological order, production history, and details on each vehicle order (or demand).
Scalability is one of the most important design requirements identified in the analysis phase of this project. Scal3 1
4 sysNodes sysLinks paths
Accessory Tables Customer
Job
2
Output tables
1, 2, 3, 4 [1,2], [2,3], [2,4] [1][2] SysLinks: [1,2] [1][3] SysLinks: [1,2]! [2,3] [1][4] SysLinks: [1,2]! [2,4] [2][3] SysLinks: [2,3] [2][4] SysLinks: [2,4]
(a) Network Definition sysNode
Agent
Sim_history
Input Tables
path
Monitoring Tables
Figure 4: The Layout of Relational Tables in the Central Simulation Database (Solid arrow: one-to-many relationship; Dotted arrow: fragmentation horizontally)
pathLink
sysLink
(b) Relational Model (The head and tail of an arrow mark a primary key and foreign key, respectively)
1255
Figure 5. Transforming a Network Model to the Corresponding Relational Model
Kumara, Lee, Tang, Dodd, Tew, and Yee ability issues are difficult to be fully envisaged due to: (a) at the design stage we could hardly estimate the future demand for accessing the system, and more importantly, (b) the access request patterns will be very ‘uneven’, meaning that there might be a big variation between the peak and lowest access demands over time. We redefine the scalability of our client/server Internet system using the following two metrics: 1.
2.
Execution Server Broker
(*) Job Status Update Agents Status (2) Job Allocation
Scaling Flexibility: The system must be flexible enough to accommodate the future requirement for increasing processing capability. Guaranteed Responsiveness: The system must be able to guarantee a high level of responsiveness irrespective of the fluctuation of the service demand.
3.
Database
(4) Execution
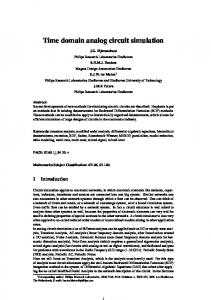
Figure 6: Workflow Among Agents and the Databases Simultaneous run Sequential run MAS (2 exec servers) MAS (3 exec servers)
average run time per job (sec)
1400
The platform serves as a run time environment, helping communication between agents. Hence the platform must be started first, and other agents could be started after this, by registering themselves with the platform. The broker agent is in charge of: (a) checking new simulation job orders, (b) monitoring EAs and job status, (c) allocating jobs to executor agents, and (d) updating the current status of agents and jobs in the central database. Each executor agent is in charge of executing individual simulation jobs. In order to accomplish this, an EA: (a) receives simulation job order from the BA, (b) carries out the multiple steps of simulation work, and (c) reports current status of agents and jobs to the BA.
1200 1000 800 600 400 200
1
2
3
# of simulation jobs requested
4
5
Figure 7: Effect of the Number of Executor Agents on the Average Response Time
2.
The workflow among the agents and the database server is shown in Figure 6. In the figure, the numbers within parentheses represent that the general sequence. The notation (*) represents this message passing is done asynchronously with other sequential processes. The advantages of using the multi-agent based virtual execution server architecture include: 1.
(3) Input Data
(5) Output/Analysis Data
On the basis of the requirements analysis we propose a multi-agent based execution server (called MASE) architecture. MASE consists of three software components: multi-agent platform, broker agent (BA), and multiple execution agents (EAs). The main roles of the three components are as follows:
2.
(*) Status Report
Executors
5.2 Design Approach
1.
DB Server (1) New Job(s)
queue
3.
Response Time: By using multiple processors (EAs) we can compress the response time. Figure 7 shows the effect of the number of executor agents on the average response time. As shown in
4.
1256
the graph, adding just a few execution agents reduces the response time drastically. Reliability: Another benefit of using multiple executor agents is its higher level of reliability. In effect, MASE system can be thought of as a single machine with multiple parallel processors doing the same job, meaning that the reliability of the whole system will be: R = 1 − (1 − R ) n , where S E n is the number of executor agents and R is the E reliability of each executor agent. Flexibility: By installing EAs on existing computers and registering them with the BA, we can easily increase the capability of the information system. The computers having the agent installed can still be used for other purposes while they serve as a part of execution server. Only when the BA decides to use the CPU time of the machine, the computer serves as an EA. Furthermore, installation of a new EA is easy. Cost: The EAs are small and light enough, so they can be installed virtually in every PC and work-
Kumara, Lee, Tang, Dodd, Tew, and Yee
5.
5.
station having Java Runtime Environment (JRE) and connected in the same LAN environment. Without purchasing powerful but expensive servers, the capability of the information system can easily be increased. Controllability: By using autonomous software agents, higher level of coordination is possible, especially for job scheduling and exception control.
5.3 Individual Agent Model Our design of the individual agents is according to the behavior-based model, where agents interact with each other reactively rather than deliberatively based on symbolic reasoning. As the best-known behavioral architecture, the subsumption architecture is explained by two defining characteristics: (a) an agent’s decisionmaking is realized by a set of task specific behaviors, and (b) multiple behaviors can be triggered simultaneously (Brooks 1986, 1991). This decision of adopting behaviorbased (reactive) architecture is realistic in the sense that the agent coordination mechanism including the definition of the role(s) and corresponding processes of each agent is well situated in our virtual execution server environment. In a single agent, each individual behavior receives incoming messages and sends outgoing messages independently. For minimum level of coordination between behaviors within an agent, internal messages are sent and received. The behavior’s role is governed by a finite state machine. The details on the behavior-based agent model can be found in Lee and Kumara (2000). A transition between states is fired by an incoming message and/or a completion of its sub-processes. The behaviors implemented in our system are as follows: 1.
2.
3.
4.
Executing Behavior: This EA behavior carries out the steps of a simulation job including: (1) retrieving the simulation input data and save them in a local directory as a set of text files, (2) running the GM OTD simulator, which takes the text files as the input and generates a set of output text files, (3) uploading the output text files to the database, (4) running a preliminary analysis (batch) program, which generates fundamental statistics of the simulation results, and (5) reporting the current status to the BA every time a step is completed.
5.4 Implementation The execution server is implemented in Java. The multiagent system is developed using JADE (Java Agent Development Environment) APIs, which is FIPA (Foundation of Intelligent Physical Agent) Agent Management Specification compliant. In order for agents to access to the database, JDBC-ODBC bridging method is applied. Details on this development environment can be found in CSELT (2001). The implemented agents (both BA and EA) are totally network transparent, so they can locate in any computers connected through a LAN. 6
USER INTERFACE: DATA ENTRY, RESULT ANALYSIS & VISUALIZATION
6.1 Requirements and Design Approach Convenient and integrated data manipulation is the objective of designing the user interface for the data entry, which requires a lot of manual operations by customers. Quick response and flexible visualization are the major requirements identified in designing simulation result analysis and presentation modules. In order to fulfill these requirements, we choose the following approaches:
Job Allocation Behavior: This BA behavior allocates the first job in the job queue to one of the available EAs, whose status is ‘IDLE’. Monitoring Behavior: This BA behavior monitors the status changes of executor agents. The possible status of an EA includes ‘UNAVAILABLE’, ‘IDLE’, ‘DBACCESS’, ‘SIMULATION’, ‘DBUPLOAD’, ‘ANALYSIS’, ‘WRAPUP’, ‘IDLE_LOCKED’ and ‘FAILED’. Order Checking Behavior: This BA behavior checks new job order(s) arrival from ‘JOB’ table in the central database. When BA finds new job(s) arrival, the internal job queue is updated by adding the new job(s) to it. Job Receiving Behavior: This EA behavior receives job requests from the BA. Because the BA allocates a job to an EA only when the EA is IDLE, the Executing Behavior of the EA is started immediately.
1.
2.
1257
Button and Hyperlink driven graphical interface with integration: Since we need to provide the full-fledged data entry functionality for a whole simulation data set, we need to integrate in one page all the possible connections between records belonging to different tables. We use the universal user interface and operations on all the input tables. When a customer is browsing the content of a table, it is possible for him/her to dig into the details of the associated tables via hyperlinks and of the un-associated tables via the universal buttons in the same page. Batch Analysis with Interactive Presentation: Due to the huge amount of the simulation data, analysis-on-request is not a good approach. We separate the time-consuming analysis as a batch process conducted by EAs. The result of analysis
Kumara, Lee, Tang, Dodd, Tew, and Yee
Simulation Output
Analysis
Analysis Output
User ‘s menu selection
Visualization
Call Servlet
Figure 8: Simulation Output Analysis / Visualization Approach
3.
Java Servlet print()
is stored in the database so that the interactive presentation can be possible using this preprocessed analysis data. Figure 8 shows our twostep approach. Graphics User Interface for Presentation: In order to support users’ comprehensive decision making, the analysis results are displayed in the form of graphs along with numeric values.
2.
The identified and implemented analysis and presentation items include:
2.
3.
4.
Time Series Analysis: This item visualizes the time series of number of vehicles (1) in sequencing (in other words, being planned to be produced), (2) in production inventory, (3) tagged, and (4) delivered. The time ranges that are viewed can also be altered from day, month, week, and year to a customized range. Frequency Analysis: This item visualizes the distributions (or frequencies) of the order-to-delivery times for each vehicle configuration. The frequencies are visualized using histograms. Statistical Analysis: This item lists out and visualizes some critical statistics including (1) average time durations between sequencing and production, between production and tagging, and between tagging and delivery, (2) counts of vehicles, which were ‘delivered’, ‘grounded’, ‘tagged’, and ‘waiting’ in each distribution center. Output Data Browse: This item view all the output tables of a specific simulation instance. The files are (1) production history, (2) simulation history, (3) vehicle, and (4) vehicle order.
3.
7
HTML with the code= tags calling Applets
Java Applets for drawing graphs
and then the Servlet passes the data as parameters to the Java Applet through printing the data in the html tags. Figure 9 shows how the graphs can be drawn on the top of web pages. Separating Content and Display: For the efficient maintenance of the web pages, separating content from display style is essential. We used Cascading Style Sheet (CSS), which is a set of style rules that tells a Web browser how to present a document. The CSS definition can be applied (or ‘glued’) to multiple html files, so that they can have exactly same style. (Hoffer 2002) Navigation Aids: By placing side bar for navigation, users can easily access to any destinations within 2 clicks.
CONCLUSION
We have designed and implemented a flexible and scalable information system framework with the ability for multiple simulation users concurrently to conduct multiple order-todelivery simulation studies. The implemented system was successfully demonstrated and delivered. Some of the major outputs of this research are: 1.
2.
6.3 Implementation The batch analysis module is written in Java. Following are our implementation approach for data entry and analysis result visualization. 1.
HTML with Applets
Figure 9: Drawing Graphs on the Web Pages: Java Servlets along with Applets
6.2 Analysis & Visualization Functions
1.
Display on the Web browser
3.
Drawing Graphs on the Web Pages: In order to show graphs through the web browsers, we used Java Servlet"HTML"Java Applet approach. The Java Servlet talks with the database system to extract the correct data as the request of a user,
1258
An Internet-based three-tiered client/server architecture, which consists of centralized simulation database server, multi-agent based virtual execution server, and web-based user interface on the client side. Web based user interfaces for user profile management, input data entry, job status browsing, and simulation results visualization (developed using Java Servlet and Java graphics programming which enables users to access the simulation analysis virtually anywhere using web browsers). A multi-agent based execution server to check the new job arrivals, schedule the jobs, execute the actual simulation, and update the database according to the simulation results. This approach maximizes the scalability of the information system by virtue of the flexibility offered by the multi-agent system model.
Kumara, Lee, Tang, Dodd, Tew, and Yee 4.
ing and complexity theory. His e-mail address is .
Fundamental simulation result analysis based on graphical user interfaces, which enable the users to extract valuable information for decision making from the simulation results.
YONG-HAN LEE is a Post Doctorial Research Fellow in the Laboratory of Intelligent Systems and Quality at the Pennsylvania State University. His interest is in distributed artificial intelligent, especially multiagent-based system modeling and market-based mechanism design. He is a member of AAAI, IIE, and INFORMS. His e-mail address is .
The design, development and implementation through this research make the GM ESL-developed order-todelivery simulator available to anybody at any place through web browsers. Simulation anywhere at any time is made possible through these research efforts. ACKNOWLEDGEMENTS
KAIZHI TANG is KAIZHI TANG is a Ph.D. candidate in the department of Industrial and Manufacturing Engineering at the Pennsylvania State University. His interests are in distributed artificial intelligence, especially multi-agent information system combined with game theory and machine learning applied in the area of the e-manufacturing and e-business. He is a member of IIE. His e-mail address is .
The authors wish to acknowledge the support of the GM ESL members including Drs. Krishnan and Takasaki of GM. The authors wish to thank GM for making this work possible through their research contract No. TCS82111. REFERENCES Askren, S. 1996. Building Mult-Tier Apps Is About To Get Easier, Client/Server Computing, April, pp.61-64. Brooks, R.A. (1986), A robust layered control system for a mobile robot, IEEE Journal of Robotics and Automation, Vol. 2, No. 1, pp.14-23. Brooks, R.A. 1991. Intelligence without reason, In proceedings of the Twelfth International Joint Conference on Artificial Intelligence (IJCAI-91), pp.569-595, Syndey, Australia. CSELT S.p.A 2001. Jade homepage, Available online via [accessed July 17, 2001] Hoffer, J. A., et al 2002. Modern Systems Analysis & Design – 3rd edition, Prentice Hall, Upper Saddle River, NJ. Lee, Y.-H. and Kumara, S.R.T 2000. Market-based collaborative control of distributed multiple product development projects, in Network Intelligent: Internetbased Manufacturing, Nina M. Berry Editor, Proceedings of SPIE Vol. 4208, pp.73-83. Simchi-Levi D., Kaminsky, P. and Simchi-Levi, E. 2000. Designing and Managing the Supply Chain – Concepts, Strategies, and Case Studies, Irwin McGrawHill. Stevens, L. 1996. Consider three-tier client/server, Datamation, February, pp.61-64.
CHAD DODD is an employee of General Electric Medical Systems, Waukesha, WI. He is specialized in the area of multi-agent based value chain implementation. He received his M.S. from the Pennsylvania State University in 2001. His e-mail address is . JEFFREY TEW is Group Manager of the e-Commerce and Supply Chain Analysis group in the Enterprise Systems Laboratory at General Motor's Research and Development Center in Warren, MI. He received his Ph.D. in industrial engineering from Purdue University in 1986. He is a member of Alpha Pi Mu, The Association for Computing Machinery, The American Statistical Association, The Institute of Industrial Engineers, The Institute for Mathematical Statistics, INFORMS, The Society of Computer Simulation, and Sigma Xi. His email address is . SHANG-TAE YEE is Research Engineer at the General Motor's Research and Development Center in Warren, Michigan in the US. He received his Ph.D. from the Pennsylvania State University in 1998. His research interests are in supply chain simulation modeling and esupply chain management. He is a member of INFORMS. His email address is .
AUTHOR BIOGRAPHIES SOUNDAR R.T. KUMARA is a Professor of Industrial and Manufacturing Engineering at the Pennsylvania State University. He also holds joint appointments with the department of Computer Science and Engineering, and School of Information Sciences and Technology. His interests are in sensor based monitoring, intelligent manufactur-
1259