The advantages of a geometric program are (1) that the prob- lem is convex and ... applying techniques from design of experiments and by parallelizing the simulations over the ..... tional Journal of Circuit Theory and Applications, vol. 23, pp.
Simulation-based Automatic Generation of Signomial and Posynomial Performance Models for Analog Integrated Circuit Sizing Walter Daems, Georges Gielen, Willy Sansen Katholieke Universiteit Leuven (Belgium), Department of Electrical Engineering, ESAT-MICAS
Abstract This paper presents a method to automatically generate posynomial response surface models for the performance parameters of analog integrated circuits. The posynomial models enable the use of efficient geometric programming techniques for circuit sizing and optimization. To avoid manual derivation of approximate symbolic equations and subsequent casting to posynomial format, techniques from design of experiments and response surface modeling in combination with SPICE simulations are used to generate signomial and posynomial models in an automatic way. Attention is paid to estimating the relative ‘goodness-of-fit’ of the generated models. Experimental results allow to assess both the quality of the generated models as well as the strengths and the limitations of the presented approach.
Keywords Analog Circuit Modeling, Posynomial and Signomial Response Surface Modeling, Geometric Programming, Design of Experiments
1
Introduction
Automatic sizing of transistor-level analog integrated circuits is currently one of the main research targets in the electronic design automation business. Time to market and limited engineering resources (which yield a higher return-on-investment on a higher design abstraction level) ask for the automation of this traditionally hand-crafted task. Analog circuit sizing can be decomposed into two subtasks: (1) one “investigates” the circuit’s behavior (knowledge acquisition) and (2) one adjusts the design parameters according to the obtained knowledge (knowledge use) [1]. The different solutions to the transistor-level sizing problem found in literature, can be subdivided into three main categories [2]. The distinction is based on the type of circuit knowledge acquisition employed: • knowledge-based sizing: the knowledge of an expert designer is captured and encoded as a design plan or a set of rules, which are then executed during sizing [3], [4]; • equation-based sizing: the circuit’s behavior is captured in a model that consists of a set of equations. These equations can be derived using automated or hand-crafted symbolic analysis [5], [6]; • simulation-based sizing: the circuit’s behavior is obtained by numerical SPICE simulations at the transistor level and sizing is performed using optimization techniques [7], [8]. All techniques have their pros and cons. Simulation-based methods have the full accuracy of SPICE as trusted by most designers, whereas symbolic equations can only be derived in manageable CPU times in simplified approximate format. On the other hand, simulation-based circuit optimization is awfully slow, even when parallelizing the process on a farm of workstations, whereas symbolic methods are much faster in execution time. Recently, it was demonstrated that the optimization of analog integrated circuits, like amplifiers, switched-capacitor filters, LC oscillators, etc., can be formulated as a geometric program [9], [10]. The circuits are characterized with symbolic equations that have to be cast in posynomial format. The advantages of a geometric program are (1) that the problem is convex and therefore has only one global optimum, (2) that this optimum is not correlated with the optimization’s starting point and (3)
that infeasible sets of constraints can be identified [11]. In addition the geometric program’s optimum can be found extremely efficiently, using interior point methods [12], even for relatively large problems. The sizing is so fast (seconds) that design space explorations and process corner analysis can be performed quite easily. The approach, however, also has a number of limitations today: 1) approximate symbolic equations that characterize the full circuit performance have to be derived. Despite the progress in computer-automated symbolic analysis techniques [6], these are still mainly limited to smallsignal characteristics, necessitating the manual derivation of large-signal and transient characteristics; 2) the equations have be to cast in posynomial format. Although [9] and [10] show that many circuit characteristics are posynomial, this is not the case for all characteristics! In this case, the equations have to be approximated by some posynomial model. This is a manual effort with difficult control on the approximation error. Up till now, no automatic posynomial recasting approach has been presented; 3) also the device models have to be approximated in posynomial format [9]. This introduces an extra error, especially for deep submicron CMOS processes. The results will differ from well established and accepted models like BSIM-3v3, used and trusted by designers today. This paper presents an approach to overcome these limitations. Our approach automatically generates signomial and posynomial models for all circuit characteristics based on numerical SPICE simulations using accurate device models. It keeps the simulation time to a strict minimum by applying techniques from design of experiments and by parallelizing the simulations over the available computing equipment. It also optimizes the use of computing resources by applying a simple but effective loadbalancing technique. The strong points of the approach are therefore: 1) no a-priori generation of simplified equations needed: the models are built from SPICE simulations, 2) not only posynomial but more general signomial circuit characteristics and device models are allowed, 3) the full accuracy of SPICE simulations and established device models, such as BSIM-3v3 or MM9, is used to generate the models. The paper is organized as follows. In section 2 we will discuss performance modeling in general and set out some cornerstones used in our approach. Section 3 describes the fundamentals of our posynomial modeling technique. The modeling algorithm has been implemented in a software prototype that will be highlighted in section 4. Section 5 provides experimental results obtained with the prototype. Finally, conclusions will be drawn in section 6.
2 Performance modeling Consider a system S transforming an input signal E into an output signal Y (Fig. 1-(a)). The mathematical modeling of this input-output relationship is called behavioral modeling. Fig. 1-(b) depicts the same system seen from a designer’s point of view: a number of design parameters (X) cause the system to exhibit a particular performance (P ). The modeling of this relationship is called performance modeling. This paper concentrates on the latter.
2.1 Black-box fitting techniques In general, a mathematical model is assumed, and the parameters of the model are fitted, so that the model corresponds as closely as possible to
E
S
Y
X
(a)
S
Design of Experiments
P
(b) Simulation−based
Figure 1. Electronic system seen (a) as a system that relates an input signal
Performance Calculation
E to an output signal Y and (b) as a system for which a set of design parameters X have to be chosen to obtain a specified performance P
Second−order Polynomial Regression
simulated or measured data of the real system. Standard mathematical fitting techniques like interpolation or least-squares regression, go back several centuries and are well known. However, the use of these techniques in analog integrated circuit design has always been rather limited. The advantage of black-box modeling is obvious: no intrinsic system knowledge is needed in the fitting process. The model is built from inputoutput responses only, hence the name “black-box” fitting. The opposite is true for the model selection: selecting a model that is suited to capture all important effects is a hard task. Understanding the nature of the system is very beneficial in that case. We will assume a quite general model that however satisfies desired mathematical properties. Notice also that in general such models have a trade-off between generality and accuracy for a given model complexity. This means that a model that has to be valid over a large range of design parameters X typically has a larger fit error for the performances P than a model that only has to be valid for a small range of X.
2.2
Design of Experiments
Techniques from design of experiments provide a mathematical basis to select a limited but “optimal” set of sample points needed to fit a blackbox model [13]. Design of experiments considers the fitting process as an estimation of model parameters. E.g. sampling schemes can be composed that guarantee uncorrelated model parameter estimation to a certain degree for a specific model. Well-known and often-used sampling schemes range from full- and fractional factorial design, over Placket-Burman and Taguchi schemes, to Latin hypercube and even random design. The choice and the literature is vast. A very interesting sampling scheme, however, are orthogonal arrays, more specifically level-2 orthogonal arrays of strength 3 [14]. This scheme places the sampling points on the edges of a fitting hypercube of size (2dx)n around a center point X ∗ . The 4-dimensional level-2 orthogonal array of strength three around 0 illustrates this: −dx −dx −dx −dx dx dx dx dx
−dx −dx dx dx −dx −dx dx dx
−dx dx −dx dx −dx dx −dx dx
−dx dx dx −dx dx −dx −dx dx
Usually the center point is provided as well. Orthogonal arrays of strength 3 allow the uncorrelated estimation of linear, quadratic and interaction terms of a second-order polynomial phenomenon. This is a very beneficial property when fitting local models of a more general system. The combination of design of experiments with a standard fitting technique often is called response surface modeling (RSM) [15]. This technique (using orthogonal arrays) will allow us in this paper to efficiently generate models that have a specific desired format.
2.3
Geometric programming basics
Let X = (x1 , x2 , x3 , . . . , xn )T be a vector of real, positive variables. A function f is called signomial if it has the form ! n m X Y α � f (X) = ci xj ij (1) i=1
j=1
with ci ∈ R and αij ∈ R. If we restrict all ci to be positive (ci ∈ R+ ), then the function f is called posynomial. If in addition m = 1, then the function f is called monomial. If all exponents αij are integer, then the signomial becomes a polynomial. Our modeling approach will generate
Polynomial to Posynomial Conversion Model Quality Estimation
Figure 2. Posynomial model generation flow signomial and posynomial models. The latter allow to formulate analog circuit sizing as a geometric program. A (primal) geometric program is the constrained optimization problem: minimize f0 (X) with the constraints: fi (X) gj (X) xk
≤ = ≥
1, 1, 0,
(2) i = 1, . . . , p j = 1, . . . , q k = 1, . . . , n
(3)
with all fi (X) posynomial and all gj (X) monomial. By substituting all variables xi by zk = log (xk ) and taking the logarithm of the objective function and every constraint, it can readily be seen that the transformed problem is a convex optimization problem. Hence, it has only one global optimum. In addition this optimum can very efficiently be found using interior point methods [12]. Notice that if any fi or gj contains a negative constant term (which makes them theoretically speaking non–posynomial), the nature of the geometric program is not harmed. Indeed, the constant term can easily be eliminated from the left-hand side of the constraints. Since shifting the goal function by a constant amount does not influence the location of the optimum in terms of xk , the same statement holds here as well.
3 Generation of posynomial models The posynomial performance models (needed for the geometric programming formulation) can be derived using symbolic circuit analysis. In [9] and [10] this hand-crafted process is demonstrated. This is however a non–systematic, tedious process. As far as we know, automated posynomial model generators have not yet been reported in literature. We will present such an approach here. Fig. 2 illustrates the adopted procedure. Based on the results of a well-designed set of simulation experiments, we will fit a second-order polynomial (which at the same time is a kind of signomial). Next, this model will automatically be converted into a posynomial model. Finally the quality of this model is estimated. The next sections will focus on the signomial regression, the posynomial conversion and the quality estimation.
3.1 Second-order polynomial regression Consider a set of a experiments Xj , j = 1 . . . a that correspond to a set of a performances pj , j = 1 . . . a. A model M (X, c1 , c2 , . . . cm ), linear w.r.t. m fit parameters cm , needs to be fitted such that the distance between the system’s performance and the performance of the model is minimal. Several distance measures can be used for fitting the model parameters. A commonly used measure is the sum of the square performance deviations over all sample points, leading to the well-known least squares regression. The least squares fitting of a signomial function f (X) m X f (X) = ci ti (4) with ti =
Qn
i=1 il xα l , can be formulated as a minimization problem: "m #2 ! a X X minimize Ψ = (5) (ci ti,j ) − pj
l=1
j=1
i=1
t i (0,0)
with ti,j the actual value of ti for experiment j. This corresponds to the minimization of a positive-definite general quadratic form:
t i,i (0,0)
xi*
x
i
1 T (6) C AC 2 with B = ∇Ψ and A represents the Hessian of Ψ. Usually this problem is solved by solving AC = −B which in our case corresponds to solving:
i
Ψ = Ψ(0) + C T B +
TTt = P
2IDS,in VGST,in Cdom
and
SR =
Ibias Cdom
(8)
i=1
i=1 j=i+1
di + bi xi
(10)
di and bi are chosen such that the function value and the first derivative are maintained, i.e.: di bi
= =
2 −ci (x∗i ) 2 ci x∗i
(11) (12)
• negative interaction terms: ci,j xi xj ≈
di,j xj + bi,j xj xi
(13)
di,j and bi,j are chosen such that the function value and the first derivative are maintained, i.e.: di,j bi,j
= =
xi
xj
−ci,j (x∗i ) 2 ci,j x∗i
2
(c)
Figure 3. Posynomial approximation of (a) negative linear terms, (b) negative quadratic terms and (c) negative interaction terms. The original terms are plotted in solid lines, the approximate posynomials in dotted lines.
Of course the role of xi and xj can be interchanged here. The choice is made based upon which approximation harms the posynomiality of the linear term least (i.e. changing the sign of ci or cj ). If both choices destroy the posynomiality of the linear term or both linear terms are already non– posynomial, then we substitute the largest variable. If one of the linear terms is still posynomial and we can keep it that way by replacing the other term, then we do so. Otherwise we replace the posynomial term. This procedure guarantees the best possible approximation. • negative quadratic terms: di,i ci,i x2i ≈ + bi,i (16) xi di,i and bi,i are chosen such that the function value and the first derivative are maintained, i.e.: bi,i
= =
−2 ci,i (x∗i )
2 3 ci,i (x∗i )
3
(17) (18)
Fig. 3 illustrates these approximations. It is clear that these approximations make a model that favors a good fit at the center point X ∗ . However, when used during circuit sizing, this center point will move and the model will be updated adaptively [10], [11]. Applying the above approximations in reverse order removes any signomial term from the model, except for the constant term which most likely becomes negative. This poses no problem since when appearing in any geometric program, this constant term can easily be eliminated. The computational complexity of the above procedure is O(n2 ).
3.2 Model quality assessment
The terms that have a positive coefficient ci or cij are monomial terms. The terms that have a negative coefficient can be approximated around a center point X ∗ by posynomial approximations as follows: • negative linear terms: ci xi ≈
(b) x*i
di,i
When logarithmically scaling the performance space as well as the design space, these parameters become fully linearly signomial. It should be noted also that the number of fit parameters in a generic n-dimensional k-th order polynomial model is O(nk ). This in general hinders the use of higher-order models. We will now explain how the signomial model is converted in an approximate posynomial model, so that it becomes useful for geometric programming. Consider the generic n-dimensional second-order polynomial model: n n n n X X X � X f (X) = c0 + ci,i x2i + (ci xi ) + (ci,j xi xj ) (9) i=1
ti,j (0,0,0) (a)
(7)
Considering that TTt is symmetric, one might be tempted to solve (7) straight away using e.g. a Cholesky decomposition. However, the condition number of TTt is approximately equal to the square of the condition number of T. This results in an ill-conditioned solution of (7), especially when adopting asymmetrical sampling schemes or sampling schemes that are not close to the unity matrix. Since for both signomial and posynomial models the requirement xi ≥ 0, ∀i holds, our sampling scheme becomes most asymmetrical. If we restrict ourselves to second-order polynomial models, we can easily overcome this burden by first applying an axis translation that makes the sampling symmetrical, then solving (7) and finally restoring the original axes. This procedure leaves the second-order polynomial nature of the model intact. Restricting ourselves to a second-order polynomial model has another advantage: we can convert it without too great difficulty to an approximate posynomial model. Besides, it does not put a severe hold on the quality of the resulting models. The reason for this is the fact that a lot of performance parameters for integrated circuits are very near to simple sums and additions of design parameters if the latter are well chosen and proper scaling is applied. E.g. consider the following approximate expressions for some performance parameters of CMOS operational amplifiers: GBW =
xi*
x
(14) (15)
As model quality parameter we took the root mean square deviation in the existing sampling points as starting point. We normalized this quality figure by dividing it by the performance range of the sample points, leading to a relative quality figure q for model M : qP a j=1 (M (Xj ) − pj ) �� q= � (19) a c + maxaj=1 pj − minaj=1 pj with c a constant to avoid error overestimation when the performance range approaches zero. This figure is: 1) computationally cheap (no extra simulations are needed), 2) easy to assess: a quality larger than 1 suggests a bad fit1 . In addition it must be said that this figure is rather a pessimistic measure for the posynomial model approximation. Indeed: the use of orthogonal arrays to position the samples within the fitting hypercube, results in a sampling points — except for the center point — located at the extremes of the fitting hypercube, where the approximation error is largest. Remember that the approximation was conceived such as to minimize the modeling error in the center point. 1
Notice that the fitting technique itself might not always be the cause, also the fitting capabilities of the model for the given circuit at hand are involved.
nvdd Analysis Server
Analysis Server
Analysis Server
M5a Analysis Client
Analysis Client
Analysis Client
Analysis Client
M6
n4a Design of Experiments Engine
PRiSM
Quality Control Engine
M4a
Signomial Modeling Engine
In order to have a more realistic quality assessment for these models, we introduce two extra relative quality figures: 1) the relative deviation in the center point, which we will label qoc 2) the quality figure of (19) evaluated in sampling points located in the interior of the fitting hypercube, which we will label qtc 2 A drawback of the latter is the need for extra analyses (i.e. circuit simulations). Notice that for the generated posynomial models q can be considered as the worst-case value (we therefore give it an extra subscript: qwc ), qtc as the typical-case value and qoc as the optimal-case value.
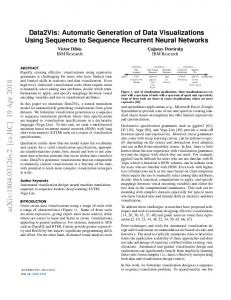
Modeling prototype
The signomial and posynomial fitting techniques have been implemented N in PR I SM, our Posynomial Response Surface Modeling prototype. Fig. 4 N shows the overall concept of PR I SM. The core engines have been coded using C++, while the analysis clients and servers have been coded in Perl. The total amounts to about 40 000 lines of code. In the design a number of extra design principles were taken into account, based on need observations within our analog integrated circuit design group. The principles are: • Resource parallelization • Load balancing • Analysis abstraction N PR I SM’s TCP-based client-server simulation system schedules simulation and extraction jobs on remote workstations over the intra-net or the Internet (resource parallelization). Upon completion the duration of each analysis-extraction job is preserved in a server-load database. During the generation of a model (which typically requires hundreds of simulations) the average analysis-extraction duration for a server is taken as its average load. At regular times this load information adjusts the client-server job scheduling plan (load balancing). SPICE simulations are performed using a standard simulation tool chosen according to the availability or preference. At this moment interfaces to E LDO and Berkeley SPICE 3f4 3 are provided. At the client side an abstraction layer totally hides the specific nature of these simulation tools, N allowing easy migration of PR I SM to a new simulator environment.
Experimental results
As test case we used the circuit of Fig. 5, a high-speed CMOS OTA which we want to model using a 0.7µm CMOS technology from Alcatel Microelectronics. The supply voltage is 5V. The nominal threshold voltages of this technology are 0.76V for NMOS-devices and −0.75V for PMOSdevices. The circuit has to drive a load capacitance of 10pF. Thirteen independent design variables were retained as inputs for the models. In Table I an overview of the chosen variables and their bounds is given. Note that currents and transistor drive voltages are chosen as variables, rather than transistor widths, since we use an operating-point driven formulation for analog circuit sizing [16]. The bounded range of variables vi ∈ [lb i , ub] is logarithmically scaled onto xi ∈ [0, 1] using � � �v � lb i xi = log log (20) lb ub 2
For the experimental results we also used an orthogonal array hypercube with a size 1/3 of the original size. 3 For this purpose we integrated the BSIM-3v3 model into Berkeley SPICE 3f4.
n4b M7
M4b
n1
nvb3 nin_p
nvb2
Figure 4. Overall concept of PR I SM
5
n5
Posynomial Modeling Engine
N
4
M5b
Analysis Client
nin_m
M1a M1b
nout
nvb1 M2a
M2b
VSS
VSS
n2a
n2b n3
M3a
M3b
nvss
Figure 5. Schematic of a high-speed CMOS OTA i 1 3 5 7 9 11 13
vi
lb
ub
vGS ,M1 vDS ,M2 vGS ,M4 vDS ,M5 iD ,M1 iB1 iB3
-0.75V 0.1V -0.75V -0.1V -10uA 1uA 1uA
-4V 4V -4V -4V -10mA 100uA 100uA
i 2 4 6 8 10 12
vi
lb
ub
vGS ,M2 vGS ,M3 vGS ,M5 vDS ,M6 iD ,M2 iB2
0.75V -0.75V -0.75V -0.1V 10uA 1uA
4V -4V -4V -4V 10mA 100uA
Table I. Design variables chosen as model inputs
Six parameters of the OTA will be modeled: • the low-frequency gain (ALF ), the unity-gain frequency (fu ) and the phase margin PM , whose actual values will be determined from an AC simulation, • the offset at the input (voff ) determined from a DC sweep analysis, • the positive slew rate and negative slew rate (SR p , SR n ) that will be extracted from a transient simulation. For all six model parameters, two models are generated around the center point xi = 0.5, ∀i: a second-order polynomial (signomial) model (SM), and a posynomial model with integer exponents -1, 0, 1, 2 containing level-2 interactions (PM). The nominal performance in the center point can be found in table II. In advance all performances pi are scaled either linearly (ALF , PM , voff , SR p , SR n ), according to: pi,lin = ±
1 (pi − pi,typ ) 1 + |pi,typ |
(21)
with pi,typ a typical value of the parameter (e.g. the target specification), or scaled logarithmically (fu ), according to: � � pi 1 pi,log = ± (22) log 1 + log (pi,typ ) pi,typ The plus sign in (21) and (22) is chosen if a model for minimization of the parameter is required, the minus sign if a model for maximization is required. Each model is generated twice keeping the same center point for different relative sizes (dx = 0.1, 0.01) of the fitting hypercube. The fitting was carried out using an orthogonal array of strength 3 of dimension 243 × 13, i.e. 243 experiments each requiring three SPICE simulations were carried out to obtain the experimental data. For the case where dx = 0.1 for some experiments the DC-solution proved to be not physical or the simulations did not converge. These experiments were retained from the fit process. This of course ruins the desired orthogonality properties of the orthogonal arrays we use. However, as mentioned before, these properties only become relevant as soon as the relative size of the fitting hypercube becomes small. ALF voff
36.45 dB 2.646 uV
fu SR p
6.761 MHz 21.7 V/us
PM SR n
90.28o -26.2 V/us
Table II. Performance of the CMOS OTA for xi = 0.5, ∀i
Low−frequency Gain Model Coefficients
sizes. The anomaly of the PM -model for dx = 0.01 is due to numerical instabilities4 during fit and approximation calculations.
(X = [0.5, 0.5, ..., 0.5], dX = [0.1, 0.1, ..., 0.1])
6 Conclusions
Linear Terms
Quadratic Terms
Interaction Terms
Positive Coefficient
Constant Term
Negative Coefficient
Figure 6. Graphical representation of the model coefficients of the (signomial) model for ALF for the case dx = 0.1. param
σ
q
0.13153e-1 0.59763e-3 0.30017e-2 0.31287e-5 0.53327e-1 0.45433e-1
1.404 % 0.471 % 1.859 % 1.549 % 4.788 % 2.270 %
range
References
dx = 0.1 ALF fu PM voff SR p SRn
0.93662 0.12683 0.16144 0.10203e-3 1.11368 2.00118
ALF fu PM voff SR p SRn
0.10409 0.14651e-1 0.84243e-2 5.18427e-6 0.12833 0.17249
This paper has presented a technique to automatically generate posynomial performance models from full-accuracy SPICE simulations. Both signomial and posynomial models can be generated. The latter can be employed in automatic circuit sizing using highly efficient interior-point geometric programming algorithms. Our approach reduces the time and the effort needed to generate posynomial models to a strict minimum. The results are promising, but indicate room for improvement a.o. concerning numerical stability and the fitting of more specific (non–polynomial) posynomial models that might enable further reduction of the fit error for large hypercube sizes.
[1] [2]
dx = 0.01 0.25744e-3 0.73839e-5 0.49900e-3 6.25512e-7 0.25624e-2 0.48414e-2
[3]
0.247 % 0.504 % 5.924 % 0.595 % 1.997 % 2.807 %
[4] [5]
Table III. Properties of the signomial models (SM) N
PR I SM was run on an Intel Celeron 466MHz running Linux. The analysis servers ran on 17 UNIX workstations, ranging from a SUN Ultra Sparc I (with a SPECfp95 of 9) to an HP B-1000 (with a SPECfp95 of 42) using their native OS. It took approximately 3 min. to generate all signomial models. The posynomial approximation took another 10 sec. Fig. 6 illustrates the model coefficients of the signomial model for ALF for the case dx = 0.1. It can be seen that in general an unconstrainedfitted model is not posynomial since many negative coefficients occur. Table III shows the results for the origally fitted signomial models, whereas table IV shows the results for the derived posynomial models. The range, the standard deviation in the fit points (σ) and the quality figure(s) have been given for every modeled parameter. We let c = 0.001 (see (19)) which is a realistic value in view of (21) and (22). The parameter c only has significant influence for the offset model. The reason for this is that the operating-point driven formulation makes the offset negligible “by construction”. This also explains why the nominal value for the offset (see Table II) is so low. Several conclusions are to be drawn from these results: • the signomial fits are in general quite good. • the posynomial approximated models are useful for limited hypercube param
range
σ
qwc
qtc
[6] [7]
[8]
[9] [10] [11] [12] [13]
qoc
[14]
52.329 % 890.198 % 617.059 % 4.372 % 139.408 % 48.227 %
-1.123 % 1.366 % 1.061 % -0.981 % -14.669 % 0.275 %
[15]
0.760 % 0.835 % 559.083 % 1.871 % 45.924 % 23.814 %
-0.365 % 0.070 % 32.224 % -0.797 % -2.862 % -0.081 %
dx = 0.1 ALF fu PM voff SRp SRn
0.93662 0.12683 0.16144 0.10203e-3 1.11368 2.00118
0.53034e+1 0.11825e+2 0.10254e+2 0.77042e-4 0.18157e+2 0.10335e+2
ALF fu PM (*) voff SRp SRn
0.10409 0.14651e-1 0.84243e-2 5.18427e-6 0.12833 0.17249
0.75125e-2 0.10013e-2 0.51649 0.98512e-5 0.60875 0.36425
566.228 % 9324.387 % 6351.869 % 38.135 % 1630.345 % 516.463 %
[16]
L. R. Carley, G. Gielen, R. A. Rutenbar, and W. Sansen, “Synthesis tools for mixed-signal ics: Progress on frontend and backend strategies,” in Proc. Design Automation Conference, June 1996, pp. 298–303. G. Gielen and R. A. Rutenbar, “Computer-aided design of analog and mixedsignal integrated circuits,” Proc. of the IEEE, vol. 88, no. 12, pp. 1825–1852, Dec. 2000. G. R. Degrauwe, “IDAC: an interactive design tool for analog cmos circuits,” IEEE Journal of Solid-State Circuits, vol. 22, no. 6, pp. 1106–1116, Dec. 1987. F. M. El-Turky and E. Perry, “BLADES: an artificial intelligence approach to analog circuit design,” IEEE Trans. on Computer-Aided Design of Integrated Circuits and Systems, vol. 8, no. 6, pp. 680–691, June 1989. G. Gielen, G. Debyser, K. Lampaert, F. Leyn, K. Swings, G. Van der Plas, W. Sansen, D. Leenaerts, P. Veselinovic, and W. van Bokhoven, “An analogue module generator for mixed analogue/digital asic design,” International Journal of Circuit Theory and Applications, vol. 23, pp. 269–283, 1995. F. V. Fern´andez-Fernand´ez, A. Rodr´ıguez-V´azquez, J. L. Huertas, and G. Gielen, Symbolic analysis techniques – Applications to Analog Design Automation, IEEE Press, 1998. F. Medeiro, F. V. Fern´andez-Fernand´ez, R. Dom´ınguez-Castro, and A. Rodr´ıguez-V´azquez, “A statistical optimization-based approach for automated sizing of analog cells,” in Proc. Design Automation Conference, 1994, pp. 594–597. R. Phelps, M. Krasnicki, R. A. Rutenbar, L. R. Carley, and J. R. Hellums, “Anaconda: simulation-based synthesis of analog circuits via stochastic patter search,” IEEE Trans. on Computer-Aided Design of Integrated Circuits and Systems, vol. 19, pp. 703–717, 2000. M. Hershenson, S. P. Boyd, and T. H. Lee, “Optimal design of a CMOS opamp via geometric programming,” IEEE Trans. on Computer-Aided Design of Integrated Circuits and Systems, vol. 20, no. 1, pp. 1–21, Jan. 2001. P. Mandal and V. Visvanathan, “CMOS op-amp sizing using a geometric programming formulation,” IEEE Trans. on Computer-Aided Design of Integrated Circuits and Systems, vol. 20, no. 1, pp. 22–38, Jan. 2001. R. J. Duffin, C. Zener, and E. L. Peterson, Geometric programming: theory and application, John Wiley & Sons, New York, 1967. K. O. Kortanek, X. Xu, and Y. Ye, “An infeasible interior-point algorithm for solving primal and dual geometric programs,” Math. Programming, vol. 76, pp. 155–181, 1996. George E. P. Box, W. G. Hunter, and J. S. Hunter, Statistics for experimenters: an introduction to design, analysis and model building, John Wiley & Sons, New York, 1978. A. S. Hedayat, Sloane N. J. A., and J. Stufken, Orthogonal arrays: theory and applications, Springer-Verlag, New York, 1999. George E. P. Box and N. R. Draper, Empirical Model Building and Response Surfaces, John Wiley & Sons, New York, 1987. F. Leyn, G. Gielen, and W. Sansen, “An efficient dc root solving algoritm with guaranteed convergence for analog integrated cmos circuits,” in Proc. IEEE/ACM International Conference on Computer Aided Design, Nov. 1998, pp. 304–307.
dx = 0.01 7.217 % 6.834 % 6131.264 % 9.451 % 474.354 % 211.172 %
Table IV. Properties of the posynomial models (PM)
4
Increasing the accuracy of the computations results in quality figures comparable to those for the other models.