Hindawi Publishing Corporation Journal of Quality and Reliability Engineering Volume 2014, Article ID 203427, 18 pages http://dx.doi.org/10.1155/2014/203427
Research Article Simulation-Based Fuzzy Logic Approach to Assessing the Effect of Project Quality Management on Construction Performance Gilberto A. Corona-Suárez,1 Simaan M. AbouRizk,2 and Stanislav Karapetrovic3 1
Facultad de Ingenier´ıa, Universidad Aut´onoma de Yucat´an, Apartado Postal 150 Cordemex, 97111 M´erida, YUC, Mexico Department of Civil and Environmental Engineering, Hole School of Construction Engineering, 3-014 Markin/CNRL, NREF, University of Alberta, Edmonton, AB, Canada T6G 2W2 3 Department of Mechanical Engineering, University of Alberta, Edmonton, AB, Canada 2
Correspondence should be addressed to Simaan M. AbouRizk;
[email protected] Received 25 October 2013; Revised 3 April 2014; Accepted 8 April 2014; Published 7 May 2014 Academic Editor: Adiel Teixeira de Almeida Copyright © 2014 Gilberto A. Corona-Su´arez et al. This is an open access article distributed under the Creative Commons Attribution License, which permits unrestricted use, distribution, and reproduction in any medium, provided the original work is properly cited. This paper reports the development of an approach to integrate the appropriate modeling techniques for estimating the effect of project quality management (PQM) on construction performance. This modeling approach features a causal structure that depicts the interaction among the PQM factors affecting quality performance in a given construction operation. In addition, it makes use of fuzzy sets and fuzzy logic in order to incorporate the subjectivity and uncertainty implicit in the performance assessment of these PQM factors to discrete-event simulation models. The outcome is a simulation approach that allows experimenting with different performance levels of the PQM practices implemented in a construction project and obtaining the corresponding productivity estimates of the construction operations. These estimates are intended to facilitate the decision making regarding the improvement of a PQM system implemented in a construction project. A case study is used to demonstrate the usefulness of the proposed simulation approach for evaluating diverse performance improvement alternatives for a PQM system.
1. Introduction Discrete-event simulation has been proven to be an effective technique to deal with the uncertainty involved in the planning of construction projects [1]; project planning processes, such as scheduling [1–4], cost estimating [5, 6], risk management [7], safety management [8, 9], lean construction analysis [10–13], constructability review [14], construction logistics analysis [15–17], contractor selection [18], and productivity estimation [19–21], among other efforts, have been addressed using this technique. Moreover, several simulation models have been proposed to estimate and improve the productivity of construction operations such as pile construction [19, 22], steel fabrication [21, 23], drainage maintenance [10], pavement construction [24, 25], pipe fabrication [13, 14], pipeline construction [26], bridge construction [27, 28], concrete production [29], high-rise structural work [30], construction of concrete structures [31], and tunnel construction [32–34], among several others. Although all
these models have included the effect of a number of factors affecting the productivity of these construction operations— such as weather conditions, labor experience, contractor experience, equipment condition, site conditions, and several others—they have had limited consideration of, or even overlooked, the effect of quality performance. The reason for this may be that quality performance greatly depends on the performance of organizations’ management [35–37] and the complexity of management processes should get involved in the construction of simulation models attempting to incorporate such effect [38]. If that is the case, it is necessary to highlight the role of quality management at the project level on attaining quality in construction operations [36]. Therefore, project quality management (PQM) practices deserve special attention when assessing quality performance in construction projects and should be considered in simulation models with the capacity to analyze the effect of quality performance on construction operations. Nevertheless, since discrete-event simulation is a quantitative
2 data-intensive technique, such simulation models would require developing productivity models that include the effect of PQM practices. Productivity models use historical data to analyze the factors influencing the productivity of construction operations and to estimate the effect of such factors on the productivity ([39], as quoted by [21]). In this case, there is a challenge: objective data regarding the effect of PQM on construction productivity, which can be used for productivity modeling purposes, are usually very limited or nonexistent in construction organizations [40]. For instance, when productivity measures are available, they can only be used to compute the contractor’s average past performance, which serves only as a broad guideline for estimating purposes [21]. A significant amount of uncertainty gets involved and makes it difficult to assess the relationship between the PQM performance and construction productivity. In addition, the subjectivity of the variables involved in the evaluation of such relationship represents another difficulty. For example, project managers find the assessment of the quality performance easier using qualitative terms such as poor, average, or good. Furthermore, the decision makers may not have any mathematical tools available to evaluate the combined effect of the PQM initiatives on the performance goals of construction operations. This argument draws attention to the need for a system that supports decision making with knowledge-based assessments rather than with explicit information. Therefore, this paper reports the development of a simulation modeling approach to integrate the appropriate techniques for estimating the effect of PQM on construction performance. This approach should facilitate the evaluation of the PQM practices implemented in construction projects and support the decision making regarding the improvement of construction quality performance.
2. Modeling the Effect of PQM on Productivity The effect of quality on productivity has been empirically verified in service [41], manufacturing [42], and even construction processes [43]. Actually, since long time ago, Deming’s philosophy emphasized the significance of quality on the performance of processes and especially on the productivity: as quality improves, productivity increases due to a reduced amount of rework, fewer mistakes, fewer delays, and better use of project requirements ([44], as quoted by [41, 45]). Since the endeavor reported in this paper focuses on the construction operational level, Deming’s thinking gives meaning to the convention of using, for the purposes of this modeling approach, interruptions, low productivity periods, and reworks (i.e., disruptions) for measuring quality performance and representing the effect of PQM on the productivity of construction activities. This is also consistent with the results oriented approach to quality performance that prevails in construction, in which quality is expected to be perceived in construction operations and outputs; for instance, an increase in productivity is expected when quality performance improvements are accomplished [46]. Moreover, though several authors have empirically determined the significance of the effect of quality management practices on quality performance [47–51], other ones have
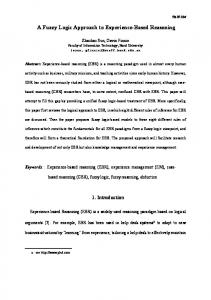
Journal of Quality and Reliability Engineering reasoned on the indirect path through which such effect is accomplished [43, 46, 52, 53]. The approach reported in this paper follows the reasoning mechanism proposed by Battikha [53] to identify and analyze the root causes of nonconformities. In this case, parting from the information usually found in quality management information systems, it is acknowledged that disruptions occurring during the execution of construction activities are caused by nonconformities in the management system implemented for attaining quality performance in construction projects. Based on previous research work [36, 46, 54, 55], it is also accepted that the prevention of nonconformance events during the execution of construction projects relies on the performance of PQM practices. Therefore, Figure 1 depicts the indirect path through which PQM practices influence productivity in construction activities. This path assumes that, depending on the performance of PQM practices, nonconformance events may occur during the execution of the project, which eventually may cause disruptions that will affect productivity in construction activities. Following Battikha’s [53] approach to simplify the identification of patterns indicating the occurrence of nonconformance during project execution, this modeling approach also classifies nonconformance according to the process requirements with which they are related; for instance, as illustrated in Figure 1, delayed deliveries and inaccurate and out-of-specification deliveries are nonconformance events related to material supply. The following sections further clarify the factors and variables involved in this model. 2.1. Disruptions Affecting Productivity. For the purposes of this work, “disruption” is any incident that impedes a given construction activity and which, consequently, results in a negative impact on the productivity. According to the model illustrated in Figure 1, disruptions are caused by nonconformance events that occur during project execution. It is important to remark that only disruptions due to nonconformance events the project management is able to control or prevent should be accounted; for instance, disruptions due to the weather conditions should not be considered in this case. The proposed approach intends to evaluate the consequences of disruptions in terms of the achievement of the planned productivity by means of quantifying the delays attributed to any of the following types of disruptions: (i) interruptions, including the incidents in which an activity is temporarily discontinued due to nonconformities related either to the delays and inaccuracies associated with the supply of project requirements (i.e., labor, material, equipment, and information) or to unforeseen work conditions, (ii) low-productivity periods, taking into account the times in which work progress is slower than in regular workdays; this could be due to the nonconformities concerning delays in the supply of project requirements, unforeseen work conditions, and/or poor performance of labor,
Journal of Quality and Reliability Engineering PQM practices Supplier qualification Expediting
Delayed deliveries
Out-of-specification deliveries
Risk management
Delayed locating of utilities
Change and communication management
Effect on project performance
Inaccurate deliveries
Inaccurate location of utilities
Safety management
Disruptions in construction activities
Nonconformance events
Internal and external examinations
Constructability review
3
Equipment breakdowns Unexpected work conditions Accidents Delayed deliveries of information
Operability and value review
Errors in drawings and specifications
Personnel training and qualification
Changes on design
Material supply Staking service
Work interruptions
Equipment Work conditions Design information
Low productivity
Productivity
Reworks
Supervision
Incorrect or missing instructions
Figure 1: The effect of PQM practices on the productivity of construction activities.
(iii) reworks, denoting the cases in which nonconforming work needs to be redone in order to meet the project specifications or requirements. The computing of the total delay in a given construction activity, which eventually will affect the productivity of the project, should include the following variables: (1) the duration of each delay due to the occurrence of any given disruption, (2) the number of disruptions occurring during the execution of the activity. The assessment of both variables is explained later in this paper. 2.2. Nonconformance Events Causing Disruptions. As discussed above, nonconformance events are regarded as consequences of the defective performance of PQM practices; thus they include incidents that the project managers should be able to control. They also represent the intermediate drivers that propagate the effect of the PQM practices onto the performance outcomes of construction operations (e.g., productivity). The nature of nonconformance events that could occur during the execution of a project is usually very diverse, making it difficult to evaluate every type of them. Therefore, it makes sense to group them into categories representing the nature of a given number of nonconformance events. As said before, the proposed model has adopted Battikha’s [53] approach to integrate different types of nonconformance into
categories depicting requirements to accomplish activities in a given project. For instance, as illustrated in Figure 1, some of these requirements include material supply, equipment, design information, and supervision. Therefore, it is assumed that the performance of such requirements plays a major role in estimating the effect of nonconformance events on the number of disruptions and delays. 2.3. Project Quality Management Practices Causing Nonconformance Events. The PQM practices include, for the purposes of this research, all project management initiatives that construction organizations implement to achieve qualityrelated objectives in construction projects. The proposed model assumes that the performance of the PQM practices is the root cause of disruptions affecting productivity during construction. For instance, Figure 1 shows that the supplier qualification practice may cause nonconformance events such as delayed deliveries and inaccurate deliveries. A number of construction PQM practices have been documented by different authors [46–48, 54, 56–58]. Figure 1 includes PQM practices that the Construction Industry Institute has proposed to assure that quality is delivered to the customers in construction projects [57]; they depict the most frequently referred types of prevention and appraisal activities in the literature [46]. The performance of PQM practices, which is the variable under evaluation in this model, depends on the maturity of the efforts applied in the implementation of such practices. In this case, the performance assessment of PQM practices involved two different measures as follows.
4
Journal of Quality and Reliability Engineering (1) Subjective assessments based on a scale that includes five linguistic terms: there are no formal approach, reactive approach, stable formal system approach, continual improvement approach, and best-in-class performance. This approach adopted the self-assessment tool the ISO 9004:2000 standard proposes for assessing quality management processes. The interested reader should consult the ISO 9004:2000 standard for further details on this scale. (2) Objective assessments based on the calculation of a quality index that uses a crisp value scale within the 0 to 100% range. The quality index of a given PQM practice can be estimated with a self-assessment approach adopted from the model proposed by Kumar and Wolf [59] that includes a series of questions related to the level of implementation of the analyzed PQM practice. Each of these questions should be pondered with one of five possible rankings associated with a score (i.e., 0: not at all, 1: inadequate, 2: adequate, 3: good, and 4: superior) by project managers in order to obtain the sum of the scores and compute the corresponding quality index with the relation displayed as Quality Index =
Total Rating Score × 100. Maximum Score
(1)
The reason to use both assessments is to reduce the effect that the ambiguity of the assessments of managers participating as developers or users of the proposed system could have on the outcomes. More objective assessments attained with the computing of quality indexes would make it possible to obtain more accurate performance estimates (i.e., productivity) of construction operations.
3. Simulation Modeling Approach The objective of this research was the development of a simulation modeling approach to assess the effect of PQM on the performance of construction operations, especially on the productivity. This endeavor implemented discreteevent and stochastic simulation in order to obtain objective productivity estimates that may facilitate the assessment of such effect. Discrete-event simulation, in which the state of the system changes discretely only at occurred events, has been the preferred approach to construction simulation because of its simplicity [26]. On the other hand, stochastic simulation, in which the state of the system changes randomly over the time based on probabilistic functions, has been regarded as especially suitable for modeling the uncertainty involved in the variable behavior of construction operations [60]. In order to facilitate the implementation of these simulation techniques, the aforementioned effect is evaluated in terms of the attainment of productivity goals in a given construction operation. This approach reduces the problem to the estimate of the probability mass functions that embody the uncertainty associated with the occurrence of disruptions that may delay the activities involved in such operation and which eventually affect the productivity. The modeling of this uncertainty considers two variables:
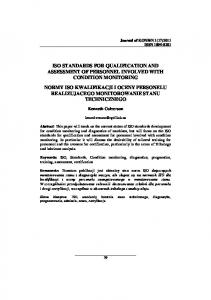
(1) the number of disruptions occurring in each of the activities in the operation, (2) the duration of the delays caused by each of these disruptions. It is necessary to determine the statistical parameters describing the probability mass functions of both variables for each of the activities that the analyzed operation includes. Such parameters are meant to be the inputs to the construction simulation model formulated to analyze the operation. By this way, the effect of the PQM practices can be incorporated to the estimating of the productivity outputs obtained with this simulation model, since PQM practices are considered the root causes of disruptions, as explained before. Nevertheless, the data limitation may make the estimate of these statistical parameters unfeasible by means of probability-based input modeling techniques. Such techniques are thought to be unsuitable for modeling the previously described uncertainty because the existing data sets are usually insufficient for deciding on the corresponding probability distributions. Instead, the use of knowledge-based assessments elicited from experienced personnel represents a more suitable approach to model this uncertainty. The implementation of the proposed modeling approach requires the development of a computer-based system that includes the following three subsystems. (1) A fuzzy expert system (FES) is to determine the quality levels of the project requirements, that is, the categories into which the nonconformance events are grouped. On the other hand, as seen in Figure 2, the corresponding performance levels of the PQM practices, that may be implemented in the organization or not, should be the inputs to this subsystem. (2) A fuzzy logic-based analytical approach (FLBAA) is to compute the statistical parameters (i.e., the mean and standard deviation) of both variables: the number of disruptions occurring in a given activity included in the operation and the durations of the delays caused by each of these disruptions. These statistical parameters should be obtained for every activity included in the construction operation under analysis. As seen in Figure 2, the quality levels of the project requirements obtained with the FES are meant to be the inputs to this subsystem. (3) The simulation project model of the specific operation is to be assessed, with which productivity estimates will be obtained. The abovementioned statistical parameters are needed as inputs to this simulation model. The two first subsystems are heuristic applications that facilitate the incorporation of knowledge-based assessments into the estimation of the statistical parameters required to run the simulation model of the construction operation. The integration of knowledge-based systems and simulation analysis has been studied since some decades ago [61–63], while the development of software engineering has made it easier to integrate these two modeling techniques so they can benefit
Journal of Quality and Reliability Engineering
5
Fuzzy expert system to determine the quality levels of the project requirements (Input variables) Performance level of PQM practices
(Intermediate variables) (Output variables) Number of Quality level of nonconformance events project requirements
Fuzzy logic-based analytical approach to estimate the statistical parameters of disruptions
Simulation model of the operation
Variables for computing Statistical parameters of the statistical parameters disruptions for each of of disruptions the activities in the operation
Performance estimates of construction operation
Supplier qualification Internal and external exams
Out-of-spec. deliveries
Expediting
Not-in-time deliveries
Risk management
Inaccurate deliveries
Safety management Personnel qualification and training Constructability review Change and communication management Operability and value review
Unexpected work conditions
Activity 1
Material supplying
Frequency of occurrence of quality level
Mean and SD of the number of disruptions
Adverse consequences on the activity
Mean and SD of the duration of delays
Activity x
Accidents Errors in drawings/specs Late deliveries of information
Design information
Changes on design
Cause variables
Operation productivity
.. .
Work conditions Frequency of occurrence of quality level
Mean and SD of the number of disruptions
Adverse consequences on the activity
Mean and SD of the duration of delays
Effect variables
Figure 2: Simulation-based fuzzy logic approach to assessing the effect of PQM practices on the productivity of construction operations.
each other. Such integrated approach has been successfully applied in different contexts: steel fabrication operations [64], chemical processes [65], service and manufacturing industries [9, 66], and emergency management systems [67]. Moreover, this approach has also been proven to be effective to solve construction problems, including applications to analyze construction operations [68–70], quantify the effect of accidents on construction operations [9], estimate accident risks on construction sites [8], estimate durations of construction activities [71], and estimate construction costs [5], among others. However, no evidences were found on the use of this approach to estimate the effect of quality management practices on the performance of construction operations. The following sections provide details of each of the abovementioned subsystems but since the proposed modeling approach makes intensive use of fuzzy logic and fuzzy sets, a short introduction on such theory is first provided.
4. Fuzzy Logic and Fuzzy Sets Fuzzy techniques have been widely used for solving a great diversity of construction problems [72]. Fuzzy logic uses fuzzy sets in order to facilitate the process of common sense reasoning with vague propositions dealing with linguistic
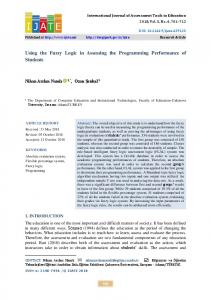
variables, whose values are words or sentences expressed in natural or artificial languages [73]. For instance, the assessment of the number of nonconformities in a given construction activity may implement linguistic values such as very small, small, medium, large, or very large. Fuzzy sets use membership functions to represent the relationship between a range of possible values and a linguistic term. The degree with which each of these values is related to the linguistic term is defined within the interval zero (no membership) to one (full membership). By this way, it is possible to evaluate the “degree of truth” of propositions such as “𝑥 number of nonconformities is large.” For instance, Figure 3 shows that the degree of membership of three nonconformities to the fuzzy set large is zero, while the degree of membership of five is one. In general, a fuzzy set 𝐴 representing the degree of truth with which any element 𝑥 (e.g., a given number of nonconformities) belongs to a set 𝐴 (e.g., a linguistic value) can be depicted by 𝑚 discrete values 𝜇𝐴 (𝑥) as seen in 𝐴 = [𝑥1 | 𝜇𝐴 (𝑥1 ) , 𝑥2 | 𝜇𝐴 (𝑥2 ) , 𝑥3 | 𝜇𝐴 (𝑥3 ) , . . . , 𝑥𝑚 | 𝜇𝐴 (𝑥𝑚 )] ,
(2)
where 𝜇𝐴 (𝑥) is the degree of membership [73]. For example, the fuzzy set medium in Figure 3 can be expressed as
6
Journal of Quality and Reliability Engineering Very 1.0
Very
small
Small
Medium
Large
large
1.0
Reactive
Stableformal
Continual improve
Best-inclass
0.8
0.8 0.6
0.6
0.4
0.4
0.2
0.2
0.0
No formal
0.0 0
1
2
3 4 5 Number of disruptions
6
7
10
20
30
40 50 60 70 Quality index (%)
80
90
100
Figure 3: Membership functions for the number of disruptions in the pipe installation activity.
Figure 4: Membership functions representing the linguistic terms used to assess the performance level of the PQM practices.
𝐴 = (0 | 0.0, 1 | 0.0, 2 | 0.33, 3 | 0.66, 4 | 1.0, 5 | 0.5, 6 | 0.0, 7 | 0.0). Moreover, fuzzy numbers are simpler presentations of fuzzy sets that fulfill the properties of normality and convexity, which facilitate the fuzzy logic operations on fuzzy sets [73]. Triangular and trapezoidal membership functions, such as those shown in Figure 3, are common shapes for fuzzy numbers because little information is required to build them.
events; this would permit reducing the factors to be analyzed for the operation. Further, Pareto analyses can be carried out to select the most frequent types of nonconformance events associated with each of the previously selected requirements. Furthermore, a follow-up root-cause analysis will permit the identification of the PQM practices that should be implemented for avoiding the occurrence of the previously selected types of nonconformance events. As seen in Figure 2, the variables integrated in the FES depict the cause variablesin the proposed model and should be modeled as follows.
5. Fuzzy Expert System to Determine the Quality Level of Project Requirements The purpose of the FES is to estimate, in fuzzy terms (i.e., very low, low, average, high, or very high), the quality levels of the project requirements (e.g., material supply, labor, and supervision). It is important to highlight that these estimates should be obtained at the project level and not at the operation level; that is, it is not necessary to obtain an estimate of the quality levels of requirements for every activity involved in the assessment. These estimates are needed as inputs to the FLBAA and, as proposed in this model (see Figure 2), they depend on the performance of the PQM practices that should be implemented to meet project quality. The model includes an intermediate variable, that is, the expected number of nonconformance events, which mediates the relationship between the project requirements and the PQM practices. The intention of such intermediate variable is to reduce the subjectivity of the assessments required for the estimating of the quality levels of project requirements. For example, the nonconformance events associated with the quality level of “material supply” may include “not in time deliveries,” “inaccurate deliveries,” and “out of specification deliveries,” while the “supplier qualification” and the “Expediting” practices could prevent the occurrence of “not in time deliveries.” Therefore, it is critical to identify the relationship between the PQM practices, the nonconformance events, and the project requirements that will be involved in the analysis. In this case, such identification can be done with root-cause analyses of the nonconformance events reported during past projects. First, the project requirements associated with the nonconformance events affecting a specific operation should be identified. Next, a Pareto analysis can be used to select the requirements with the highest frequency of nonconformance
(1) The performance levels of the PQM practices should be represented as input interfaces and can be expressed as either an estimated quality index (see (1)) or a linguistic term. The five linguistic terms proposed to assess this variable include no formal approach, reactive approach, stable and formal approach, continual improvement approach, and best-in-class performance. Therefore, the input interfaces should be built accordingly in order to use crisp values or fuzzy values as inputs to the system. Input interfaces that use crisp inputs require the representation of performance levels as membership functions, such as those shown in Figure 4. (2) The number of a given type of nonconformance event should be represented as an intermediate variable, which attains values during the inference process that are not needed as outputs of the model; their only function is passing information from one rule block to another. This information is conveyed during the inference process in the form of fuzzy (i.e., linguistic) values, which means that they do not need to be represented as membership functions. The linguistic terms used for assessing this variable are very low, low, average, high, and very high. (3) The quality levels of the project requirements should be modeled as output interfaces. Since the outputs to be obtained from the FES are required as fuzzy values, the inference process does not include the defuzzification of the fuzzy output. The linguistic terms used for assessing this variable are very poor,
Journal of Quality and Reliability Engineering
1.0
Very poor
Poor
7
Very good
Average Good
6. Fuzzy Logic-Based Analysis to Determine the Statistical Parameters of Activity Disruptions
0.8 0.6 0.4 0.2 0.0
1
2
3
4
5
6
7
8
9
10
Figure 5: Membership functions for evaluating the quality level of project requirements.
poor, average, good, and very good. Although the membership functions of these linguistic values are not required in the FES inference process, they should still be generated as they will be required by the inference process in the FLBAA. Figure 5 is a sample of these membership functions. Moreover, the inference process for determining the quality levels of project requirements requires two different sets of rule blocks that represent the following. (a) The effect of the performance levels of the PQM practices on the number of a given type of nonconformance event: for example, this includes rules like “IF the performance level of Personnel Qualification & Training is Reactive Approach AND the performance level of Safety Management is Stable Formal THEN the Number of Accidents is High.” (b) The effect of the number of nonconformance events on the quality level of the corresponding project requirements: this includes rules like “IF the number of Accidents is High AND the number of Unexpected Work Conditions is Low THEN the quality level of Work Conditions is Poor.” Experienced project managers involved in the organization and the kind of project for which the analysis is being conducted, such as general supervisors and program managers, could provide the knowledge-based assessments required to produce the abovementioned membership functions and inference rules. The introduction to the inference process that is inherent to any FES can be found in G. Bojadziev and M. Bojadziev [73]. Moreover, the FES built with the above-explained approach should be validated. This should be done in order to further reduce the effect that the ambiguity of the assessments, provided by managers participating as developers of the proposed system, could have on the outcomes.
The purpose of the FLBAA is determining, for each of the construction activities in the analyzed operation, the statistical parameters (i.e., the mean and standard deviation) of two variables: the number of disruptions occurring in a given activity included in the operation and the durations of the delays caused by each of these disruptions. These variables are associated with the disruptions occurring during the execution of the construction activities. Linguistic terms such as very low, low, average, high, and very high are used for assessing these two variables. It is important to highlight that these estimates should be obtained at the operation level, which means that it is necessary to estimate the statistical parameters for every activity involved in the operation under assessment. The proposed approach analyzes the combined effect of the quality levels of the project requirements on the performance (i.e., productivity in this case) of a given activity, for example, the combined effect of the good quality level of labor, the average quality level of supervision, and the poor quality level of material supply, on the productivity of the excavation activity. The formulation of the FLBAA is based on the methodology proposed by Ayyub and Haldar [74], whose efficacy was proven in the solving of different construction problems such as the scheduling of projects [74], the assessment of safety in construction operations [75], the selection of construction strategies [76], the estimation of accident risk in construction projects [8], the analysis of delays in construction operations [77], and the quantification of the effects of accidents on construction operations [9]. This methodology permits obtaining the normally distributed probability mass function of the occurrence of a given event, based on the subjective assessments of the state of the factors affecting the event. In the proposed model, the project requirements depict such factors. By this way, the estimate of the required statistical parameters can be based on the assessment of the effect of the quality levels of project requirements on the performance of the activities involved in the analyzed operation. The FLBAA brings into play the following variables: (i) 𝑄: the quality levels of the project requirements involved in the operation under analysis, (ii) 𝐹: the frequency of occurrence of the quality levels of the project requirements, (iii) 𝐶: the level of adverse consequences due to the effect of the quality levels (𝑄) on the activity under analysis, (iv) 𝑁: the number of disruptions counted during the performance of the activity, (v) 𝐷: the duration of the delay due to the occurrence of disruptions in the activity. As shown in Figure 2, 𝐹, 𝐶, 𝑁, and 𝐷 represent the effect variables, as they depend on the performance of the construction project requirements and the PQM practices.
8
Journal of Quality and Reliability Engineering Table 1: Linguistic terms used for assessing the variables involved in the FLBAA.
Variable 𝑄 𝐹 𝐶 𝑁 𝐷
Very poor Very unusual Very mild Very small Very small
Linguistic terms Average Often Medium Medium Medium
Poor Unusual Mild Small Small
Good Usual Severe Large Large
Very good Very usual Very severe Very large Very large
Note. 𝑄: quality level of the project requirements, 𝐹: frequency of occurrence, 𝐶: adverse consequences, 𝑁: number of disruptions, and 𝐷: duration of delays.
Table 2: Sample of inference rules for analyzing the effect of work conditions on the excavation activity. 𝑄 Very poor Poor Average Good Very good
𝐹 Unusual Often Often Often Unusual
𝐶 Very severe Severe Medium Mild Very mild
𝑁 Very large Large Medium Small Small
𝐷 Large Large Medium Small Small
Note. 𝑄: quality level of the project requirements, 𝐹: frequency of occurrence, 𝐶: adverse consequences, 𝑁: number of disruptions, and 𝐷: duration of delays.
The purpose of the FLBAA is to deliver the mean value and the standard deviation of both the number of disruptions counted during the performance of the activity (𝑁) and the duration of the delay due to the occurrence of disruptions in the activity (𝐷), for each of the activities involved in the operation under analysis. This involves the implementation of the following procedures. (1) Generate the membership functions of the abovementioned variables and the inference rules that will regulate the inference process. The development of these membership functions and inference rules should be specific to each of the activities within the analyzed operation and based on knowledge-based assessments provided by informed personnel directly participating in the undertaking of the activities, such as supervisors and laborers. Table 1 contains the linguistic terms commonly used in construction for assessing the effect variables. Every one of these terms should be represented as a membership function. For example, Figure 5 shows a sample of the membership functions representing the linguistic values of the quality levels (𝑄). In this case, psychometric scales with values ranging from zero to ten were thought to be appropriate domains for constructing the membership functions of 𝑄, 𝐹, and 𝐶, while natural numbers were more appropriate for the membership functions representing the linguistic values of 𝑁 (see, e.g., Figure 3) and 𝐷. Moreover, Table 2 contains a sample of the rules that describe the effect of the different states (i.e., the quality levels) of the “work conditions” on the performance of the excavation activity. It is necessary to determine how frequently each of these states occurs during the performance of the activity, as well as the magnitude of the consequences on the activity due to such states. For example, the frequency of occurrence of the very poor quality level of “work conditions” in the excavation activity is unusual and the consequences on this activity are believed to be very severe, which eventually may generate a very large number of disruptions and large duration of delays in the activity. Table 2 also includes
the corresponding linguistic values for 𝐹, 𝐶, 𝑁, and 𝐷 when 𝑄 is poor, average, good, and very good. (2) Compute, given a combination of quality levels (𝑄) in the operation being analyzed, the following. (a) Compute the membership functions resulting from the fuzzy relations that combine the membership functions of the corresponding 𝑄 and 𝐶 values of every one of the project requirements in the operation, as seen in 𝜇𝑄 × 𝐶 (𝑥𝑖 , 𝑦𝑗 ) = min [𝜇𝑄 (𝑥𝑖 ) , 𝜇𝐶 (𝑦𝑗 )] , ∙
(3)
where 𝑥𝑖 and 𝑦𝑗 are values within psychometric scales from zero to ten used for assessing 𝑄 and 𝐶, respectively, while 𝜇𝑄(𝑥𝑖 ) and 𝜇𝐶(𝑦𝑗 ) are the respective degrees of membership. (b) Compute the membership function 𝑇1 representing the total effect of the 𝑄 values on the performance of an activity, which results from the fuzzy union (∪) of all the 𝑛 sets of Cartesian relations obtained with (3), as seen in 𝑛
𝑇1 = ⋃ [𝜇𝑄 × 𝐶 (𝑥𝑖 , 𝑦𝑗 )] , 𝑖=1
∙
(4)
where 𝑛 is the number of project requirements involved in the operation under analysis. (c) Compute the membership functions resulting from the fuzzy relations combining the corresponding 𝐹 and 𝑁 values of each of the project requirements involved in the operation, as seen in 𝜇𝐹 × 𝑁 (𝑓𝑗 , 𝑟𝑘 ) = min [𝜇𝐹 (𝑓𝑗 ) , 𝜇𝑁 (𝑟𝑘 )] , ∙
(5)
where 𝑓𝑗 are values within a psychometric scales from zero to ten used for assessing 𝐹 and 𝑟𝑘 are
Journal of Quality and Reliability Engineering
9
natural numbers used for appraising 𝑁 (i.e., 𝑟𝑘 = 1, 2, 3, . . . , 𝑛), while 𝜇𝐹 (𝑓𝑗 ) and 𝜇𝑁(𝑟𝑘 ) are the respective degrees of membership. (d) The membership function 𝑇2 representing the total effect of the 𝐹 values on the number of nonconformities results from the fuzzy union (∪) of the 𝑛 sets of Cartesian relations obtained with 𝑛
𝑇2 = ⋃ [𝜇𝐹 × 𝑁 (𝑓𝑗 , 𝑟𝑘 )] , 𝑖=1
∙
(6)
where 𝑛 is the total number of project requirements involved in the operation. (e) The total effect of 𝐶 on 𝑁 in a given activity can be expressed with 𝑅𝑁 = (𝐶1 × 𝑁1 ) ∪ (𝐶2 × 𝑁2 ) ⋅ ⋅ ⋅ ∪ (𝐶𝑛 × 𝑁𝑛 ) ,
(7)
where 𝐶𝑛 × 𝑁𝑛 are fuzzy relations based on fuzzy condition expressions represented by statements assessing the relation between each possible 𝐶 value and a corresponding expected 𝑁 value. For example, if 𝐶1 is severe, then 𝑁1 is large; if 𝐶2 is medium, then 𝑁2 is average, and so on. Such relations can be determined with experts’ assessments of the performance of the given construction operation. (f) The membership function 𝑀 resulting from the fuzzy composition relation between 𝑇1 and 𝑅𝑁 can be calculated as seen in 𝑀 = 𝜇𝑇1 ∘𝑅𝑁 (𝑥𝑖 , 𝑟𝑘 ) = max {min [𝜇𝑇1 (𝑥𝑖 , 𝑦𝑗 ) , 𝜇𝑅𝑁 (𝑦𝑗 , 𝑟𝑘 )]} , 𝑦
(8)
(3) Calculate the probability of occurrence of each element 𝑟𝑘 within the subset of possible values of 𝑁. In order to calculate this figure, Oliveros and Fayek [77] deduced from Ayyub and Haldar [74] the following: 𝑃 (𝑁 = 𝑟𝑘 ) =
𝜇𝑆𝑁 (𝑟𝑘 ) , 𝑚 ∑𝑘 = 1 𝜇𝑆𝑁 (𝑟𝑘 )
(10)
where 𝑁 is the expected number of disruptions, 𝑃(𝑁 = 𝑟𝑘 ) is the probability of occurrence of 𝑁 being element 𝑟𝑘 , 𝜇𝑆 (𝑟𝑘 ) is the membership value of each element 𝑟𝑘 in the subset 𝑆𝑁 comprising the possible values of 𝑁, and 𝑚 is the number of elements in the subset 𝑆𝑁. Further details for determining the membership value of 𝑟𝑘 can be found in Ayyub and Eldukair [75]. Subsequently, the mean value of the number of disruptions (𝑁) and the corresponding standard deviation (𝜎𝑁) can be, respectively, calculated with 𝑚
𝑁 = ∑ (𝑟𝑘 ) × 𝑃 (𝑁 = 𝑟𝑘 ) 𝑘=1
𝑚
(11) 2
2
𝜎𝑁 = √ [ ∑ (𝑟𝑘 ) × 𝑃 (𝑁 = 𝑟𝑘 )] − (𝑁) . 𝑘=1
This procedure should be carried out to compute the mean and standard deviation of 𝑁 in each of the activities in the project. Moreover, it should also be used to estimate the statistics of 𝐷 in such activities.
7. Knowledge Elicitation and Representation
𝑗
where 𝜇𝑇1 ∘𝑅𝑁 (𝑥𝑖 , 𝑟𝑘 ) is the membership function of the fuzzy composition relation between 𝑇1 and 𝑅𝑁, 𝜇𝑇1 (𝑥𝑖 , 𝑦𝑗 ) is the membership function obtained with (4), and 𝜇𝑅𝑁 (𝑦𝑗 , 𝑟𝑘 ) is the membership function resulting from the fuzzy relation obtained with (7). (g) The membership function of the fuzzy joint effect of 𝑄 and 𝐹 on the expected 𝑁 can be developed as seen in 𝜇𝑀,𝑇2 (𝑥𝑖 , 𝑦𝑗 ) (𝑟𝑘 ) = min [𝜇𝑀 (𝑥𝑖 , 𝑟𝑘 ) , 𝜇𝑇2 (𝑓𝑗 , 𝑟𝑘 )] ,
(9)
where 𝜇𝑀(𝑥𝑖 , 𝑟𝑘 ) is the membership function of the effect of the quality levels of project requirements (𝑄) on the expected number of disruptions (𝑁), which was obtained with (8), while 𝜇𝑇2 (𝑓𝑗 , 𝑟𝑘 ) is the membership function of the effect of 𝐹 on the expected 𝑁 in the activity, obtained with (6). This fuzzy joint relationship will produce 𝑚 number of matrices, each of which corresponds to an element 𝑟𝑘 in the subset of possible values of 𝑁. Moreover, the values of 𝑁 may vary according to the uniqueness of the project and activity being analyzed. For example, Figure 3 shows that, for a given project, the subset of values 𝑟𝑘 ranges from zero to seven in the pipe installation activity.
This research adopted the procedures proposed by Fayek and Sun [78] to generate the membership functions of the variables involved in the case study model. This procedure included the following steps. (1) The linguistic terms commonly used by managers to assess the performance level of the variables involved in the model were determined, as seen in Table 3. Meetings with quality managers in the organization used for the sample application permitted a significant amount of discussion that gave relevant advice regarding the assessment of the variables. (2) The domains or universes of discourse and their respective ranges of values were determined for each of the aforementioned variables, as seen in Table 3. In order to establish a general numerical guideline for the assessment of the variables, it was assumed that the extreme value of no formal approach, very poor, very mild, and very unusual was zero. On the other hand, it was assumed that the extreme value for best-in-class performance is 100% for assessing the performance level for PQM practices and very good, very severe, and very usual are ten for assessing the quality level of project requirements (𝑄), the adverse consequences (𝐶), and the frequency of occurrence (𝐹), respectively.
10
Journal of Quality and Reliability Engineering Table 3: Linguistic terms and domains for the assessment of variables in the model.
Variables Performance level of PQM practices
Domain
Domain range
Quality index
0–100%
No formal approach
Reactive approach
Stableformal system
Continual improvement emphasized
Best-in-class performance
NA
Very low
Low
Average
High
Very high
NA
Very poor
Poor
Average
Good
Very good
0–10
Very unusual
Unusual
Often
Usual
Very usual
0–10
Very mild
Mild
Medium
Severe
Very severe
0–+∞
Very small
Small
Medium
Large
Very large
0–+∞
Very small
Small
Medium
Large
Very large
Number of Fuzzy nonconformance events Quality level of the Fuzzy project requirements (𝑄) Frequency level of Psychometric occurrence of the quality level (𝐹) Adverse consequence Psychometric resulting of the quality level (𝐶) Number of disruptions Number of disruptions in a given construction activity (𝑁) Duration of delays due Duration of delay (hours) to disruptions (𝐷)
Linguistic terms for assessment of variables
Table 4: Sample question to assign numerical values to linguistic terms assessing the performance level of PQM practices. Questions (1) For the performance level of the supplier qualification practice (a) From zero to what value would you consider as no formal approach? (b) What range of values as reactive approach? (c) What range of values as stable formal system? (d) What range of values as continual improvement? (e) From what value to 100 as best-in-class performance? (f) Other level (specify please)
(3) A questionnaire was developed in order to conduct the elicitation of the knowledge-based assessments needed for the development of the membership functions. By this way, the interviewees were asked to assign the appropriate numerical values for each of the linguistic variables in Table 3. For example, a sample question formulated to determine the numerical values for the linguistic terms assessing the performance levels of the PQM practices is illustrated in Table 4, while a sample question assessing the quality level of construction resources is shown in Table 5. The questionnaire was applied during a meeting with eight project managers of the construction organization that participated in the sample application. (4) The assessments of all respondents were accumulated for the development of the membership functions of the variables. The development of membership functions was based on the frequency with which each value, within the respective domain, was favored by the interviewees participating in the survey. A preliminary membership value 𝜇(𝑥𝑖 ) was determined by the average degree of belief that the respondents had regarding the belonging of a value or range of values to each the linguistic terms used to evaluate
Answers From zero From From From From From
To To To To To 100% To
Table 5: Sample question to assign numerical values to linguistic terms assessing the quality level of project requirements. Questions (1) For the quality level of material supply (a) From zero to what value would you consider it as very poor? (b) For poor? (c) For average? (d) For good? (e) From what value to 10 for very good?
Answers
From zero
To
From From From From
To To To To ten
the respective variables. This approach is illustrated in Table 6, which shows the ranges of values within the proposed subjective scale (from 0 to 100%) that each of the eight interviewees believed should correspond to the linguistic term “no formal approach” for the performance level of PQM practices. The opinions favoring each value were summed and the result was standardized by dividing them by the total number of interviewees in order to obtain the preliminary membership function for the linguistic term, which can be expressed in its 𝑥𝑖 | 𝜇(𝑥𝑖 ) form as
Journal of Quality and Reliability Engineering
11
Table 6: Example of the calculations for the development of membership functions. Opinions for no formal approach
0
10
20
Elements within the subjective scale (in %) 30 40 50 60 70
Interviewee A Interviewee B Interviewee C Interviewee D Interviewee E Interviewee F Interviewee G Interviewee H Sum of opinions Standardized frequency
x x x x x x x x 8 1.0
x x x x x x x x 8 1.0
x x x
x
x x
x
x 6 0.75
x 3 0.38
0 0.00
0 0.00
0 0.0
0 0.0
80
90
100%
0 0.0
0 0.0
0 0.0
Table 7: Sample of membership functions for the performance level of PQM practices. Linguistic terms No formal approach Reactive approach Stable formal system Continual improvement Best-in-class performance
0% 1.00 0.00 0.00 0.00 0.00
10% 1.00 0.00 0.00 0.00 0.00
20% 0.67 0.50 0.00 0.00 0.00
30% 0.33 1.00 0.00 0.00 0.00
Fuzzy membership functions 40% 50% 60% 70% 0.00 0.00 0.00 0.00 1.00 0.67 0.33 0.00 0.33 0.67 1.00 0.67 0.00 0.00 0.00 0.50 0.00 0.00 0.00 0.00
[0% | 1.0, 10% | 1.0, 20% | 0.67, 30% | 0.33, 40% | 0.00]. Likewise, all the opinions expressed for the other variables were developed into preliminary fuzzy membership functions. (5) The preliminary membership functions obtained with the previous procedure were adjusted in order to obtain triangular or trapezoidal shaped membership functions. Triangular and trapezoidal membership functions were preferred in this case, because of the clarity they can provide to the analysis. The rules proposed by Fayek and Sun [78] for generating the triangular and trapezoidal membership functions were used in this case. Figure 4 illustrates the membership functions developed to represent the performance level of the PQM practices, while Table 7 includes the numerical version of such membership functions. Likewise, all the preliminary membership functions obtained with the raw data were adjusted and developed into triangular or trapezoidal shapes. This should be done for all variables listed in Table 3. It is important to highlight that the membership functions of the first three variables in this table should be generated based on the assessment of the conditions at the project level, while, for the membership function of the last four other variables, the operation level should be considered (i.e., it is necessary to generate different membership functions for each construction activity).
8. Simulation Model for Sample Application The sample application of the proposed system analyzes the effect of the PQM practices implemented in the construction
80% 0.00 0.00 0.33 1.00 0.50
90% 0.00 0.00 0.00 0.50 1.00
100% 0.00 0.00 0.00 0.00 1.00
Shape Trap. Trap. Triang. Triang. Trap.
of a section of a new sanitary sewer system that includes the installation of 1320 feet (402.3 meters) of 24-inch concrete pipe pieces with a standard length of 3.0 meters. This entailed the undertaking of the open-cut construction operation that included the activities listed in Table 8. Since the advance rates of the activities have been assumed to be triangularly distributed, they were defined with the most optimistic, most pessimistic, and most likely estimates whose computation was based on the expertise of on-site managers. In order to simplify this sample application, the analysis only included the cause variables listed in Figure 2. A Pareto analysis of the historical data available in the organization permitted identifying the three most critical project requirements affecting the performance of open-cut construction operations, namely, the material supplying, the work conditions, and the design information. Besides, rootcause analyses allowed the identification of the corresponding associated nonconformities and PQM practices. It should be noted that the identification of the PQM practices brought into play the prevention and appraisal activities included in the Quality Performance Management System proposed by the Construction Industry Institute (CII), cited in Ledbetter [79], and the key principles and recommended practices articulated by the CII and the Business Roundtable’s Construction Industry Cost Effectiveness project [80]. The implementation of the FES used Fuzzytech, a software development tool for fuzzy logic analysis, in order to facilitate the inferring of the quality levels of the project requirements (𝑄). This implementation assumed the input variables (i.e., the performance levels of the PQM practices) as mutually independent, as well as the intermediate variables (i.e., the number of nonconformance events). Therefore,
12
Journal of Quality and Reliability Engineering Table 8: Durations and project requirements of the activities.
Activity Excavation Detailing excavation
Bedding
Pipe installation
Finishing of bedding
Backfilling
Project requirements 1 backhoe 1 survey crew 6 laborers 1 survey crew 1 loader 2 types of vibratory equipment 6 laborers 1 loader 2 pipeman 1 laborer 1 loader 2 types of vibratory equipment 6 laborers 1 dozer 1 type of compaction equipment
the PROD and the MIN operators were used to aggregate the corresponding effect of the input and intermediate variables on the intermediate and output (i.e., the quality levels of project requirements) variables, respectively. Moreover, the MAX operator was applied for aggregating the results of both the intermediate and output variables. Further clarification of the fuzzy operators used for aggregating the inputs and outputs in the FES can be found in Tsoukalas and Uhrig [81]. On the other hand, the procedure on which the FLBAA is based was coded in MATLAB in order to facilitate the computing of the statistical parameters of the two variables associated with the disruptions: the number of disruptions occurring in each of the activities in the operation and the duration of the delays caused by each of these disruptions. As explained before, the implementation of the FES and the FLBAA required the participation of experienced project managers and on-site employees, respectively, for the construction of the corresponding membership functions and inference rules. In addition, a discrete-event simulation model of the open-cut construction process was built up with Simphony. NET, a simulation platform developed by the NSERC/Alberta Construction Industry Research Chair at the University of Alberta. 8.1. Sensitivity Analysis. The initial part of this sample application used the FES for analyzing the sensibility of the quality levels of project requirements to the performance levels of the PQM practices. The intention of this analysis is identifying the PQM practices that should be favored for improvement, given the significance of their effect on the quality levels. The first treatment included setting at 0% the quality index (see (1)) of every other of the PQM practices that affect a given resource while setting at 100% the quality index of the other PQM practices. This implied that the lower the resulting quality level is, the more significant the effect of the PQM practice set at 0% on the corresponding project requirement is. The second treatment was conducted in order to reinforce
Advance rate (min/m)
Distance buffer (m)
𝑇(2.9, 4.2, 6.1)
20
𝑇(3.1, 4.0, 5.2)
40
𝑇(1.9, 3.8, 4.7)
20
𝑇(3.2, 4.5, 5.5)
20
𝑇(2.5, 3.9, 5.2)
40
𝑇(2.7, 3.6, 4.8)
the conclusions obtained with the first one. This time, the quality index of one of the PQM practices was set at 100%, while the other practices were set at 0%. In this case, the higher the resulting quality level is, the more significant the effect of the PQM practice set at 100% is. This also permitted identifying the practices that would have the most significant contribution towards the performance improvement of each of the project requirements. Based on the findings obtained, the significance of the effect of the PQM practices on the quality levels of the project requirements was ranked as low, medium, or high, as shown in Table 9. For example, this suggests that the effect of the supplier qualification practice on the quality level of material supply is high, while the effect of the internal and external examinations and the expediting practices is medium. A more efficient improvement process of the PQM system should prioritize increasing the performance of those PQM practices with the highest rankings of significance. 8.2. Simulation Outputs. The three hypothetical scenarios in Table 10 were formulated in order to illustrate the estimate of the effect of improving the performance levels of the PQM practices. This table contains four sections, each of which describes one of the different types of data processed within the computer-based system. The first section contains the inputs (i.e., the performance levels of the PQM practices) to the FES, which in this case have been formulated using fuzzy values (i.e., linguistic terms). In order to facilitate the analysis of the outputs, each of these fuzzy values features an equivalent crisp value, which is the quantitative depiction (displayed in parentheses) of the linguistic term used to assess the performance level of a given PQM practice. Though they are similar to the estimates of the quality indexes, the equivalent crisp values should be obtained from the defuzzification of the membership functions representing the linguistic terms instead of the self-assessment approach explained before. Such defuzzification can be based on the method proposed
Journal of Quality and Reliability Engineering
13
Table 9: Significance of the effect of the PQM practices on the project requirements. Project requirements Material supply
Design information
Work conditions
PQM practices Expediting Supplier qualification Internal and external examinations Change and communication Constructability review Internal and external examinations Expediting Operability and value review Personnel qualification and training Constructability review Internal and external examinations Personnel qualification and training Risk management Safety management
by Mason and Kahn [82]. For example, as obtained from the defuzzification of the membership functions in Figure 5, Table 10 shows that the equivalent crisp value of no formal approach is 21%, reactive approach is 38%, stable formal system approach is 60%, continual improvement approach is 76%, and best-in-class performance is 87%. On the other hand, the second section contains the analyzed requirements’ quality levels that were inferred with the sample FES, based on the input settings of the different scenarios. These outputs were fed to the FLBAA in order to compute, for each of the analyzed activities, the statistical parameters shown in the third section of the table. Finally, the fourth section contains the mean productivity estimates obtained as outputs of the simulation project model formulated for analyzing the sample operation. In this case, fifty simulation runs were completed for computing the mean productivity estimate in each one of the scenarios. 8.3. Output Analysis. The analysis of the outputs assumes that, in order to improve the operation’s current performance, it is necessary to increase the performance levels of the PQM practices. Therefore, it is feasible to compute the total increase of the performance levels, which results in the sum of the variations between the equivalent crisp values that depict the improved and the current performance levels. For example, assume that scenario 1 in Table 10 features the current states of the PQM practices; hence, the total increase of the performance levels in scenario 2 is 132% given that the equivalent crisp values increased by 22% (i.e., the variation between 60% in scenario 2 and 38% in scenario 1) in six of the PQM practices (i.e., 22% × 6). Moreover, the output analysis also includes the computing of the productivity increase that is expected from the increase of the performance levels of the PQM practices. The productivity increase in a given scenario is the ratio of the mean productivity estimates obtained in that scenario to the mean productivity estimates obtained in the corresponding previous scenario. For example, the productivity increase in scenario 2 is 37.15% given that the mean productivity estimates is 3.47 m/hr in scenario 2 and 2.53 m/hr in scenario 1.
Significance on project requirements Medium High Medium Medium Medium Medium Low Low High Low Medium High Low High
The purpose of computing the productivity increase and the total increase of the performance levels is estimating the relative productivity improvement achieved with the input settings of a given scenario. The relative productivity improvement is the ratio of the productivity increase to the effort implemented in the improvement of the PQM system (i.e., the total increase of the performance levels), and it serves to benchmark the outputs obtained in two or more alternative scenarios. This way, the relative productivity improvement may facilitate the recognition of the most efficient strategies for improving a given PQM system. For example, suppose that while the PMLs listed as input settings in scenario 1 correspond to the current state of the PQM practices, the ones in scenarios 3 and 4 depict potential targets for improving the performance currently attained. Therefore, in order to decide which of the two scenarios represents the best alternative, the outputs obtained in scenarios 3 and 4 have been evaluated with reference to those obtained in scenario 2. On one hand, scenario 3 features a conventional strategy in which all the PQM practices have been set at the stable and formal approach performance level. On the other hand, scenario 4 represents a more conscious strategy in which the upgrading of the practices with a high or medium significance on the quality level of the project requirements (refer to Table 9) has been prioritized. For example, while key PQM practices such as personnel qualification and training and safety management have been upgraded at the continual improvement approach performance level, less relevant practices such as the operability and value review and the risk Mmanagement have been kept at the reactive approach level. As seen in Table 10, the input settings in scenario 3 have produced higher quality levels of project requirements and, hence, better statistical parameters than those obtained with the inputs in scenario 2. This finally resulted in scenario 3 featuring a higher mean productivity estimate (i.e., 3.70 m/hr) than that obtained in scenario 2 (i.e., 3.47 m/hr). Moreover, it should be noted that the total increase of the performance levels in scenario 3 (i.e., 120%) is lower than that in scenario 2 (i.e., 132%). Therefore, the relative productivity improvement resulted significantly higher in scenario 3 (i.e., 0.39 against 0.28 in scenario 2),
14
Journal of Quality and Reliability Engineering Table 10: Settings of the scenarios and their corresponding simulation outputs. Scenarios → Expediting Supplier qualification Int. and ext. examinations Change and communications Operability and value review Constructability review Personnel qualification Risk management Safety management Material supply Design information Work conditions
Excavation Bedding Pipe installation Backfilling
Excavation Bedding Pipe installation Backfilling
MPE (meter/hour) Productivity increase TIPL RPI
𝑁 𝜎𝑁 𝑁 𝜎𝑁 𝑁 𝜎𝑁 𝑁 𝜎𝑁 𝐷 𝜎𝐷 𝐷 𝜎𝐷 𝐷 𝜎𝐷 𝐷 𝜎𝐷
1 2 Input settings (Performance Levels of the PQM practices) Stable (60%) Stable (60%) Reactive (38%) Stable (60%) Reactive (38%) Stable (60%) Reactive (38%) Stable (60%) Reactive (38%) Stable (60%) Reactive (38%) Stable (60%) Stable (60%) Stable (60%) Reactive (38%) Stable (60%) Stable (60%) Stable (60%) Quality levels of the project requirements (𝑄) Poor Good Average Good Good Very good Statistical parameters of the number of disruptions (𝑁) 2.47 1.93 1.11 0.81 2.22 1.45 1.11 0.50 2.72 1.94 1.35 0.80 2.22 1.46 1.11 0.50 Statistical parameters of the duration of delays (𝐷) 168.84 45.57 85.58 46.00 251.19 176.10 114.00 84.99 164.90 51.89 85.95 48.65 164.90 87.69 85.95 29.91 Outputs and output analysis 2.53 3.47 — 37.15% — 132% — 0.28
3 Stable (60%) Stable (60%) Stable (60%) Stable (60%) Reactive (38%) Stable (60%) Continual (76%) Reactive (38%) Continual (76%) Good Very good Very good 1.42 1.07 0.95 0.78 1.44 1.06 0.94 0.78 21.43 28.75 161.68 87.56 41.63 47.27 56.64 46.97 3.70 46.24% 120% 0.39
MPE: mean productivity estimates; TIPL: total increase of the performance levels; RPI: relative productivity improvement.
which means that it represents a more efficient alternative to improve the PQM system.
9. Limitations of the Proposed Approach and Future Work It is important to mention that since the purpose is the proposed modeling approach is assessing exclusively the effect of the PQM factors on the performance of the construction operations, this modeling approach excludes the effect of other factors affecting the construction operations. Only factors related to project quality management were considered in this modeling approach and the obtained
estimates should not be considered accurate as to take decisions regarding the scheduling of the project. They should be used to support decision making concerning quality performance improvement. However, future research could focus on the incorporation of this approach to a more comprehensive model that integrates the effect of a full list of factors on the estimating of construction performance. This would permit obtaining more accurate estimates that could be used for project scheduling purposes. The outcome of this study demonstrated the comprehensiveness of the proposed modeling approach to integrate the factors associated with PQM; however, this can also lead to further work in this research area. The outcomes derived
Journal of Quality and Reliability Engineering in future could benefit practice, and future research work should contemplate the inclusion of the costs associated with the upgrading of each of the PQM practices in the analysis. This would permit accomplishing an even more thoughtful decision-making process on the improvement of construction quality performance. Additional future research could focus on exploring that the input model defined by different experts may vary significantly to yield different results and the model by means of knowledge-based assessments for statistical parameters needs to be verified by actual site data in retrospective.
10. Summary and Conclusions The outcome of the research reported in this paper includes a unique methodology that integrates simulation modeling techniques with knowledge-based systems in order to assess the effect of project quality management on the performance of construction operations. The intention is to support decision making concerning the improvement of PQM systems and the increase of project performance. The proposed simulation-based approach is based on the analysis of the factors involved in the relationship between the PQM practices and the performance of construction activities: the performance levels of the PQM practices to determine the quality levels of the project requirements, and these quality levels will determine the amount of disruptions that eventually will affect the productivity of construction operations. Moreover, this approach provides simulation estimates of productivity in which the effect of the performance of PQM is incorporated. Incorporating this effect in the productivity estimates entails computing, for each of the activities involved in the operation, the parameters that describe the statistical distributions of two variables: the number of disruptions that may occur during the given activity and the duration of the delays due to such disruptions. These statistical parameters are the inputs to the simulation model from which the productivity estimates of the operation will be obtained. In this case, the estimate of these statistical parameters involves two fuzzy logic-based applications: a FES for inferring the quality levels of the project requirements involved in the analyzed construction operation and a FLBAA that uses the outputs of the FES for computing the required statistical parameters. The use of fuzzy logic makes possible the incorporation of knowledge-based assessments into the estimate of the statistical parameters, which permits overcoming the limited availability of information that makes probability-based modeling techniques unsuitable for this purpose. A sample application illustrated the assessment of the effect of a number of PQM practices on the productivity of an open-cut construction operation and demonstrated the predictive and explanatory capabilities of the proposed modeling approach. This included demonstrating that its capacity for exploring PQM improvement strategies can provide information on the mechanisms, interactions, and the most effective ways of achieving improved performance of the construction operations. Therefore, this clarified the
15 usefulness of the obtained simulation productivity estimates in the understanding of the effect of PQM on the construction performance, as well as in the decision making concerned with the improvement of quality performance. The availability of this methodology also offers new approaches to the study of quality, supports the exploration of fundamental questions in construction project performance, and facilitates the identification of improvement opportunities.
Conflict of Interests The authors declare that there is no conflict of interests regarding the publication of this paper.
Acknowledgments The research reported in this paper was supported by The National Council for Science and Technology (CONACYT— Mexico) and the Natural Sciences and Engineering Research Council/Construction Industry Research Chair (Canada). The authors would like to thank these institutions along with the companies that participated in this research.
References [1] H. Zhang, H. Li, and M. Lu, “Modeling time-constraints in construction operations through simulation,” Journal of Construction Engineering and Management, vol. 134, no. 7, pp. 545– 554, 2008. [2] N. N. Chehayeb and S. M. AbouRizk, “Simulation-based scheduling with continuous activity relationships,” Journal of Construction Engineering and Management, vol. 124, no. 2, pp. 107– 115, 1998. [3] D.-E. Lee and D. Arditi, “Automated statistical analysis in stochastic project scheduling simulation,” Journal of Construction Engineering and Management, vol. 132, no. 3, pp. 268–277, 2006. [4] Y. Mohamed, D. Borrego, L. Francisco, M. Al-Hussein, S. AbouRizk, and U. Hermann, “Simulation-based scheduling of module assembly yards: case study,” Engineering, Construction and Architectural Management, vol. 14, no. 3, pp. 293–311, 2007. [5] A. A. Shaheen, A. R. Fayek, and S. M. AbouRizk, “Fuzzy numbers in cost range estimating,” Journal of Construction Engineering and Management, vol. 133, no. 4, pp. 325–334, 2007. [6] M. Lu, S.-C. Lau, and C.-S. Poon, “Simulation approach to evaluating cost efficiency of selective demolition practices: case of Hong Kong’s Kai Tak Airport demolition,” Journal of Construction Engineering and Management, vol. 135, no. 6, pp. 448–457, 2009. [7] S. Fernando, J. Tan, K. C. Er, and S. AbouRizk, “Simulation: a tool for effective risk management,” in Proceedings of the 5th Construction Specialty Conference of the Canadian Society for Civil Engineering, Moncton, Canada, June 2003. [8] S. Lee and D. W. Halpin, “Predictive tool for estimating accident risk,” Journal of Construction Engineering and Management, vol. 129, no. 4, pp. 431–436, 2003. [9] S. Lee, D. W. Halpin, and H. Chang, “Quantifying effects of accidents by fuzzy-logic- and simulation-based analysis,” Canadian Journal of Civil Engineering, vol. 33, no. 3, pp. 219–226, 2006.
16 [10] A. Agbulos, Y. Mohamed, M. Al-Hussein, S. Abourizk, and J. Roesch, “Application of lean concepts and simulation analysis to improve efficiency of drainage operations maintenance crews,” Journal of Construction Engineering and Management, vol. 132, no. 3, pp. 291–299, 2006. [11] R. Sacks, A. Esquenazi, and M. Goldin, “LEAPCON: simulation of lean construction of high-rise apartment buildings,” Journal of Construction Engineering and Management, vol. 133, no. 7, pp. 529–539, 2007. [12] X. Mao and X. Zhang, “Construction process reengineering by integrating lean principles and computer simulation techniques,” Journal of Construction Engineering and Management, vol. 134, no. 5, pp. 371–381, 2008. [13] P. Wang, Y. Mohamed, S. M. AbouRizk, and A. R. T. Rawa, “Flow production of pipe spool fabrication: simulation to support implementation of lean technique,” Journal of Construction Engineering and Management, vol. 135, no. 10, pp. 1027–1038, 2009. [14] D. J. Fisher and J. T. O’Connor, “Constructability for piping automation: field operations,” Journal of Construction Engineering and Management, vol. 117, no. 3, pp. 468–485, 1991. [15] A. Sobotka, “Simulation modelling for logistics re-engineering in the construction company,” Construction Management and Economics, vol. 18, no. 2, pp. 183–195, 2000. [16] S. T. Ng, J. Shi, and Y. Fang, “Enhancing the logistics of construction materials through activity-based simulation approach,” Engineering, Construction and Architectural Management, vol. 16, no. 3, pp. 224–237, 2009. [17] C. Vidalakis, J. E. Tookey, and J. Sommerville, “Logistics simulation modelling across construction supply chains,” Construction Innovation, vol. 11, no. 2, pp. 212–228, 2011. [18] W. Lo and M.-R. Yan, “Evaluating qualification-based selection system: a simulation approach,” Journal of Construction Engineering and Management, vol. 135, no. 6, pp. 458–465, 2009. [19] T. M. Zayed and D. W. Halpin, “Quantitative assessment for piles productivity factors,” Journal of Construction Engineering and Management, vol. 130, no. 3, pp. 405–414, 2004. [20] T. M. Zayed and D. W. Halpin, “Simulation as a tool for pile productivity assessment,” Journal of Construction Engineering and Management, vol. 130, no. 3, pp. 394–404, 2004. [21] L. Song and S. M. AbouRizk, “Measuring and modeling labor productivity using historical data,” Journal of Construction Engineering and Management, vol. 134, no. 10, pp. 786–794, 2008. [22] T. M. Zayed and D. W. Halpin, “Pile construction productivity assessment,” Journal of Construction Engineering and Management, vol. 131, no. 6, pp. 705–714, 2005. [23] L. Song and S. M. AbouRizk, “Virtual shop model for experimental planning of steel fabrication projects,” Journal of Computing in Civil Engineering, vol. 20, no. 5, pp. 308–316, 2006. [24] E.-B. Lee and C. W. Ibbs, “Computer simulation model: construction analysis for pavement rehabilitation strategies,” Journal of Construction Engineering and Management, vol. 131, no. 4, pp. 449–458, 2005. [25] M. M. Hassan and S. Gruber, “Simulation of concrete paving operations on interstate-74,” Journal of Construction Engineering and Management, vol. 134, no. 1, pp. 2–9, 2008. [26] J. Shi and S. AbouRizk, “Continuous and combined eventprocess models for simulating pipeline construction,” Construction Management and Economics, vol. 16, no. 4, pp. 489–498, 1998.
Journal of Quality and Reliability Engineering [27] S. M. AbouRizk and R. J. Wales, “Combined discrete-event/ continuous simulation for project planning,” Journal of Construction Engineering and Management, vol. 123, no. 1, pp. 11–20, 1997. [28] C. Zhang, T. Zayed, and A. Hammad, “Resource management of bridge deck rehabilitation: Jacques cartier bridge case study,” Journal of Construction Engineering and Management, vol. 134, no. 5, pp. 311–319, 2008. [29] T. M. Zayed and D. Halpin, “Simulation of concrete batch plant production,” Journal of Construction Engineering and Management, vol. 127, no. 2, pp. 132–141, 2001. [30] H.-S. Lee, J.-W. Shin, M. Park, and H.-G. Ryu, “Probabilistic duration estimation model for high-rise structural work,” Journal of Construction Engineering and Management, vol. 135, no. 12, pp. 1289–1298, 2009. [31] T. Zayed, M. R. Sharifi, S. Baciu, and M. Amer, “Slip-form application to concrete structures,” Journal of Construction Engineering and Management, vol. 134, no. 3, pp. 157–168, 2008. [32] Y. Ebrahimy, S. M. AbouRizk, S. Fernando, and Y. Mohamed, “Simulation modeling and sensitivity analysis of a tunneling construction project’s supply chain,” Engineering, Construction and Architectural Management, vol. 18, no. 5, pp. 462–480, 2011. [33] M. Al-Bataineh, S. AbouRizk, and H. Parkis, “Using simulation to plan tunnel construction,” Journal of Construction Engineering & Management, vol. 139, no. 5, pp. 564–571, 2013. [34] A. Shahin, S. M. AbouRizk, Y. Mohamed, and S. Fernando, “Simulation modeling of weather-sensitive tunnelling construction activities subject to cold weather,” Canadian Journal of Civil Engineering, vol. 41, no. 1, pp. 48–55, 2014. [35] A. P. C. Chan and C. M. Tam, “Factors affecting the quality of building projects in Hong Kong,” International Journal of Quality & Reliability Management, vol. 17, no. 4-5, pp. 423–441, 2000. [36] K. N. Jha and K. C. Iyer, “Critical factors affecting quality performance in construction projects,” Total Quality Management and Business Excellence, vol. 17, no. 9, pp. 1155–1170, 2006. [37] E. W. M. Lam, A. P. C. Chan, and D. W. M. Chan, “Determinants of successful design-build projects,” Journal of Construction Engineering and Management, vol. 134, no. 5, pp. 333–341, 2008. [38] A. Aghaie and K. Popplewell, “Simulation for TQM—the unused tool?” TQM Magazine, vol. 9, no. 2, pp. 111–116, 1997. [39] R. Sonmez and J. E. Rowings, “Construction labor productivity modeling with neural networks,” Journal of Construction Engineering and Management, vol. 124, no. 6, pp. 498–504, 1998. [40] P. Love and D. J. Edwards, “Forensic project management: the underlying causes of rework in construction projects,” Civil Engineering and Environmental Systems, vol. 21, no. 3, pp. 207– 228, 2004. [41] C. Kontoghiorghes, “Examining the association between quality and productivity performance in a service organization,” The Quality Management Journal, vol. 10, no. 1, pp. 32–42, 2003. [42] G. San, T.-C. Huang, and L.-H. Huang, “Does labour quality matter on productivity growth? the case of the Taiwanese manufacturing industry,” Total Quality Management & Business Excellence, vol. 19, no. 10, pp. 1043–1053, 2008. [43] D. A. Langford, H. El-Tigani, and M. Marosszeky, “Does quality assurance deliver higher productivity?” Construction Management and Economics, vol. 18, no. 7, pp. 775–782, 2000. [44] W. E. Deming, Out of the Crisis, MIT Center for Advanced Engineering Study, Massachusetts Institute of Technology, Cambridge, Mass, USA, 1986.
Journal of Quality and Reliability Engineering [45] R. D. Moen, T. W. Nolan, and L. P. Provost, Improving Quality through Planned Experimentation, McGraw-Hill Series in Industrial Engineering & Management, McGraw-Hill, New York, NY, USA, 1991. [46] F. Yasamis, D. Arditi, and J. Mohammadi, “Assessing contractor quality performance,” Construction Management and Economics, vol. 20, no. 3, pp. 211–223, 2002. [47] B. Sharma and D. Gadenne, “An inter-industry comparison of quality management practices and performance,” Managing Service Quality, vol. 12, no. 6, pp. 394–404, 2002. [48] L. Lakhal, F. Pasin, and M. Limam, “Quality management practices and their impact on performance,” International Journal of Quality & Reliability Management, vol. 23, no. 6, pp. 625–646, 2006. [49] Q. Su, Z. Li, S.-X. Zhang, Y.-Y. Liu, and J.-X. Dang, “The impacts of quality management practices on business performance: an empirical investigation from China,” International Journal of Quality and Reliability Management, vol. 25, no. 8, pp. 809–823, 2008. [50] V. Kumar, F. Choisne, D. de Grosbois, and U. Kumar, “Impact of TQM on company’s performance,” International Journal of Quality & Reliability Management, vol. 26, no. 1, pp. 23–37, 2009. [51] X. Zu, “Infrastructure and core quality management practices: how do they affect quality?” International Journal of Quality & Reliability Management, vol. 26, no. 2, pp. 129–149, 2009. [52] P.-E. Josephson and Y. Hammarlund, “Causes and costs of defects in construction a study of seven building projects,” Automation in construction, vol. 8, no. 6, pp. 681–687, 1999. [53] M. G. Battikha, “Reasoning mechanism for construction nonconformance root-cause analysis,” Journal of Construction Engineering and Management, vol. 134, no. 4, pp. 280–288, 2008. [54] T. H. Willis and W. D. Willis, “A quality performance management system for industrial construction engineering projects,” International Journal of Quality & Reliability Management, vol. 13, no. 9, pp. 38–48, 1996. [55] R. A. Orwig and L. L. Brennan, “An integrated view of project and quality management for project-based organizations,” International Journal of Quality & Reliability Management, vol. 17, no. 4-5, pp. 351–363, 2000. [56] W. Carl and Y. C. Hurtado, “Quality management practice in capital projects,” Transactions of the American Association of Cost Engineers, ABI/INFORM Global, pp. Q.4.1–Q.4.8, 1990. [57] T. A. Neese and W. B. Ledbetter, “Quality performance management in engineering/construction,” Transactions of the American Association of Cost Engineers, ABI/INFORM Global, pp. A.2.1–A.2.10, 1991. [58] M. Barad and T. Raz, “Contribution of quality management tools and practices to project management performance,” International Journal of Quality & Reliability Management, vol. 17, no. 4-5, pp. 571–583, 2000. [59] C. C. P. Kumar and C. Wolf, “Assessing project quality,” AACE Engineers Transactions, vol. 2, pp. I.5.1–I.5.11, 1992. [60] S. M. AbouRizk and D. W. Harpin, “Probabilistic simulation studies for repetitive construction processes,” Journal of Construction Engineering and Management, vol. 116, no. 4, pp. 575– 594, 1990. [61] P. A. Fishwick and R. B. Modjeski, Knowledge-Based Simulation: Methodology and Application, vol. 4 of Advances in Simulation, Springer, New York, NY, USA, 1991. [62] P. A. Fishwick and P. A. Luker, Qualitative Simulation Modeling and Analysis, vol. 4 of Advances in Simulation, Springer, New York, NY, USA, 1991.
17 [63] P. A. Fishwick, “An integrated approach to system modeling using a synthesis of artificial intelligence, software engineering, and simulation methodologies,” ACM Transactions on Modeling and Computing Simulation, vol. 2, no. 4, pp. 307–330, 1992. [64] D. Stirling and S. Sevinc, “Combined simulation and knowledge-based control of a stainless steel rolling mill,” Expert Systems with Applications, vol. 3, no. 3, pp. 353–366, 1991. [65] M. Eisenberg, “The kineticist’s workbench: qualitative/quantitative simulation of chemical reaction mechanisms,” Expert Systems With Applications, vol. 3, no. 3, pp. 367–377, 1991. [66] Y.-C. Chang and C.-C. Chen, “Knowledge-based simulation of bunkering services in the port of Kaohsiung,” Civil Engineering and Environmental Science, vol. 23, no. 1, pp. 21–34, 2006. [67] J. Z. Hern´andez and J. M. Serrano, “Knowledge-based models for emergency management systems,” Expert Systems with Applications, vol. 20, no. 2, pp. 173–186, 2001. [68] H. Zhang, C. M. Tam, and J. J. Shi, “Application of fuzzy logic to simulation for construction operations,” Journal of Computing in Civil Engineering, vol. 17, no. 1, pp. 38–45, 2003. [69] A. Shaheen, A. Fayek, and S. AbouRizk, “A framework for integrating fuzzy expert systems and discrete event simulation,” in Proceedings of the ASCE Construction Research Congress, pp. 1–11, 2005. [70] Y. Mohamed and S. M. AbouRizk, “Framework for building intelligent simulation models of construction operations,” Journal of Computing in Civil Engineering, vol. 19, no. 3, pp. 277–291, 2005. [71] H. Zhang, H. Li, and C. M. Tam, “Fuzzy discrete-event simulation for modeling uncertain activity duration,” Engineering, Construction and Architectural Management, vol. 11, no. 6, pp. 426–437, 2004. [72] A. P. C. Chan, D. W. M. Chan, and J. F. Y. Yeung, “Overview of the application of “fuzzy techniques” in construction management research,” Journal of Construction Engineering & Management, vol. 135, no. 11, pp. 1241–1252, 2009. [73] G. Bojadziev and M. Bojadziev, Fuzzy Logic or Business, Finance, and Management, vol. 12 of Advances in Fuzzy Systems: Applications and Theory, World Scientific, Singapore, 1997. [74] B. M. Ayyub and A. Haldar, “Project scheduling using fuzzy set concepts,” Journal of Construction Engineering and Management, vol. 110, no. 2, pp. 189–204, 1984. [75] B. M. Ayyub and Z. A. Eldukair, “Safety assessment methodology for construction operations,” in Proceedings of the 5th International Conference on Structural Safety and Reliability (ICOSSAR ’89), pp. 771–777, ASCE, New York, NY, USA, August 1989. [76] B. M. Ayyub and A. Haldar, “Decisions in construction operations,” Journal of Construction Engineering and Management, vol. 111, no. 4, pp. 343–357, 1985. [77] A. V. O. Oliveros and A. R. Fayek, “Fuzzy logic approach for activity delay analysis and schedule updating,” Journal of Construction Engineering and Management, vol. 131, no. 1, pp. 42–51, 2005. [78] A. R. Fayek and Z. Sun, “A fuzzy expert system for design performance prediction and evaluation,” Canadian Journal of Civil Engineering, vol. 28, no. 1, pp. 1–25, 2001. [79] W. B. Ledbetter, “Quality performance on successful project,” Journal of Construction Engineering and Management, vol. 120, no. 1, pp. 34–46, 1994. [80] S. D. Anderson, “Project quality and project managers,” International Journal of Project Management, vol. 10, no. 3, pp.
18 138–144, 1992, Reprinted from PMI ’91 Seminar/Symposium Proceedings, 28 September–2 October 1991, Dallas, TX, USA. [81] L. H. Tsoukalas and R. E. Uhrig, Fuzzy and Neural Approaches in Engineering, John Wiley & Sons, New York, NY, USA, 1997. [82] A. K. Mason and D. J. Kahn, “Estimating costs with fuzzy logic,” AACE International Transactions, pp. 122–127, 1997.
Journal of Quality and Reliability Engineering
International Journal of
Rotating Machinery
Engineering Journal of
Hindawi Publishing Corporation http://www.hindawi.com
Volume 2014
The Scientific World Journal Hindawi Publishing Corporation http://www.hindawi.com
Volume 2014
International Journal of
Distributed Sensor Networks
Journal of
Sensors Hindawi Publishing Corporation http://www.hindawi.com
Volume 2014
Hindawi Publishing Corporation http://www.hindawi.com
Volume 2014
Hindawi Publishing Corporation http://www.hindawi.com
Volume 2014
Journal of
Control Science and Engineering
Advances in
Civil Engineering Hindawi Publishing Corporation http://www.hindawi.com
Hindawi Publishing Corporation http://www.hindawi.com
Volume 2014
Volume 2014
Submit your manuscripts at http://www.hindawi.com Journal of
Journal of
Electrical and Computer Engineering
Robotics Hindawi Publishing Corporation http://www.hindawi.com
Hindawi Publishing Corporation http://www.hindawi.com
Volume 2014
Volume 2014
VLSI Design Advances in OptoElectronics
International Journal of
Navigation and Observation Hindawi Publishing Corporation http://www.hindawi.com
Volume 2014
Hindawi Publishing Corporation http://www.hindawi.com
Hindawi Publishing Corporation http://www.hindawi.com
Chemical Engineering Hindawi Publishing Corporation http://www.hindawi.com
Volume 2014
Volume 2014
Active and Passive Electronic Components
Antennas and Propagation Hindawi Publishing Corporation http://www.hindawi.com
Aerospace Engineering
Hindawi Publishing Corporation http://www.hindawi.com
Volume 2014
Hindawi Publishing Corporation http://www.hindawi.com
Volume 2014
Volume 2014
International Journal of
International Journal of
International Journal of
Modelling & Simulation in Engineering
Volume 2014
Hindawi Publishing Corporation http://www.hindawi.com
Volume 2014
Shock and Vibration Hindawi Publishing Corporation http://www.hindawi.com
Volume 2014
Advances in
Acoustics and Vibration Hindawi Publishing Corporation http://www.hindawi.com
Volume 2014