781652 research-article2018
TRRXXX10.1177/0361198118781652Transportation Research RecordMehrara Molan and Hummer
TRR
Article
JOURNAL OF THE TRANSPORTATION RESEARCH BOARD
Simulation Modeling of Pedestrian Performance in the New Synchronized and Milwaukee B Interchanges versus Existing Designs
Transportation Research Record 1–10 © National Academy of Sciences: Transportation Research Board 2018 Reprints and permissions: sagepub.com/journalsPermissions.nav https://doi.org/10.1177/0361198118781652 DOI: 10.1177/0361198118781652 journals.sagepub.com/home/trr
Amirarsalan Mehrara Molan1 and Joseph E. Hummer2
Abstract Most U.S. highway agencies recognize the importance of designing safe, short, and comfortable paths for pedestrians. Providing such an acceptable condition for pedestrians requires specific attention at intersections and service interchanges due to their interaction with other modes of transportation. The main objective of this research was to analyze pedestrian operation at two new service interchanges—the synchronized and Milwaukee B interchanges—in comparison with four existing designs. The analysis consists of three main parts: (1) a general comparison among the designs for pedestrian performances in terms of safety, travel time, and the level of service; (2) investigation of the effects of vehicles on pedestrian performance; and (3) modeling the impact of pedestrians on the traffic operation of vehicles. A comprehensive series of simulation tests were run using VISSIM and Synchro to study the pedestrian performance of interchanges in various situations of traffic volume, turning traffic ratio, traffic distribution, and percentage of heavy vehicles. The results indicated that a relatively safe condition is expected for pedestrians in the proposed new designs in comparison with the existing interchanges; however, the pedestrians’ travel time was lower in all the existing designs than in the new designs except the diverging diamond interchange (DDI). The DDI, one of the most popular alternative interchanges, showed the worst performance in all the aspects of the pedestrian analysis. Despite the very good performance of conventional diamond interchange regarding pedestrian travel time and safety, pedestrians could have a significant negative impact on vehicle travel time through a diamond. Approximately, 11–15% of highway fatalities in the U.S. and Canada are pedestrians but this rate reaches 25%, and 30%, in China and Poland, respectively (1–4). The statistics become very substantial in less developed countries, where the rate increases to 57% in Mumbai, India (5). The threat seems to be more critical in intersections and service interchanges (where a freeway intercepts an arterial) due to the interaction of pedestrians and vehicles, especially in urban and suburban areas. In Montreal, almost 60% of pedestrian crashes occurred at intersections (6), while the rate in some places in the U.S. is as high as 76% (7). The design and construction of most of the current service interchanges in the U.S. goes back more than 50 years, when there was much less notice taken of pedestrians. The considerable traffic growth during the last two decades caused transportation agencies to improve some old interchanges using alternative designs such as the diverging diamond interchange (DDI). The DDI offers good traffic operations and superior safety (8) but questions remain on its friendliness to pedestrians. This point might be one of
the reasons for special attention to the topic these days, as a new project entitled NCHRP 07-25 has been recently been funded regarding the pedestrian performance at alternative intersections and interchanges (9). The primary objective of this research was to study the performance of pedestrians in two new service interchanges in comparison with four existing designs. The influence of various traffic variables on pedestrian performance was also analyzed at each type of interchange. In addition, the research identified the impact of pedestrians on the vehicular travel time. There were only a few studies up to this point (10–12) which focused on the impact of pedestrians on vehicle opera1
Wyoming Technology Transfer Center, University of Wyoming, Laramie, WY 2 Mobility and Safety Division, North Carolina Department of Transportation, Raleigh, NC Corresponding Author: Address correspondence to Amirarsalan Mehrara Molan:
[email protected]
2
Transportation Research Record 00(0)
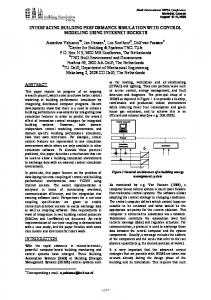
Figure 1. The geometry and the pedestrian path (the dashed red line) in the interchanges tested.
tion at intersections, so this effort hoped to build that knowledge base. The new interchanges studied here—the synchronized and Milwaukee B interchanges—already showed potential in terms of traffic operation to be viable substitutes for failed conventional interchanges. In a previous work (13), the authors compared the new interchanges to the DDI, to the parclo B, to the diamond, and to an existing interchange in Milwaukee, WI that the authors called a Milwaukee A. The authors found that the new interchanges performed very well in terms of vehicle travel time and delay compared to those existing interchanges. Figure 1 provides diagrams of the interchanges considered in this study and in that previous work. In Figure 1 northbound (NB) and southbound (SB) represent the direction of the freeway while eastbound (EB) and westbound (WB) represent the arterial. The synchronized interchange is essentially the interchange version of a superstreet intersection (also known as synchronized, restricted crossing u-turn, j-turn, or reduced conflict intersection). It has the same features as a superstreet design in prioritizing the traffic flow on the arterial while its geometry limits the access of the traffic on the side street. In this way, the traffic flow of the network is improved when there is not a large volume of left turns from the freeway. Because of the contraflow lanes for the left turns from arterial, and U-turns for the left turns from the freeway, all crossovers on the arterial have just “half-signals” (two-phase signals which only stop one direction of the arterial). Therefore, a strong progression system at any speed, any
cycle length, and any crossover spacing is possible with the synchronized interchange. In addition to the contraflow design for expediting the flow on arterial, two loops are provided in the Milwaukee B interchange for the left turns from the freeway. The Milwaukee B interchange thus mimics the current parclo B interchange. Like the parclo B and the synchronized interchange, the Milwaukee B also just uses half-signals on the arterial and should provide superb signal progression. The authors chose the comparison interchanges based on popularity, efficiency, and similarity to the new interchanges. The conventional diamond is the most common interchange form in the U.S., and the parclo B design is acknowledged as one of the most efficient designs. The DDI was included because it has become very popular after the research by Chlewicki (14), and after the first DDI in the U.S. opened in 2009. The Milwaukee A was also included in this research since its geometry has similarities to the new Milwaukee B design and since no publication has reviewed its performance before to our knowledge.
Background Alternative Intersections and Interchanges Pedestrians have been a focus of research attention at alternative intersections and interchanges during the past 12 years or so. The Federal Highway Administration (FHWA) information guides on the restricted crossing u-turn (RCUT), median u-turn, and continuous flow intersections (CFI) all
3
Mehrara Molan and Hummer included chapters on how pedestrians should be accommodated in those designs and tried to make the case that the designs were not pedestrian barriers (15–17). The CFI has been a particular focus in this regard, with papers such as by Jagannathan and Bared in 2005 (18) attempting to improve the pedestrian-friendliness of the design. A research effort on pedestrians at the RCUT sponsored by the North Carolina Department of Transportation (NCDOT) showed that signalized midblock crosswalks would be helpful (19). Since the 1990s, a need to improve the old interchange designs was found in the U.S. due to the considerable increase in the number of vehicles and the lack of budget for building new highways. To respond to the need, single-point interchanges (SPIs) became very popular during the early 1990s. SPIs gained the trust of designers because of their acceptable traffic operation and capacity using only a single three-phase signal. This single signal allowed the through traffic to clear the interchange faster than a conventional diamond, and the opposing left turns could move at the same time (20). As for disadvantages, the SPI needs a wide bridge that substantially increases the cost of construction. Besides, the design could be complicated for the users who were not familiar with the design and provide them trouble in finding their way safely. Pedestrians had also four free-flow and four signalized crossings to contend with. Despite the drawbacks, hundreds of SPIs were built across the U.S. until the mid-2000s when its popularity suddenly dropped after the DDI was introduced. The DDI provides almost the same traffic operations as the SPI but is usually much cheaper and easier to construct. Thus, more than 80 DDIs have been opened in the U.S. since 2009 (21). According to the numerous studies on DDI (14, 22–24), the DDI has improved the vehicular traffic performance of failed diamond interchanges very well. Yeom et al. (24) conducted a before–after study to compare the performance of the interchanges when they had a conventional diamond before construction. Based on the results, queue lengths were decreased between 19 and 83 percent, and the DDI was able to improve the level of service (LOS) from F to C or even B in some cases. On the other hand, the previous studies mentioned a lack of capacity in the DDI, especially in high through traffic conditions. As an example, a DDI was not a proper treatment for improving a conventional diamond interchange for a case in Alabama (25). Regarding the pedestrian performance, two different paths have been used at a DDI: (1) a center crossing, and (2) an outside crossing. However, both the paths are like the SPI’s path having four free-flowing and four controlled crossings and this added another point to the list of DDI disadvantages.
Pedestrian Studies Many previous studies had been conducted to analyze and recognize the parameters involved in pedestrian crashes at intersections. Long waiting time for the walk interval, short walk interval, and the high turning volume of vehicles at conflict
points with pedestrians on permissive green controls were identified as the most important variables for pedestrian crashes at intersections (4). Brosseau et al. (6) studied the effect of pedestrians’ waiting time on their safety at intersections. The research defined the waiting time as a factor of signal phasing and arrival time and concluded that minimizing waiting time can considerably decrease the dangerous behavior of, and violations by, pedestrians. Clearance time (or the flashing “DO NOT WALK” interval) was introduced as another important factor for pedestrian safety. Pedestrians tend to commit a violation either when the clearance time is longer or shorter than needed. Regarding pedestrian operation analysis, many important gaps are still observed in the literature despite the recent efforts. Milazzo et al. (10) and Hubbard et al. (12) claimed that the method in the version of the Highway Capacity Manual (HCM) in force when they did their research was not accurate and the effect of traffic volume was not reflected well. The HCM (26) method relates LOS for pedestrians to pedestrian space and delay, while no other variables such as the effect of right-turning traffic on pedestrians are considered. Other possible parameters which are not taken in account in the HCM analysis include the direction of pedestrian movement, pedestrian volume, the time of arrival (whether the pedestrian arrives on time or late to the crossing point), and the crosswalk location (12). Milazzo et al. (10) examined the capacity of intersections considering the effect of pedestrians. Their results showed that pedestrian volume impacts the vehicular saturation flow, especially when the rate is more than 500 pedestrians per hour in the U.S. Milazzo et al. (10) recommended to add new saturation flow adjustment factors to include the effect of pedestrians on the affected lane groups (right turn and left turn).
Simulation Modeling Procedure Simulation models are in widespread use in various aspects of transportation engineering from the studies on user behavior (27) or vehicle dynamics (28), to studies related to operation and safety of transportation systems (14, 29, 30). Based on recent and relevant studies (4, 31, 32), it can be concluded that VISSIM is one of the best available tools in this field for modeling vehicles and pedestrians, especially in the U.S. There is no doubt that signal timing and phasing plays a notable role in the performance of pedestrians at an interchange. To make sure of the accuracy of signal timing in the simulation, all the signals were designed using Synchro. Both VISSIM and Synchro have been validated by many studies (31–35) and have provided high accuracy in their outcomes. Molan (34), which is a comprehensive research relevant to this paper, conducted a validation using real probe data and found that there is no significant difference between the simulation results and the real data. Ishaque and Noland (31) conducted extensive research on the calibration and validation of VISSIM and found that the VISSIM car-following algorithm is strongly adapted to the reality of
4
Transportation Research Record 00(0)
Table 1. Division of Traffic Conditions in the Simulation Modeling Traffic distribution Pedestrians volume
Truck percentage
360 pedestrians per hour 4 % (moderate truck traffic) No pedestrians
8 % (high truck traffic)
Turning volume ratios Left turn = through = right turn (high turning condition) Left turn = 0.66 through = right turn (moderate turning condition) Left turn = 0.25 through = right turn (low turning condition)
pedestrian and vehicle flow even in the most complicated modeling environments. After the Synchro and VISSIM modeling, ANOVA was performed on the results using IBM SPSS to compare the mean values of the measure of effectiveness (MOEs) as well as to investigate the effect of various variables on the performance of each interchange. The following sections describe different aspects of the simulation modeling.
Simulation Scenarios A fair comparison between interchanges would not be possible without including a wide range of traffic scenarios in the simulation. Vehicle volumes were detemined using the critical lane volume (CLV) procedure, which is a traditional and popular method to obtain an initial ratio of volume over capacity (V/C) at intersections and interchanges. The entry traffic volume of the network was found to be 5330, 5250, and 5140 vehicles per hour considering V/C equal to 1 in a conventional diamond interchange in high turning, moderate turning, and low turning cases, repectively. The authors collected data from 37 random service interchanges in North Carolina and found an average of 4.3% for the truck volume. Also, about 90% of the service interchanges had a truck traffic ratio less than 8%. Therefore, 4% and 8% were selected to simulate moderate and high truck traffic situations in the simulation. To cover balanced and unbalanced traffic situations, six different traffic distributions were considered in the study. As the last factor involved in the simulation, the network was analyzed for two cases of pedestrian volume: (1) when the pedestrian volume was a relatively high 360 per hour total on all sidewalks, and (2) when the network is located in a place with no effective presence of pedestrians. The researchers chose to use a single relatively high pedestrian volume in the experiment for three reasons. First, there is almost nowhere in the U.S. where there are higher pedestrian demands crossing interchanges than those simulated in this study outside of a few downtown areas where these
EB/WB EB = WB (equal traffic on EB and WB) EB = 0.5 WB (higher traffic on WB)
NB/SB NB = SB (equal traffic on NB and SB) NB = 0.5 SB (higher traffic on SB) 0.5 NB = SB (higher traffic on NB)
interchanges would not be considered. Second, lower pedestrian demands would start to mean that the results would be based on low sample sizes leading to instability in the results. Third, since pedestrians up to fairly high flow levels travel in packs or bunches rather than lanes, causing each other little extra delay, there should be little variation in the results for different levels of pedestrian demand up to a high level. As shown in Figure 1, there were four origins and destinations (southwest, southeast, northwest, and northeast) for the pedestrians, so, each route handled 90 pedestrians per hour in the model runs with pedestrians. No pedestrians crossed the arterial; all pedestrians crossed the bridge. Table 1 presents a summary of scenarios in the research. A total of 432 VISSIM simulation scenarios were tested. Each test was repeated two times (to include different seeds during the simulation), and the average (of two runs) was taken as the representative outcome of each test.
Interchange Design Based on data collected on the geometry of 30 service interchanges in the U.S. (mostly from Michigan), curb radii of right turns, loops radii, and ramp lengths of 40 ft, 250 ft, and 2000 ft, respectively, were used in this research. A 600-ft distance between ramps was defined for all the interchanges except the parclo B which needed a longer distance of 1200 ft. As the base of the simulation model, a typical four-lane arterial (two lanes in each direction) was selected for all the interchanges, and exclusive right turn or left turn lanes were added to each design as needed. All the auxiliary lanes begin at the same place with a storage length of 400 ft and a taper length of 100 ft. The lengths of the network on each leg were 5280 ft (1 mile) and 1600 ft for vehicles and pedestrians, respectively. Regarding the crossing pattern, as indicated by Figure 1, the outside crossing was chosen for all the interchanges except the DDI, where a center crossing was simulated due to its popularity in comparison with the outside crossing.
5
Mehrara Molan and Hummer Table 2. Mean Values of Pedestrians’ Travel Time and Stop in Each Interchange Overall Interchange type
High turning
Moderate turning
Low turning
Travel time (sec)
Stops (no)
Travel time (sec)
Stops (no)
Travel time (sec)
Stops (no)
Travel time (sec)
Stops (no)
386 346 342 355 348 364
2.05 0.68 0.93 1.25 1.34 1.34
380 348 343 357 352 371
2.13 0.71 1.03 1.29 1.20 1.27
386 346 342 356 348 364
1.96 0.66 0.89 1.32 1.10 1.15
391 344 342 353 345 360
2.07 0.65 0.87 1.13 1.09 1.02
DDI Diamond Milwaukee A Milwaukee B Parclo B Synchronized
Traffic Signal Design Right turn on red (RTOR) was allowed but turning vehicles had to yield to pedestrians in permissive (shared) green intervals. There was no jaywalking allowed in the models. Since pedestrian clearance time is an important component of safety, and there are different practices in setting that time around the U.S., the current research chose clearance time based on field data collection. The authors collected clearance time on all approaches at 25 intersections with pedestrian signals in urban and suburban areas of Detroit, Michigan. Reviewing the data, a wide range of clearance times were observed even in different locations with the same crosswalk length. For example, the range of clearance time in three-lane crossings varied from 9 sec to 16 sec. The data confirmed that no single method is dominant and clearance time mostly depends on designer philosophy or factors not related to intersection geometrics. Mean clearance times of 10.3, 13.7, 17.2, and 18.7 sec were found at two-lane, three-lane, four-lane, and five-lane crosswalks, respectively. Therefore, in these simulations the authors applied a 7-sec clearance time at one-lane crossings and added 3.5 sec for any additional lane. The maximum of signal cycle length was considered 120 secs in the Synchro. We did not use higher cycle lengths due to increased pedestrian waiting time and chance of committing a violation (like jaywalking) for pedestrians as well as raising the threat of spillback on the traffic flow on main roadways. All the minimum green times of pedestrians were considered during the signal design. Pedestrians at the onramp crossings at the diamond interchange had an extra protected green interval simultaneously with the green of off-ramps since there was no conflict between vehicles and pedestrians during that phase.
User Behavior Pedestrian crossing speed depends on many traffic and nontraffic parameters (such as age, gender, type of crossing, conflicting traffic volume, time of day, day of the week, etc.) and pedestrians usually tend to adjust their speed based on these
variables at the particular moment and location. Based on information from previous studies, pedestrian speed generally follows a normal distribution with the majority of speed observations (about 70–80%) near the average. Marisamynathan and Vedagiri (5) found most pedestrian speeds in their sample between 4 feet per second (fps) to 4.5 fps, while a range from 4.6 fps to 5.8 fps was noted by Ishaque and Noland (31). A study in Poland found the range of pedestrian speeds from 3.6 fps to 4.6 fps (4). The current research relied on the field data collected during a previous study on pedestrian performance at superstreet intersections (19) and the same speed graphs were used. In that study, pedestrians were categorized into two groups as “walking pedestrians” with 91% of the observations and the average speed of 5 fps, and “running pedestrians” with 9% of the observations and an average speed of 9.6 fps. Regarding the priority rule of vehicles and pedestrians on the free-flow crossings in DDI and Milwaukee A, vehicle drivers had to stop for the pedestrians when pedestrians could find a minimum gap of 3 sec or longer to initiate a crossing. The speed of cars was 70 mph on the freeway while it was defined as 60 mph for trucks. Both cars and trucks had a speed of 35 mph on arterial. The selected speeds are typical in the U.S. for these classes of roads. Fitzpatrick et al. (36) estimated the 85th percentile free-flow speed of vehicles between 13 to 21 mph and 17 to 29 mph in the center and approach of exclusive right-turn lanes, respectively. Therefore, the vehicle speed was simulated as 20 mph on the approach to a turn and 15 mph in the center of a right or left turn.
Data Analysis and Results Overall Pedestrian Performance Travel Time and the Number of Stops. The mean travel times and the number of stops in each interchange are provided in Table 2. Regarding pedestrian travel time, the Milwaukee A was the best interchange which provided faster routes for the pedestrians by a slim margin over the diamond and the parclo B. The reason for the strong travel time performance of the Milwaukee A is the existence of only one signalized
6
Transportation Research Record 00(0)
Table 3. Cycle Length, Red Light Interval, and the Estimated Waiting Time of Pedestrians Overall a
Parameters
CL (sec)
DDI Diamond Milwaukee A Milwaukee B Parclo B Synchronized
75 120 67 57 70 68
High turning
b
R Waiting CL (sec) time (sec) (sec) 43 36 31 28 32 28
44 12 14 18 21 19
61 120 62 53 67 65
R (sec)
Moderate turning
Waiting CL time (sec) (sec)
36 39 32 30 34 30
38 14 16 19 20 19
76 120 66 57 70 67
R (sec) 42 36 31 28 32 27
Low turning
Waiting CL time (sec) (sec) 41 12 14 18 18 16
89 120 73 62 74 71
R Waiting (sec) time (sec) 49 33 30 27 31 26
51 11 13 15 17 13
a
Average cycle length of scenarios. Average red interval of pedestrians (clearance time of pedestrians is included).
b
crossing for each route in the geometry; its other crossing is a free-flow one with the right-of-way for pedestrians. If pedestrians had to wait for vehicles at the free-flowing crossing the result would be much different. The Milwaukee A performance was significantly better than the other designs in the high turning conditions, where its margin was wider over the diamond and parclo B. The new Milwaukee B and synchronized interchanges had travel times that were 13 to 22 seconds higher than the Milwaukee A on average. The DDI had the worst performance in terms of travel time and the number of stops. The diamond was the best interchange in terms of the number of stops, with an average of 0.68 per pedestrian, due to its long green interval in each cycle. After the diamond, the Milwaukee A and Milwaukee B had the lowest number of stops with the values of 0.93, and 1.25, respectively. On average, the parclo B and synchronized interchanges had the same number of stops per pedestrian but the parclo B did better with higher turning volumes and the synchronized did better in low turning conditions. Safety Parameters. The number of stops should be one of the most effective variables looking at pedestrian safety. Pedestrians likely commit more violations as the number of stops increase. To elaborate on this issue, Table 3 examined the waiting time of pedestrians multiplying half of the red interval by the number of stops. Note that the number of stops is used as a factor for the probability of facing a red light in this research since pedestrians had the right-of-way for crossing at any other point of conflict with vehicles so all the stops were because of red lights. The reason for using half the red interval was to consider an average stop length for the pedestrians assuming random arrivals. Table 3 emphasized the poor performance of the DDI, with 3.6 times higher waiting times than the diamond which was the interchange with the lowest waiting times. There were three main reasons for predicting higher waiting time in the DDI in comparison with the other designs: (1) more number of stops based on Table 2, (2) the higher clearance time due to crossing longer crosswalks, especially in crossing the through traffic in the
crossovers, and (3) lower ratios of green/cycle length (G/CL) since the pedestrians had to conflict with the main flow (through traffic) in the signalized crossings in the DDI, while the pedestrians of other designs had to be stopped only against the turning traffic and were receiving green time simultaneously with the through traffic of the arterial. The diamond had the lowest waiting times overall and the Milwaukee A had the second best waiting times. The new interchange designs were generally superior to the parclo B for waiting times due to shorter red intervals. The synchronized interchange performed particularly well in low turning scenarios. Based on the literature review (4, 6, 12), the type, frequency, and size (length) of conflict points with vehicles are important parameters for pedestrian safety. The volume of conflicting traffic is also important to pedestrian safety. Table 4 shows the details regarding vehicle–pedestrian conflict points for each interchange considered. In Table 4, a “freeflowing conflict” happens where there is no signalized control and a “permissive crossing” is when both vehicles and pedestrians receive a green light simultaneously at the conflict point. The results that stand out in Table 4 are for the DDI and the Milwaukee A. All the other designs provided the same performance with four crossings of six total lanes and a total conflicting volume of 2270 vehicles per hour. On the other hand, two of the conflict points in Milwaukee A are free-flowing crossings and there are eight total lanes to cross. Most notably, because they cross and re-cross the through arterial lanes, pedestrians in a DDI face more and longer conflicting points with a significantly higher total conflicting volume.
Effective Variables on the Pedestrian Performance Table 5 presents the effect of traffic variables on pedestrian travel time and stops, including turning volume ratio, traffic distribution, percentage of truck volume, and the interactions between them. Based on consistently high F-values and consistently low significance levels, the turning condition had the
7
Mehrara Molan and Hummer Table 4. Geometric and Traffic Features of Each Interchange Network in the Conflict Points with Vehicles Free-flow crossing Parameters
N
DDI Milwaukee A Other designs
4 2 0
a
b
Permissive crossing c
Protected crossing
Total
L
V
N
L
V
N
L
V
N
L
V
4 4 0
1514 1516 0
0 0 2
0 0 2
0 0 758
4 2 2
20 4 4
2752 1512 1512
8 4 4
24 8 6
4266 3028 2270
a
Number of crossings. Total Length (number of lanes). c Total Conflicting Volume (veh/hr). b
most influence among all the parameters on pedestrian travel time in all the interchanges. The DDI and the synchronized interchange were the designs most sensitive to the turning case. The DDI performed better as the turning ratio raises while the synchronized showed an opposite reaction. The parclo B had the same behavior as the synchronized, with better performance in lower turning ratio cases, while the rest of the interchanges did not change significantly with different turning ratios. Traffic distribution was found to be important to travel time for all designs. None of the interchanges showed a significant relationship at the 0.05 level between truck percentage and travel time. Among the two-way interactions, only the interaction between turning case and traffic distribution was statistically significant in most cases examined.
Impact of Pedestrians on Traffic Operation As the last part of the evaluation in this research, the impact of pedestrians on vehicle travel time was analyzed. Table 6 presents the travel times extracted from VISSIM for runs with 360 pedestrians per hour and for runs without pedestrians. Generally, the interchanges with better vehicle travel time performance showed less vulnerability to the presence of pedestrians. According to an ANOVA conducted on the mean differences, the diamond was the only design with a significant difference at the 0.05 level between its results with and without pedestrians. The synchronized interchange and the DDI had mean differences of 6.6 sec, and 5.4 sec between pedestrian and no pedestrian cases, respectively, which were higher impacts than the Milwaukee A, Milwaukee B, and parclo B. Table 6 also shows the Milwaukee B as the best interchange in terms of vehicle travel time either in the presence or absence of pedestrians. This confirms findings from our previous research (13). Table 6 shows that the synchronized interchange can be a good substitute for a DDI in low turning cases while the DDI was more promising during higher turning scenarios.
Conclusions This paper compared the pedestrian performance of the new synchronized and Milwaukee B designs to four existing
interchanges. Pedestrian service quality is an increasingly important part of interchange alternative analyses being conducted by agencies all over the U.S., so we hoped to contribute to that portion of those comprehensive analyses. The primary research method was a series of simulation models using VISSIM and Synchro, and evaluation with ANOVA. Overall, these results should be helpful to highway agencies making choices on interchange design and trying to serve all roadway users well. The conventional diamond showed the best pedestrian operation among all the interchanges considered in the research. The Milwaukee B and synchronized interchanges trailed the diamond, Milwaukee A, and parclo B in travel times, but appear to offer relatively good pedestrian safety compared to other designs. Relatively poor pedestrian service is expected from the DDI since it got the worst ranking in all the MOEs. The diamond had the worst performance for vehicle travel time, and pedestrians affected the vehicle travel time at a diamond far more than at other designs, so a trade-off for the diamond between good pedestrian service and relatively poor vehicle service seems clear. Turning volume ratio and traffic distribution were sometimes important variables in explaining travel time and the number of stops for pedestrians while the percentage of heavy vehicles was not found to be generally significant at the levels simulated. At the levels simulated pedestrians did not impact the vehicle travel time significantly except in the case of the diamond interchange. The impact of pedestrians seemed to be higher as the traffic operations became more critical to handle. For example, pedestrians increased the vehicle travel time only about one second for the DDI during high-turning tests but the impact was raised to 13 seconds in the low-turning condition when the DDI should have a more difficult time handling the demand. Future studies should analyze driver behavior and driver expectation and reaction to pedestrians in the new interchanges using a driving simulator. Simulator or field studies regarding pavement markings, traffic signs, and pedestrian signals would be helpful to maximize the safety and operation of pedestrians in the new designs. A useful future effort could focus on versions of these designs that
8
Transportation Research Record 00(0)
Table 5. Effects of Traffic Variables on the Pedestrians MOEs of the Existing Interchanges Travel time Type
Variable
DDI
Intercept Turning case Traffic distribution Truck % Turning case–traffic distribution Turning case–truck % Traffic distribution–truck % Intercept Turning case Traffic distribution Truck % Turning case–traffic distribution Turning case–truck % Traffic distribution–truck % Intercept Turning case Traffic distribution Truck % Turning case–traffic distribution Turning case–truck % Traffic distribution–truck % Intercept Turning case Traffic distribution Truck % Turning case–traffic distribution Turning case–truck % Traffic distribution–truck % Intercept Turning case Traffic distribution Truck % Turning case–traffic distribution Turning case–truck % Traffic distribution–truck % Intercept Turning case Traffic distribution Truck % Turning case–traffic distribution Turning case–truck % Traffic distribution–truck %
Diamond
Milwaukee A
Milwaukee B
Parclo B
Synchronized
F
a
4240000 314 33.9 4.31 15.1 0.81 1.56 6050000 43.2 16.8 1.91 7.09 6.71 1.82 19400000 27.1 11.8 1.15 2.74 3.46 0.53 102000000 1330 98.5 2.50 62.5 2.50 1.00 20100000 693 478 4.61 27.6 1.15 0.30 172000000 13900 1550 1.00 315 1.00 1.00
Note: Bold represents the insignificant variables in the level of 0.05. a Variation between sample means/variation within the samples. b Sig determines whether any of the differences between the means are significant at the level of 0.05.
Stops b
Sig
0.000 0.000 0.000 0.064 0.000 0.470 0.254 0.000 0.000 0.000 0.197 0.002 0.014 0.196 0.000 0.000 0.001 0.308 0.064 0.072 0.744 0.000 0.000 0.000 0.145 0.000 0.132 0.465 0.000 0.000 0.000 0.057 0.000 0.354 0.897 0.000 0.000 0.000 0.341 0.000 0.402 0.465
F 18600 11.0 17.9 5.52 9.66 1.01 1.38 20400 16.8 6.25 0.08 6.17 0.01 1.70 11100 31.1 2.61 0.72 1.12 1.19 1.09 705000 1560 0.25 5.00 676 5.00 1.00 3620000 3610 4530 0.21 1070 1.52 1.26 621000 1850 7.64 0.93 110 1.04 1.02
Sig 0.000 0.003 0.000 0.041 0.001 0.396 0.307 0.000 0.001 0.007 0.775 0.004 0.997 0.221 0.000 0.000 0.092 0.414 0.429 0.343 0.421 0.000 0.000 0.930 0.049 0.000 0.031 0.465 0.000 0.000 0.000 0.651 0.000 0.265 0.352 0.000 0.000 0.003 0.357 0.000 0.387 0.454
9
Mehrara Molan and Hummer Table 6. Vehicle Travel Time in Different Conditions of Pedestrian Presence Overall
High turning
Moderate turning
Low turning
Interchange type
With ped
No ped
Mean diff
With ped
No ped
Mean diff
With ped
No ped
Mean diff
With ped
No ped
Mean diff
DDI Diamond Milwaukee A Milwaukee B Parclo B Synchronized
139 190 122 113 131 148
133 172 121 112 128 142
5.41 20.3a 1.14 1.81 2.11 6.61
122 188 117 112 131 159
121 172 114 110 127 146
0.96 15.6 2.50 2.08 4.33 13.08
131 208 122 113 131 144
129 174 120 113 129 141
1.78 34.8a 2.50 0.67 2.17 4.33
164 178 129 113 130 143
151 167 128 112 129 140
12.9 10.6 1.58 0.83 0.17 2.42
Note: Vehicle travel time unit is seconds. a The mean difference is significant at the level of 0.05.
are the best possible for pedestrians; in other words, how narrow could the interchanges become while still providing reasonable service to vehicles. This study attempted to cover situations that were representative of those encountered by highway agencies at actual interchanges, but of course did not cover the entire range of possibilities, so more study of the new interchanges at macroscopic and microscopic levels under a wider range of conditions would of course be helpful. Author Contributions Both the authors confirm contribution to the paper as follows: study conception and design, Amirarsalan Mehrara Molan, Joseph E. Hummer; data collection, Amirarsalan Mehrara Molan, Joseph E. Hummer; analysis and interpretation of results, Amirarsalan Mehrara Molan, Joseph E. Hummer; draft manuscript preparation, Amirarsalan Mehrara Molan, Joseph E. Hummer. Both authors reviewed the results and approved the final version of the manuscript.
References 1. Moreno, L., P. Morency, and A. El-Geneidy. Pedestrian Crash Estimation Models for Signalized Intersections. Accident Analysis and Prevention, Vol. 43, No. 5, 2011, pp. 1624–1634. 2. Transport Canada. http://tc.gc.ca/, Retrieved October 2, 2017. 3. Zhang, W., K. Wang, L. Wang, Z. Feng, and Y. Du. Exploring factors affecting pedestrians’ red-light running behaviors at intersections in China. Accident Analysis and Prevention, Vol. 96, 2016, pp. 71–78. 4. Oskarbski, J., L. Guminska, M. Miszewski, and I. Oskarbska. Analysis of Signalized Intersections in the Context of Pedestrian Traffic. Proc., 6th Transport Research Arena, Curran Associates, Inc., Warsaw, Poland, 2016. 5. Marisamynathan, S., and P. Vedagiri, P. Modeling Pedestrian Delay at Signalized Intersection Crosswalks under Mixed Traffic Condition. Proc., 2nd Conference of Transportation Research Group of India, Elsevier Ltd., 2013, pp. 708–717. 6. Brosseau, M., S. Zangenehpour, and L. Moreno. The Impact of Waiting Time and Other Factors on Dangerous Pedestrian Crossings and Violations at Signalized Intersections: A Case Study in Montreal. Transportation Research Part F, Vol. 21, 2013, pp. 159–172.
7. Pulugurtha, S., and V. Sambhara. Pedestrian Crash Estimation Models for Signalized Intersections. Accident Analysis and Prevention, Vol. 43, 2011, pp. 439–446. 8. Vaughan, C., C. Cunningham, B. Schroeder, and J. Hummer. Empirical Study and Assessment of Operational Performance of Double Crossover Diamond Interchanges. Presented at 92nd Annual Meeting of the Transportation Research Board, Washington, D.C., 2013. 9. Transportation Research Board Website. http://apps.trb.org/. Accessed April 12, 2017. 10. Milazzo, S., N. Rouphail, J. Hummer, and P. Allen. Effect of Pedestrians on Capacity of Signalized Intersections. Transportation Research Record: Journal of the Transportation Research Board, 1998. 1646: 37–46. 11. Banerjee, I., S. Shladover, J. Misener, and D. Ragland. Impact of Pedestrian Presence on Movement of Left-Turning Vehicles: Method, Preliminary Results & Possible Use in Intersection Decision Support. Safe Transportation Research and Education Center, 2004. 12. Hubbard, S., D. Bullock, and F. Mannering. Right Turns on Green and Pedestrian Level of Service: Statistical Assessment. Journal of Transportation Engineering, Vol. 135, No. 4, 2009, pp. 153–159. 13. Mehrara Molan, A., and J. Hummer. Travel Time Evaluation of Milwaukee B and Synchronized as New Interchange Designs. Journal of Transportation Engineering, Vol. 144, No. 2, 2018. https://doi.org/10.1061/JTEPBS.0000107 14. Chlewicki, G. Variations of the Diverging Diamond Interchange. Second Urban Street Symposium of TRB, Anaheim, California, 2003. 15. Reid, J., L. Sutherland, P. Brinckerhoff, B. Ray, A. Daleiden, P. Jenior, and J. Knudsen. Median U-Turn Informational Guide. FHWA-SA-14-069. Federal Highway Administration (FHWA), Washington, D.C., 2014. 16. Hughes, W., R. Jagannathan, D. Sengupta, and J. Hummer. Alternative Intersection and Interchanges: Informational Report (AIIR). FHWA-HRT-09-060. Federal Highway Administration (FHWA), Washington, D.C., 2010. 17. Hummer, J., B. Ray, A. Daleiden, P. Jenior, and J. Knudsen. Restricted Crossing U-turn Informational Guide. FHWA-SA-14-070. Federal Highway Administration (FHWA), Washington, D.C., 2014. 18. Jagannathan, R., and J. Bared. Design and Performance Analysis of Pedestrian Crossing Facilities for Continuous Flow
10 Intersections. Transportation Research Record: Journal of the Transportation Research Board, 2005. 1939: 133–144. 19. Hummer, J., A. Holzem, N. Rouphail, C. Cunningham, S. O’Brien, B. Schroeder, K. Salamati, and R. Foyle. Pedestrian and Bicycle Accommodations on Superstreets. North Carolina Department of Transportation, North Carolina, 2014. 20. Messer, C., J. Bonneson, and D. Anderson. NCHRP Report 345: Single Point Urban Interchange Design and Operation Analysis. Transportation Research Board of the National Academies, Washington D.C., 1991. 21. Diverging Diamond Interchange Website. http://divergingdiamond.com. Accessed February 8, 2017. 22. Bared, J., P. Edara, and R. Jagannathan. Design and Operational Performance of Double Crossover Intersection and Diverging Diamond Interchange. Transportation Research Record: Journal of the Transportation Research Board, 2005. 1912: 31–38. 23. Chlewicki, G. Learning from Eight Operational Diverging Diamond Interchanges in the United States. Presented at 92nd Annual Meeting of the Transportation Research Board, Washington, D.C., 2013. 24. Yeom, C., J. Hummer, B. Schroeder, C. Cunningham, and N. Rouphail. Empirical Before-After Comparison of the Operational Performance of Diverging and Conventional Diamond Interchanges. Journal of Transportation, Vol. 7, No. 1, pp. 35–56, 2015. 25. Khan, T., and M. Anderson. Evaluating the Application of Diverging Diamond Interchange in Athens, Alabama. International Journal for Traffic and Transport Engineering, Vol. 6, No. 1, pp. 38–50, 2016. 26. Highway Capacity Manual 2010. Transportation Research Board of the National Academies, Washington, D.C., 2010. 27. Ghasemzadeh, A., and M. Ahmed. Drivers Lane-Keeping Ability in Heavy Rain. Transportation Research Record: Journal of the Transportation Research Board, 2017. 2663: 99–108.
Transportation Research Record 00(0) 28. Mehrara Molan, A., and A. Kordani. Optimization of Speed Hump Profiles Based on Vehicle Dynamic Performance Modeling. Journal of Transportation Engineering, Vol. 140, No. 8, 2014. 29. Olya, M. H. Applying Dijkstra’s Algorithm for General Shortest Path Problem with Normal Probability Distribution Arc Length. International Journal of Operational Research, Vol. 21, No. 2, 2014, 143. 30. Kordani, A., and A. Mehrara Molan. The Effect of Combined Horizontal Curve and Longitudinal Grade on Side Friction Factors. Journal of Civil Engineering, Vol. 19, No. 1, pp. 303– 310, 2015. 31. Ishaque, M., and R. Noland. Pedestrian and Vehicle Flow Calibration in Multimodal Traffic Microsimulation. Journal of Transportation Engineering, Vol. 135, No. 6, 2009. 32. Schroeder, B., K. Salamati, and J. Hummer. Calibration and Field Validation of Four Double-Crossover Diamond Interchanges in VISSIM Microsimulation. Transportation Research Record: Journal of the Transportation Research Board, 2014. 2404: 49–58. 33. Eustace, D., and S. Ponnada. L&D Manual Turn Lane Storage Validation/Update. Report No. FHWA/OH-2012/13. Ohio Department of Transportation, 2012. 34. Mehrara Molan, A. Evaluation of Milwaukee B and Synchronized as New Service Interchange Designs. PhD dissertation. Wayne State University, Detroit, 2017. 35. Mehrara Molan, A., and J. Hummer. Safety Analysis of the New Synchronized and Milwaukee B Interchanges in Comparison to Existing Designs. Journal of Accident Analysis and Prevention, Vol. 109, 2017, pp. 29–35. 36. Fitzpatrick, K., W. Schneider, and E. Park. Predicting Speeds in an Urban Right-Turn Lane. Journal of Transportation Engineering, Vol. 132, No. 3, 2006. The Standing Committee on Pedestrians (ANF10) peer-reviewed this paper (18-00146).