Simulation of bridge die extrusion using the nite element method I. Flitta and T. Sheppard This communication reviews previous work on the extrusion of hollow shapes and uses a three-dimensional (FEM) solution to predict load-required, temperature of the extrudate and material ¯ ow during the process. A comparison with experiments is made to assess the relative importance of some extrusion parameters in the extrusion process and to ensure that the numerical discretisation yields a realistic simulation of the process. The usefulness and limitations of FEM when modelling complex shapes is also discussed. Methods to assess the dif® culty of extrusion of hollow extrusions in general are presented. The paper also illustrates the essentials of numerical analysis to assist the reader in the comprehension of the thermomechanical events occurring during extrusion through bridge dies. Results are presented for velocity distribution in the extrusion chamber, iso-temperature contours and pressure/ displacement traces. These are compared with experiments conducted using a 5 MN press. It is shown that the ® nite element program predicts the pressure requirement: the pressure/displacement trace showing a double peak which is discussed in some detail. The ® nite element program appears to predict all the major characteristics of the ¯ ow observed macroscopically. MST/5236 Mr Flitta (i¯
[email protected]) and Professor Sheppard (
[email protected]) are at Bournemouth University, Studland House, 12 Christchurch Road, Bournemouth BH1 3NA, Dorset, UK. Manuscript received 6 September 2001; accepted 1 November 2001. # 2002 IoM Communications Ltd. Published by Maney for the Institute of Materials, Minerals and Mining.
Introduction Aluminium extrusion is the most common method used to produce solid and hollow shapes. Solid pro® les are generally produced with a die that consists of only one part, while hollow pro® les are produced with at least two parts, a die and a mandrel. The production of tubes represents an important activity in commercial extrusion. In order to extrude hollow sections, the billet has to be pressed through a die that determines the outside diameter, and over a centrally located mandrel that determines the inside diameter. The metal must, therefore, ¯ ow through an annular gap. For the extrusion of hollow aluminium pro® les this is achieved by the use of the dies following the principles laid down by Dick.1 There are three types of hollow die: bridge, porthole, and spider dies, which substantially increase the market for aluminium sections. The dies contain a weld chamber in which the stream of ¯ owing metal is ® rst divided into distinct streams and consequently rejoined by a pressure weld before passing through the die. Therefore, extruded sections produced on such dies have one or more seams or longitudinal weld lines. Because the separate metal streams are joined within the die without atmospheric contamination, a perfectly sound weld is usually obtained. Extrusion of the 6000 alloy series through bridge dies producing hollow shapes is common in the aluminium industry. One of the largest problems in tube extrusion is tube eccentricity reported by Sheppard et al.2 which affects the quality of the product and is generally due to poor design of the welding die. There are a number of experimental investigations conducted in to the study and prediction of conditions occurring during the extrusion process in the welding chamber.3 ± 5 Few of them, however, attempt to quantify the process. The complexity of metal ¯ ow calls for simulation of the complete process in three-dimensions. The ® nite element method (FEM) also gives new and important information, since local values for temperature, stress, and velocity within the deformation zone are not readily accessible by experiments. The research related to metal forming processes during the last few decades has widely used FEM in their investigations. However, it is only during the last decade that DOI 10.1179/026708302225004946
useful numerical simulations of aluminium extrusion have been reported. This is partially due to the nature of the process demands and the excessive time required for computation. Early work was mainly involved with 2D extrusion problems2 ,6 ± 1 1 or simple 3D geometry with low extrusion ratio.1 2 ± 15 Some have been experimentally veri® ed.1 6 ± 21 Despite the fact that temperature evolution and distribution are of paramount importance in the extrusion process, very few publications pay attention to this aspect.1 8 ,20 ± 2 2 During bridge die extrusion this is an important factor because the quality of the joints along the entire length of the ® nal product are primarily determined by the conditions in the welding chamber.2 3
Finite element modelling formulation GOVERNING EQUATIONS A commercial ® nite element package FORGE3 (Refs 24 and 25) developed by Transvalor (France) was used to simulate the extrusion of aluminium 6063 alloy through a bridge die. The model used for this simulation is described by Chenot.2 6 ,2 7 The data structure of the program include, the governing equations, the ® nite element of the workpiece, the rheology of the material, the tooling description, the frictional interface, and the numerical parameters to be included in the calculation code. The program uses implicit FEM to calculate the hot working parameters: load, strain rate, temperature rise and deformation. A Lagrangian method is adopted for the program which can thus accurately de® ne the material properties, state variables and boundary conditions. The temperature evolution in the deformation zone is governed by internal heat conduction and internal heat dissipation under the constraints de® ned on the area boundary in terms of interchange (radiation, conduction, and convection) or in terms of imposed temperature. This evolution is represented by the following heat equation
¶T ~div(k grad T ) + Q : : : : : : : : (1) ¶t where q is the density, c the speci® c heat, T the temperature, q
c
Materials Science and Technology
September 2002 Vol. 18
987
988 Flitta and Sheppard Simulation of bridge die extrusion using ® nite element method
Q the internal heat dissipation generated by plastic deformation, and k the thermal conductivity. The temperature ® eld in the billet or in the die is computed using equation (1). The work generated by the plastic deformation is largely dissipated in terms of heat inside the body, an insigni® cantly small amount being retained within the material. In addition to the above governing equation, boundary conditions to describe geometry and friction are required. Friction can be dealt with by assuming the Tresca yield criterion and is written as follows r s
~{m p
s
3
:
:
:
:
:
:
:
:
:
:
:
:
: (2)
where s is the shear stress at the interface, r s represents the yield stress, r s / Ö 3 is usually termed the shear ¯ ow stress, and m is commonly referred to as a friction factor and varies between m~0 for perfect lubrication and m~1 for sticking friction. The Tresca law treats the interface friction as pressure independent and relates the friction stress directly to the shear ¯ ow stress of the deformed material. In the FORGE2 and FORGE3 programs, the Norton ± Hoff law describes the default rheology of the material. However, in order to obtain reliable results with a high degree of con® dence, it is important to reduce the errors due to approximate data used to describe the material behaviour. Experience shows that some differences can appear between the numerical predictions and experimental results. Part of these variations results from discretisation of the problem (® nite element method); however, inaccuracy often occurs from using data not calculated for the speci® c alloy over the complete working range. The most widely used equation to describe the deformation of aluminium alloys, is that proposed by Sellars and Tegart2 8 and subsequently modi® ed by Sheppard and Wright2 9 to yield the steady state ¯ ow stress r ¯ from the equation
DH GT
Z~A‰sinh(a rÅ ) Šn ~Å e Ç exp from which
År ~ a
1
8 < Z ln : A
1 =n
+
"
Z A
2=n
+1
#1 =2 9 = ;
:
:
:
:
(3)
where Z is termed the temperature compensated strain rate; DH is the activation energy for deformation;. G is the universal gas constant (8.314 J mol 1 K 1 ); e¯ is the mean equivalent strain rate; A, a , and n are constants; and T is the initial billet temperature
SIMULATION CONSIDERATIONS The simulation approach is based on a viscoplastic constitutive model. This type of model neglects the elastic behaviour of the material, because of the fact that hot aluminium has rate dependent behaviour and that the elastic deformations are small when compared to the large plastic deformations that occur during the process.2 3 The de® nition of the tooling is one of the essential data inputs that have to be integrated into the simulation calculation. Consequently, both for the geometry (the precision of the boundary) and the kinematics (to follow the mechanical deformation), simulation must be designed accurately. The accuracy of the results is closely related to the meshing quality. In FORGE3, the meshing is based on two concepts: the quality of the elements and shape preservation (geometry). These two concepts are quanti® ed and controlled by the user. The strategy to obtain the `best’ mesh is based on node addition, suppression, and regularisation to improve an existing given surface or to rebuild a new surface from an intial one. These should be done without modifying the domain Materials Science and Technology
September 2002 Vol. 18
1
Half model of bridge die mandrel assembly
geometry (shape preservation). In order to generate a volume mesh, the program requires an initial triangular surface mesh with three node linear triangles. The quality of this volume mesh depends on surface mesh quality of the part (billet) imported from a CAD system. During the simulation of extrusion, large deformations are predominant which require a Lagrangian mesh to be de® ned. Thus, complete remeshing which is mandatory in areas of excessive deformation is a source of loss/gain of volume. The elements become severely distorted during the process and consequently, remeshing is needed to continue the simulation. The frequency of remeshing is controlled by the degree of deformation and is a user variable. Therefore, careful judgement for the mesh re® nement is required and the user must be able to identify the locations that need remeshing and call for local remeshing. This is crucial to minimise the computation volume.
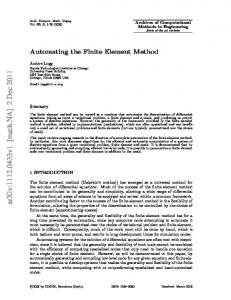
PRE-PROCESSING In the present investigation a bridge die having three legs was used, thus producing three welded seams in the tube extrudate. The die had two parts; the upper portion which acted as a sleeve for the bridge and the lower portion which formed a welding chamber and the die ori® ce (Fig. 1). The tooling geometry of the bridge die and the billet were modelled using the I-DEAS Master-Series software. Taking advantage of the symmetry planes in the design and in order to reduce computation time, 1/6 of the models were constructed (Fig. 2). A surface mesh (two-dimensional) was then generated using three node linear triangles corresponding to the outer surface of the tooling and the billet as shown in Fig. 2. Once these models were built and meshed in 2D, the ® nite element model information was imported using the FORGE3 program algorithm in order to check the surface quality of the tools and to generate the three-dimensional volume mesh for the billet using four node tetrahedral elements. To control the degree of remeshing in the areas where high deformation is expected, ® ne re® nement mesh boxes of the Eulerian type (but maintaining Lagrangian ¯ ow) were applied to the billet. The remeshing values are controlled by the average target size of an element and the distribution is speci® ed by `mesh-boxes’ , i.e. boxes that de® ne regions of the mesh on which a mesh size is imposed during the computation. In this investigation, three boxes were de® ned in what are considered the most important areas in the billet during the deformation. The ® rst re® nement was applied
Flitta and Sheppard Simulation of bridge die extrusion using ® nite element method 989
3
2 Computer aided design model and mesh of outer surface of bridge die mandrel assembly
just before the material started to ¯ ow around the core support (mesh-box1). The second re® nement was applied just before the material commenced to weld in the welding chamber (mesh-box2). The ® nal re® nement was applied just before the material started to ¯ ow through the die ori® ce (mesh-box3). The aimed mesh size re® nement value of 1 .5 mm was imposed for mesh-box 1 and 2 and a value of 1 mm for mesh-box3. The average initial mesh size in the billet was 4 mm.
FEM models and source of experimental data The chemical compositions of the alloys used in this investigation are given in Table 1. All the experimental data are extracted from the literature.3 0,31 Experiments were performed on a 5 MN vertically mounted extrusion press with a heated container. The main ram was driven by a hydraulic pump during the extrusion cycle. The load was measured by Mayes load cell situated directly above the ram, the output from the cell being recorded on a Labmaster data recorder. Table 1 Chemical wt-%23
composition
Alloy Cu
Fe
Mg
of
Si
aluminium
Mn
Ti
Zn
alloys, Al
2024 3.8 ± 4.9 1. 2 ± 1.8 0.5 0. 5 0.3 ± 0 .9 0.15 0. 25 Bal. 6063 0.1 2. 0 0.45 ± 0.9 0. 2 ± 0.6 0.10 0.10 0. 10 Bal.
Rod extrusion: computed load v. time for direct extrusion
Ram displacement and speeds were measured by a rectilinear potentiometer ® xed between the moving crossheads and the press bolster. The input data for the bridge die simulation is summarised in Table 2. The dimensions of the billet are 75 mm dia. and 100 mm length. The dimensions of the extruded tubes are given in Table 2. The initial container temperature was 50 °C below that of the initial billet temperature (450 °C) to simulate industrial conditions.2 3 The billet was extruded at a constant ram speed of 3 mm s 1 . The mathematical models were analysed using the viscoplastic solution algorithm of FORGE3. The data describing the material behaviour available to the authors were obtained using torque ± twist data from torsion tests and optimising to obtain the form of equation (3). Alloys reported in this communication were 6063 and 2024 aluminium alloys.2 3 As a result, in the simulations conducted in this paper, the modi® ed Sheppard ± Wright law was programmed and used to describe the material behaviour. In the extrusion process the areas in which small strains occur can be ignored because they do not affect either the pressure or the properties. Equation (3) is adequate to describe the rheology of the material. Simulations were conducted on a Dell dual processor workstation.
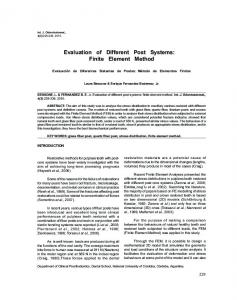
MODEL VALIDATION Simulations of rods for which experimental results were available were utilised to validate the numerical models used by FORGE3 software. This ensured that numerical discretisation functioned satisfactorily. The experimental results were for 2024 alloy extruded in a temperature range between 300 and 450 °C, identical strain rate, and extrusion ratio of 30 : 1. The comparisons of major interest are the extrusion load and die exit temperature since if these are coincident then a valid numerical simulation model of the process may be assumed. The input data for the simulation of rod extrusion is summarised in Table 2. Typical load v. time curves for rod extrusion are shown in Fig. 3. All the curves show the initial stages of extrusion to be characterised by a rapid increase in load as the billet is upset to ® ll the container. During this stage a very small amount of extrusion takes place. The curves also show a
Table 2 Rheology data input and dimensions used for computer simulation23 Flow stress data
Dimensions (mm)
Alloy a
n
DH, kJ mol 1
ln A
T (°C)
Product
ER*
o.d.*
i.d.*
WT*
2024 6063
0. 016 0. 04
4.25 5.385
148880 141550
19.6 22.5
300 ± 450 450
Rod Tube
30 29.2 70
¼
0 8 8
¼
16 12
4 2
* ER extrusion ratio; o.d. outside diameter; i.d. inside diameter; WT wall thickness.
Materials Science and Technology
September 2002 Vol. 18
990 Flitta and Sheppard Simulation of bridge die extrusion using ® nite element method
4 Comparison of experimental and computed peak extrusion load as function of initial billet temperature
`peak pressure region’ which agrees with observations ® rst reported by Castle and Sheppard.3 2 The authors show in a previous communication that this `peak’ pressure is connected with the formation of the dead metal zone. After the end of this region, there is an abrupt fall in load which also agrees with the observations reported by Castle and Sheppard3 2 followed by a more gradual decrease as the billet length decreases. This gradual decrease in the load results from the temperature rise generated during the extrusion cycle and the reduction in friction as the billet is extruded. The effect of the initial temperature on the peak pressure for the predicted and experimental loads is shown in Fig. 4. The ® gure shows a good correlation indicating that the discretisation of the FEM method is more than ef® cient in producing the necessary simulation.
Results and discussion Although some of the ® gures presented show illustration of greater than 1/6 of symmetry, the analyses, in all cases, were conducted only for 1/6 of the model. Most of the ® gures are more or less carefully de® ned in the discussion. In order to assist the reader some of the terminology used more frequently to describe the features of the ® gures are; (i) `step’ is used to describe the succession of metal ¯ ow in Fig. 5. (ii) DMZ is used to describe the location of dead metal zones in Fig. 6. (iii) `zone’ is used to describe the heavy shear zones in Fig. 6 (iv) `region’ is used to describe the pressure ± displacement curve in Fig. 7.
METAL FLOW IN TUBE EXTRUSION When extruding with a bridge die, there are many surfaces in contact with the material. The die has two parts, the upper portion which forms a welding chamber and the lower portion which consists of the die ori® ce. The metal during the process undergoes severe deformation to adapt to the new shapes following a streamline course of ¯ ow determined in accordance with the geometrical conditions of the die. Therefore, the ¯ ow pattern during the extrusion process is very complex compared with a normal extrusion. There are three material ¯ ow streams of which each stream ¯ ows around the central axis. Hence, metal ¯ ow through a bridge die can be described as a succession of four steps: division of the metal, circumferential extrusion, joining of the metal, and formation of the tube. Successive steps occurring during the extrusion of tubes using bridge die and the corresponding ¯ ow vectors at each Materials Science and Technology
September 2002 Vol. 18
step are shown in Fig. 5. During the ® rst step (Fig. 5a), the billet is upset to ® ll the container, the material divides into three sections after encountering the bridge and the surface of the upper die portion. This produces the three metal streams which initially show only a vertical component of the ¯ ow vectors. At this stage the metal is not in contact with the welding chamber. In the second step of the process, each part of the material then ¯ ows along the bridge before entering the lower portion of the die. Subsequently, each stream approaches and contacts the lower surface of the die, i.e. the welding chamber, and ¯ ows tangentially into the space beneath the bridge as shown in Fig. 5b. This leads to circumferential ¯ ow of the extrusion. These streams of material are then brought into intimate contact and bonded to one another as shown in Fig. 5 c (third step). Excessive shear is induced causing a large component of the velocity vector to become circumferential, thus, permitting individual streams to bond and produce a seam weld in the extrudate. Formation of the weld lines is the result of solid state welding involving circumferential extrusion in which metal ¯ ow has been distorted severely beneath the bridge legs. The ® nal stage is shown in Fig. 5 d (fourth step), the material in the welding chamber is extruded to form the tube effected by the mandrel attached beneath the centre of the bridge and suspended in the centre of the die ori® ce. It is clear that the ¯ ow through the bridge and over the mandrel is in very close agreement with experimental ® ndings.2 ,3 0 The remaining dead metal zones (DMZs) in the die during extrusion are shown in Fig. 6 and represented by those zones in which the pro® le velocity is zero. The ® gure shows the dead metal zones in the die during extrusion. As the extrusion proceeds, there is a tendency for relative motion between the billet and the interfaces (container/ bridge/welding chamber). Because of the high shearing forces generated at these interfaces, DMZs are formed during extrusion. This material remains sensibly stationary through the process. It can be seen that the DMZs form at the container adjacent to the surface of the upper portion of the bridge die (DMZ1) and the area above the bridge (DMZ2). These two locations are established just after the material passes through the bridge. The centre part of the billet travels forward more rapidly than the sides, which are held back above the shoulders of the die. In the welding chamber the front of each extruded stream encounters the die face and sticks; ® rst at the circumference of the die and then spreading almost to the inner die corner. This causes circumferential extrusion as shown in Fig. 5b, leaving a DMZ in the chamber (DMZ3). The deformation is more severely distorted in the welding chamber than the container. Beneath the bridge (DMZ4) and near the mandrel and mandrel base (DMZ5) where small DMZs are formed. DMZ3 and 4 were established after the material started to extrude. DMZ4 would be expected to increase the peak pressure. The deformation zones which form the inner and outer surface of the extrudate are termed surface generation zones and are shown in Fig. 6 as Zone1 and Zone2. The metal forming the outer surface of the tube originates from the metal bounding the DMZ3 and the surface generation Zone1, the metal forming the inner surfaces, from the metal bounding the DMZ4 and the surface generation zones adjacent to the mandrel Zone2. At these locations, the metal is forced into contact with the DMZs formed by the complex shape of the die and the bridge. The metal forming the centre of the tube originates from the metal which undergoes heavy shear in Zone3. Reference to Fig. 6 also indicates that these zones originate from the interior of the billet in the intense shear zones. This is due to the interaction of DMZ3 and 4 with the Zones 1 and 2 respectively and the position of greater deformation as the material approaches the die in Zone3.
Flitta and Sheppard Simulation of bridge die extrusion using ® nite element method 991
5 a metal passing the bridge; b ¯ owing sideways beneath the bridge; c ® lling weld chamber and formation of weld line; d passing through die
PRESSURE PREDICTION CURVE AND TEMPERATURE PROFILE FOR TUBE EXTRUSION There is little in the literature concerning the pressure required for the extrusion of multi-holes or extrusion using bridge or porthole dies. The prediction of peak pressure is
critical because it determines the pressure capacity required to extrude the billet under extrusion conditions. An estimate of the pressure required to extrude through a bridge die may be produced by considering the operation as two separate extrusions: the pressure required to force the metal into the weld die and the pressure required to extrude the tube from the weld chamber. Materials Science and Technology
September 2002 Vol. 18
992 Flitta and Sheppard Simulation of bridge die extrusion using ® nite element method
7
6 Dead metal zone formation represented by velocity ® eld
The pressure ± displacement curve is shown in Fig. 7. The locus for the bridge extrusion is considerably more complex than normal rod extrusion, this is logical since there are four separate extrusion stages ( see Fig. 5) compared with the almost single operation required for rod extrusion. Flow through the bridge die results in the pressure curve being similar to the curve for normal rod extrusion after the peak pressure has occurred. The curve can conveniently be divided into six regions. The billet is upset to ® ll the container and the pressure rises rapidly to the ® rst peak value (® rst breakthrough pressure) after encountering the bridge and the surface of the upper die portion. Some material has already been extruded past the bridge. When the pressure reaches the ® rst peak value, the DMZs in the billet (DMZ1 and 2 in Fig. 6) have been established where the material is held back by the shoulders of the container and above the bridge (region 1, Fig. 7). Pressure then decreases slightly from the ® rst peak pressure as the material continues to pass the bridge and ® ll the die chamber. This is due to the slight rise in temperature in the billet caused by the work done when the material passes through the upper portion of the bridge (region 2 in Fig. 7). As soon as the metal streams contact the welding chamber as shown in Fig. 5 b, a small incremental rise in pressure can be discerned followed by a steep rise in pressure when the metal ® lls the chamber. This pressure rise is needed to overcome the increase of frictional resistance associated with the increase in the contact surface area of the welding die to produce suf® cient energy for the bonding process (regions 3 and 4 in Fig. 7). Subsequently, the pressure rapidly rises to the second peak value allowing extrusion to commence and to force the material through the mandrel/ die gap. Some material has already been extruded through the die ori® ce and when the pressure reaches its peak value, DMZ3, 4 and 5 are completely formed in the die chamber (region 5 in Fig. 7). The pressure falls from the second peak value and so called steady state extrusion will be established. A gradual fall in pressure can be seen in this region which can be attributed to the decreasing billet length, and hence decreasing friction, and the decrease in ¯ ow stress due Materials Science and Technology
September 2002 Vol. 18
Predicted pressure ± displacement curves
to the temperature rise. When the back of the billet approaches the bridge apex the metal ideally is cropped, allowing the introduction of a further billet. Therefore very little scrap is formed. This concurred with experimental observations observed by Sheppard et al.2 The occurrence of the peak in the pressure displacement curve is a result of the combined effect of the `three maxima’ ¯ ow formed from the three streams in the die chamber and the friction of the mandrel which produces the effective strain for the extrusion. Sheppard and Wood 3 3 and Sheppard et al.2 3 presented formulae for pressure prediction as given below
P~År
4 LB p + Dp : DB 3
0 :17 + 1 :86 ln(k 2 R) +
:
: (4)
LB represents the billet length, Z is the Zener ± Hollomon constant and is the same as in equation (3), k is the shape factor, R is the modi® ed extrusion ratio, and Dp is the additional pressure to initiate extrusion and for 6063 aluminium alloy is equal to
Dp~6 :62 + 0 :921
ln(Z=A) a
n
:
:
:
:
:
:
:
:
: (5)
It was found that equation (4) gives a good correlation between the predicted and experimental extrusion pressure data in aluminium alloys. However, this has been proved true only over a limited range of extrusion conditions. There is no evidence to show the equation (4) can deal with, for example, tube incorporating thin ® ns at internal or external surfaces. The pressure required for stages 1, 2, and 3 in Fig. 7 is dependent on the extrusion temperature and the extrusion ratio of the metal passing the bridge. Furthermore, the pressure required for stages 4, 5, and 6 also in Fig. 7, is dependent on the rise in temperature from the previous stages in the welding chamber and the extrusion ratio of the metal leaving the chamber and passing through the mandrel ± die gap. The rise in temperature is due to the heat generated from the work done in the metal passing the upper portion of the bridge, the friction in overcoming the surface contact area inside the welding chamber, and in the metal passing through the die to produce the tube. Consequently, the variation in the pressure for the ® rst three steps at different temperatures affects the total pressure required to extrude the tube. Equation (4) does not take into account the temperature rise during the ® rst three stages and is based on initial billet temperature. Equation (4) is derived from an axisymmetric upper bound solution and thus cannot be as accurate as the FEM solution (which is a re® ned upper bound). Furthermore, in equation (4) and in general in all empirical formulae, it may not be possible to account for the geometrical complexity of the dies other than simple tubes and the intricacy of the consequent ¯ ow could present a problem. Hence, FEM
Flitta and Sheppard Simulation of bridge die extrusion using ® nite element method 993
8 Temperature evolution for an extrusion ratio of 29.2 : 1
codes which by de® nition are analytical have a great advantage over semi-empirical formulae in predicting the main parameters before and after the so called steady state is achieved. In this investigation, the value of the peak pressures, 623 and 975 MPa for the two extrusion ratios 29.2 : 1 and 70 : 1 respectively agreed with those observed experimentally predicting a 5 and 4% difference respectively (593 and 937 MPa). 3 0 The multi-step extrusion distorts the metal ¯ ow more severely and increases the friction due to an increase in the area of billet/tool interface. Therefore the complex shear leads to an increase in the pressure; particularly for the high extrusion ratio. Complex thermal exchanges begin as soon as the extrusion commences. The most critical temperature is clearly the die exit temperature of the extrudate, which depends on heat balance history commencing at the upsetting stage of the operation. The temperature evolution simulated in the tube extrusion is shown in Fig. 8. The ® gure shows that there is a small increase in temperature of the billet after encountering the bridge and the upper die (453 °C for both extrusion ratios). The maximum temperature occurs at the die exit and it is 470 and 493 °C for the two extrusion ratios 29 .2 : 1 and 70 : 1 respectively. This is caused by the work done as the material ¯ ows through the die ori® ce and by the friction which is converted into heat at the die exit during extrusion and consequently results in an increase in the extrusion temperature. The heat generated near the die exit increases the local temperature. However, the temperature in the billet at the container surface thus appears lower than the actual temperature (449 °C). Unlike the FORGE2 program, where the meshing of the tooling through the thickness is possible for thermocouple analysis as illustrated in Fig. 9, in the FORGE3 program, the tooling can only be surface meshed (rigid die). This results in the contour appearing to be of in® nite thickness and hence promotes a slightly
a meshed tools; b rigid tools
9
Temperature evolution for rod extrusion (450°C initial billet temperature, extrusion ratio 30 : 1)
slower apparent heat exchange rate. It can be seen from Fig. 9 a for the 2-D simulation using FORGE2, that there is thermal exchange between the billet and the container wall. It also demonstrates there is a temperature increase at the billet surface caused by friction at the container wall (initial tooling temperatures are 50 °C below the billet temperature). Ignoring the meshing of the tools as shown in Fig. 9 b gives a differing distribution of the temperature at the interface and an exit temperature of 485 °C compared with 495 °C in Fig. 9 a when we are able to mesh the tools. Hence, the 10 °C difference in the exit temperature probably accounts for the difference observed between the experimental and predicted pressure in 3-D tube extrusion. The critical role of tool meshing on the temperature evolution Materials Science and Technology
September 2002 Vol. 18
994 Flitta and Sheppard Simulation of bridge die extrusion using ® nite element method
and exit temperature is thus very clear. However, since the container and the die were at 50 °C below the initial billet temperature (450 °C) for the tube extrusion, they acted as a heat sink to the metal. Consequently the boundary conditions for heat ¯ ow in the tooling might have a signi® cant effect on the cooling of the billet. Although we might expect a higher temperature rise than observed, the reader should recall that the velocity of the ram was just 3 mm s 1 , which is slow for this alloy. The bridge die would however be better modelled by assigning to it a higher temperature than 50 °C below the initial billet temperature. There is, however no doubt that the assumed temperature of the tooling resulted in a lower ® nal material temperature. Hence, a slightly greater force was needed to extrude the material. The temperature rise was expected as a result of the work done in upsetting the billet, and the work done against friction between the material and the tooling during extrusion. These contribute only relatively slightly to small changes in the mean temperature due to the heat ¯ ow to the container, but the effect of friction on the surface temperature is more signi® cant. Despite these minor errors in boundary conditions the results are very close to the experimental data. However, this might be the subject of further research.
5.
6.
7.
8. 9.
10.
11.
12.
13.
Conclusion s 1. The FEM codes Forge 2 and 3 with programmed hyperbolic sine function provided a suitable model for simulation for simple rod extrusion and complex tube pro® le. 2. In the current investigation the prediction of the metal ¯ ow and dead metal zone formation in bridge die extrusion is seen to be in good agreement between simulation and experimental ® ndings.3 0 ,3 1 3. Finite element simulation successfully predicted the origin of differing sections of the extrudate which ¯ ows from varying portions of the deformation zones. 4. The pressure prediction curve produces two peak pressures as well as a small pressure rise when the metal ® lls the welding die. 5. Empirical equations, which appear to be adequate to predict pressure requirements, will not predict either metal ¯ ow or ® nal temperatures. There is therefore a requirement to re® ne the FEM approach by further research.
14. 15. 16. 17. 18.
19.
20.
21.
22. 23.
Acknowledgements
24.
The authors would like to express their appreciation to Dr E. Nisatatanaporn and Dr J. Subramaniyan and recognise the excellent contribution from their experimental work. The provision of facilities by Bournemouth University is also gratefully recognised.
References 1. a. dick: GB Pat. 99405, UK Patent Of® ce, London, March 1897. 2. t. sheppard, e. nisatatanaporn, and b. h. mcshane: Z. Metallkd., 1998, 89, 5. 3. r. akeret: Proc. 5th Int. `Aluminum extrusion’ Tech. Seminar, Chicago, IL, USA, May 1992, Aluminum Association, 319 ± 336. 4. h. valberg: Proc. 6th Int. `Aluminum extrusion’ Tech.
Materials Science and Technology
September 2002 Vol. 18
25. 26.
27. 28. 29. 30. 31. 32. 33.
Seminar, Chicago, IL, USA, May 1996, Aluminum Association, 213 ± 224. i. duplanCÏ iCÂ and j. prgin: Proc. 6th Int. `Aluminum extrusion’ Tech. Seminar, Chicago, IL, USA, May 1996, Aluminum Association, 225 ± 300. j. kusiak et al.: Proc. 6th Int. `Aluminum extrusion’ Tech. Seminar, Chicago, IL, USA, May 1996, Aluminum Association, 361 ± 367. h. g. a. mooi et al.: Proc. 6th Int. `Aluminum extrusion’ Tech. Seminar, Chicago, IL, USA, May 1996, Aluminum Association, 359 ± 368. t. welo, a. smabrekke, and h. valberg: Aluminium, 1995, 71, (1), 90 ± 94. c. devadas and o. celliers: Proc. 5th Int. `Aluminum extrusion’ Tech. Seminar, Chicago, IL, USA, May 1992, Aluminum Association, 359 ± 368. g. e. macey and m. salim: Proc. 5th Int. `Aluminum extrusion’ Tech. Seminar, Chicago, IL, USA, May 1992, Aluminum Association, 247. g. grasmo, k. holthe, s. storen, h. valberg, r. flatval, l. hanssen, m. lefstad, o. lohne, t. welo, r. orsund, and j. herberg: Proc. 5th Int. `Aluminum extrusion’ Tech. Seminar, Chicago, IL, USA, May 1992, Aluminum Association, 367 ± 376. k. i. mori, k. osakada, and h. yamaguchi: in 3rd Int. Conf. on `Computational plastisticity’ , (ed. D. R. J. Owen), 1139 ± 1149; 1992, Swansea, Pineridge Press. m. kiuchi, m. j. yanagimoto, and v. mendoza: in `Simulation of materials processing: theory methods and applications’ , (ed. Shen and Dawson), 847 ± 852; 1995, Rotterdam, Balkema. y. s. kang and d. y. yang: Int. J. Mach. Tools Manufact., 1996, 36, 907. d. y. yang, k. park, and y. s. kang: J. Mater. Process. Technol., 2001, 111, 25 ± 30. b. s. kang, b. m. kim, and j. c. choi: J. Mater. Process. Technol., 1994, 41, 237 ± 248. h. valberg and t. malvik: Int. J. Mater. Prod. Technol., 1994, 9, 428 ± 463. r. j. dashwood and h. b. mcshane: Proc. 6th Int. `Aluminum extrusion’ Tech. Seminar, Chicago, IL, USA, May 1996, Aluminum Association, 331 ± 339. m. plata and j. piwnik: Proc. 7th Int. `Aluminum extrusion’ Tech. Seminar, Chicago, IL, USA, May 2000, Aluminum Association, 205 ± 211. i. flitta and t. sheppard: Proc. 7th Int. `Aluminum extrusion’ Tech. Seminar, Chicago, IL, USA, May 2000, Aluminum Association, 197 ± 203. i. flitta and t. sheppard: Proc. 7th Int. `Aluminum extrusion’ Tech. Seminar, Chicago, IL, USA, May 2000, Aluminum Association, 141 ± 147. t. chanda, j. zhou, l. kowalsi, and j. duszczyk: Scr. Mater., 1999, 41, 195 ± 202. t. sheppard: `Extrusion of aluminium alloys’ 1999, Boston, MA, Dordrecht, Kluwer Academic Press. j.-l. chenot et al.: `Internationl conference on forging and related technology’ , ICFT’ 98, April 1998, 113 ± 122; Bury St Edmunds, Professional Engineering Publishing. FORGE3, Version 5.3, `Software manual’ , Transvalor SA, Sophia Antipolis, France, 2001. j.-l. chenot and m. bellet: in `Numerical modelling of material deformation processes: Research, development and applications’ (ed. P. Hartley et al.), 179 ± 224; 1992, London, Springer Verlag. j.-l. chenot: J. Mater. Process. Technol., 1992, 24, 9. c. m. sellars and d. tegart: Int. Met. Rev., 1972, 17, 1. t. sheppard and d. wright: Met. Technol., 1979, 6, 215 ± 223. e. nisatatanaporn: PhD Thesis, London University (Imperial College), UK, 1995. j. subramaniyan: PhD Thesis, London University (Imperial College), UK, 1989. a. f. castle and t. sheppard: Met. Technol., 1976, 3, 465 ± 475. t. sheppard and e. p. wood: Proc. 17th Machine Tool Design and Research Conf., Birmingham, UK, September 1976, 411 ± 421; 1976, London, McMillan.