Lisa Blanshard, Kerstin Kleese van Dam @ CCLRC Daresbury Laboratory; Richard Catlow @ Royal. Institution; Sally Price @ UCL. Key words to describe the ...
SIMULATION OF COMPLEX MATERIALS: DATABASE DESIGN FOR METADATA Lisa Blanshard, Kerstin Kleese van Dam @ CCLRC Daresbury Laboratory; Richard Catlow @ Royal Institution; Sally Price @ UCL
Key words to describe the work: Database Design, Metadata, Data Management, Portal, Material Science
Abstract: CCLRC is involved in the development of grid and data management tools for the Simulation of Complex Materials e-Science project [7]. The aim of the project is to bring together computer and computational scientists with the aim of exploiting these technologies for key current areas of materials science relating to: • •
the development of combinatorial materials chemistry, with specific applications to catalysis and ceramics the prediction of polymorphs of organic-pharmaceutical compounds and their properties
Currently scientific data is distributed across a multitude of sites and systems. Scientists have only very limited support in accessing, managing and transferring their data or indeed in identifying new data resources. In a true Grid environment it is essential to ease many of these processes and the aim of the project is to help with automating many of these tasks. Our first step for the material scientists is to manage the data they produce in the areas of polymorph prediction and combinatorial methods. Currently they have no formal methods for storing and accessing the numerous files created running the applications they use. Data management will be provided by a new database to store metadata (interdisciplinary information about scientific studies) and data produced through running simulation codes. The data will eventually be mined to search for patterns in the data to enable a greater understanding of the science, for example, polymorph prediction of crystal structures. Access to the database will be provided by the CCLRC Data Portal. The portal will allow the metadata to be searched across a number of databases from different facilities such as the ISIS facility at Rutherford Appleton Laboratory. In this paper we focus on the data management area of the project, specifically, the design of the new relational database for metadata. Major considerations include the generic model that will be used to transport scientific metadata from the database to the Data Portal [5]. The database structure must map to this generic model. Later, more tables will be added to the database to allow storage of data specific to material science paving the way for more specialised searches and data mining algorithms.
Background Currently the scientists are forced to manually relate between experimental, data, computing and analysis facilities that are available world wide, with little infrastructure support. In the future it is hoped the Grid will provide these functions, enabling the scientists to choose much more easily from a wide range of services, connecting and combining desired services for an optimal working environment. Much of the access to the Grid is envisaged to take place through customisable, community oriented Portals. A range of projects within CCLRC have been chosen to provide the initial building blocks of an integrated solution for users of experimental, computing and data facilities, demonstrating on a few selected examples how basic technologies can be used to build middleware components that support high level scientific grid applications. Data will play a pivotal role in the success of Grid or e-Science
developments. Virtually all envisaged applications will need to be able to draw from and deliver to the distributed heterogeneous information/data sources with a variety of contents. Hence three major challenges are posed: data accessibility, data transfer and management of personal data. Data accessibility implies the capability to locate information/data without prior knowledge of its physical location or format. Furthermore scientists, as well as applications, need to combine results from different sources. CCLRC's integrated data system includes the Data Portal for high-level access to multidisciplinary data, linking to existing or new data catalogue systems. These catalogues include metadata as well as links to the data itself. The data is held in various storage resources from local disks, over databases to multi terabyte tertiary tape systems. For a number of e-Science projects, the first step is to create metadata catalogues and links to their data. The structure of these catalogues must
allow storage of metadata that is common amongst the different scientific areas since the DataPortal provides common searches using a common scientific metadata format in XML [4]. The structure must therefore allow storage of common metadata such as the name of a study and names of investigators. Later we will add more tables for specific data derived from the simulation output files, such as a crystal’s unit cell parameters, volume and energy in the case of the study of polymorph prediction.
Database Modelling Concepts A database is any collection of related data. The data model determines the way the data is organised so that you can find it again at a later date easily and quickly, perhaps in seconds rather than days. There are a number of database models to choose from: relational [1], hierarchical, network and object models. The relational model is the most widely accepted today and is well proven [2]. However there are new systems based on the hierarchical model such as OpenLDAP (Lightweight Directory Access Protocol) - a fast-growing technology for accessing common directory information [3]. The object model is based on object-oriented concepts and maps well to object-oriented programming languages such as Java. However, it is not as widespread as the relational model and is not yet proven in terms of performance. Relational database design includes a number of stages: • • •
• •
requirements gathering and analysis logical modelling of the data resulting in the Entity Relationship Diagram normalization – a process of refining the logical model in order to preserve data integrity, consistency and prevent insert, delete and update anomalies physical modelling of the data resulting in the Physical Data Model implementation – creation of the physical database on a Database Management System such as Oracle or MySQL
Entity Relationship Diagram An Entity Relationship Diagram is a graphical representation of what we know about the data that we plan to store in a database management system. An entity is represented by a box and relates to nouns or classes of data in the problem domain such as person or study e.g. study to predict the polymorphism of aspirin.
PERSON
STUDY * PURPOSE * STUDY_NAME o END_DATE ...
is performed by performs
* SURNAME * FORENAME o OTHER_INITIALS o TITLE * TELEPHONE ...
An example of entities are person and study. The above diagram shows the relationship between study and person by the connecting line and verb phrases. The end of the connecting line describes the type of relationship: one-to-one, one-tomany, many-to-many. The many end is represented by “crows feet”. Therefore, the following facts or axioms are represented by the above diagram: •
a study is performed by many people
•
a person performs many studies
The list underneath the entity name are attributes. These are bits of information about the entity such as the name of the study, start and end dates etc. Mandatory attributes are marked * and those that are optional are marked O. These rules will apply when creating or updating data in the database. Many of the entities are eventually implemented as two-dimensional tables in the database. The attributes of the entity are then mapped to columns. To illustrate, our study entity could be implemented like this: Study name Aspirin Paracetemol
Purpose The purpose...
Start Date 10/1/03
End Date 23/3/03
etc ...
Para...
03/5/03
25/5/03
...
Table 1: STUDY table
Physical modelling is used to • • •
resolve many-to-many relationships by creating joining tables transform complex relationships into binary relationships eliminate redundant relationships
The physical data model can be constructed using computer-aided design tools, such as Oracle Designer 9i (used for diagrams in this paper). The corresponding physical tables may then be automatically generated in the database.
Requirements Analysis for the Metadata Each stage in database design is necessary for both metadata and data. We will discuss the metadata only in this paper. The logical model for the metadata was based on the general scientific metadata language in XML
that is used within the Data Portal. CCLRC have developed this Scientific Metadata Format [4] that is used to pass metadata from the different databases or catalogues containing metadata surrounding datasets from many different scientific disciplines. Since the metadata format is in XML it can then be displayed very easily using a style sheet on the Data Portal web interface, or simply passed to the calling application.
A study consists of a number of data sets – a dataset entity represents information about a directory or folder of files created during a particular simulation run, such as the remote location (URI) and type e.g. binary or ASCII.
The same physical metadata database will be used for both scientific areas of the project.
The logical model was refined to third normal form (3NF) [1] [2]. This involves adding tables and altering relationships so that the model conforms to certain rules. For example, a study is associated with a list of key words. If we were to place all the key words in a single database field as a comma separated list i.e. the key word attribute is multivalued it would violate one of the rules. The reason is that it is much more complex to search for all studies matching a particular key word if the database has to parse the list of key words for each row. To solve this problem we create another table to hold the study identifier and a key word in each row. That way multiple key words can be associated with the same study by creating extra rows.
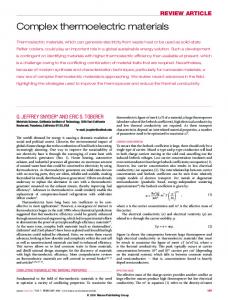
Logical Modelling of the Metadata is classified by
STUDY * * o o o o o
PURPOSE STUDY_NAME END_DATE FUNDING_AMOUNT FUNDING_BODY NOTES START_DATE
KEYWORD * KEYWORD
classifies is classified by
TOPIC * TOPIC_NAME
classifies is performed by originated by
PERSON
performs
* * o o * * * *
originates make up
consists of
DATASET * * * * *
DATASET_NAME DATASET_TYPE DESCRIPTION FACILITY_USED URI
consists of make up DATA OBJECTS * * * *
ACCESS_METHOD DATA_NAME DATA_TYPE URI
SURNAME FORENAME OTHER_INITIALS TITLE TELEPHONE FAX EMAIL WEB_PAGE
is based at houses INSTITUTION * * * * * * * * *
NAME TYPE ADDRESS_LINE_1 ADDRESS_LINE_2 ADDRESS_LINE_3 TOWN REGION POSTCODE COUNTRY
Figure 1: ER diagram of METADATA Figure 1 shows the Entity Relationship Diagram for the metadata. It illustrates the axioms for our domain. The important axioms follow: A study may be (dotted line) classified by a number of key words – a key word can then be used later to find a particular study using SQL (Structured Query Language – the database query language), or through an application such as the Data Portal. A study is classified by a number of topics e.g. /computational chemistry /polymorph prediction /aspirin. The Data Portal allows searches using a drill-down list. The user selects chemistry from a list and then computational chemistry etc. to find the topic they are interested in. Each study must link to all relevant topics. A study is performed by a number of people i.e. investigators. Also a person originates a study. So there are two relationships between person and study.
A data set consists of a number of data objects – a data object holds the location of a particular file from a simulation.
Normalization of the Metadata
Physical Modelling of the Metadata Figure 2 shows the actual database structure. Each box represents a table in the database. The list in each box is a list of column names. The relationships are still shown as connecting lines, however the corresponding fields have been created. For example, there is now a joining table between STUDY and TOPIC as it had a manyto-many relationship. Each row in the joining table links a single study to a single topic so there is the possibility of adding other rows with the same study linking to a different topic.
Subsequent Work At the start of the project we held a workshop at CCLRC Daresbury Laboratory with a number of the scientists who work in the area of polymorph prediction. The purpose of the workshop was to gather information on the kind of data they produce and the applications they use. We also discussed how they would like to search for their data in addition to the standard searches provided by the Data Portal (search one or more catalogues by topic).
STUDY (ematerials/0.2) STUDY_ID - NUMBER - NAME - VARCHAR2 - 200 FUNDING - NUMBER -
TOPIC (ematerials/0.2)
STUDY_KEYWORD (ematerials/0.2)
TOPIC_ID - NUMBER -
FUNDING_BODY - VARCHAR2 - 100
STUDY_ID - NUMBER -