Simulation of SAR Images and Radar Coding of Georeferenced Information for Temperate Glacier Monitoring Andreea JULEA1, 2 , Gabriel VASILE1, 2 , Ivan PETILLOT1 , ´ 1 , Michel GAY3 , Jean-Marie NICOLAS4 , Philippe BOLON1 Emmanuel TROUVE 1
: Laboratoire d’Informatique, Syst`emes, Traitement de l’Information et de la Connaissance Universit´e de Savoie - ESIA - BP 806 - F-74016 Annecy Cedex - FRANCE Tel: +33 450 096 548 - Fax: +33 450 096 559 Email: {andreea.julea|g.vasile|ivan.petillot|trouve|bolon}@univ-savoie.fr 2
: Laboratorul de Analiza si Prelucrarea Imaginilor (LAPI), Universitatea Politehnica Bucuresti - Bucharest - ROMANIA Tel: +4021 402 4683 - Fax: +4021 402 4821 - Email: {ajulea|gvasile}@alpha.imag.pub.ro 3
: Laboratoire des Images et des Signaux - INP Grenoble BP 46 - 38402 Saint-Martin-d’H`eres- FRANCE Tel: +33 476 826 260 - Fax: +33 476 826 384 - Email:
[email protected] 4
: D´epartement TSI - Ecole Nationale Sup´erieure des T´el´ecommunications 46, Rue Barrault - 75013 Paris - FRANCE Tel: +33 145 818 129 - Fax: +33 145 813 794 - Email:
[email protected]
Abstract
1
Synthetic Aperture Radar (SAR) interferometry has the potential to measure temperate glacier displacement with a very high precision compared to terrestrial sparse ground measurements. But the strong topography of mountainous areas where most alpin glaciers are located makes the use of SAR images rather difficult. Digital Terrain Model (DTM) are necessary to remove topographic fringes from interferograms and to geroreference the extracted information (radiometry, coherence, displacement field...). The georeferencing of SAR images is often performed by interferometric processing chains which do not allow the end–user to interact and to invert the process in order to code georeferenced information in the radar geometry. However, in a difficult context such as the processing of SAR data over alpin glaciers, it is very useful to be able to analyze the data and the processing results in both radar or in ground geometries. This paper presents a original method to perform this geometrical conversion task. The proposed approach is simple and straightforward to derive from a DTM visibility masks and simulated SAR images and to code any useful information in the radar geometry. Results are presented in the case of SAR images acquired by ERS (European Remote Sensing) satellites over several glaciers in the Mont-Blanc area.
In the last years, the global warming together with reduced precipitations in the glacial accumulation areas has resulted in a spectacular retreat of most of the monitored Alpine temperate glaciers. If confirmed in the coming years, this evolution will have important consequences in terms of water resources and economical development of the surrounding areas. Up to now, the Alpine glaciers have been mainly monitored by ground measurements which often provide information only once a year in a few points. Because of the difficulty to reach high altitude glaciers in risky mountainous areas (500 m ASL up to 4000 m ASL in Mont Blanc region of the French Alps), acquisition and processing of remote sensed data should provide more information to allow the monitoring of the temperate glaciers. Space-borne optical images with their increasing resolution may be an interesting alternative, but because of the weather conditions (clouds presence) on mountainous areas and orbital constraints, the existing data are rather rare. Also, in winter, the snow cover of the glaciers makes impossible the surface velocity field estimation without wave penetration. The main advantage of such data is that they can cover the whole group of glaciers of a catch-
Keywords: SAR image simulation, DTM, geocoding. 1
Introduction
ment area and allow land cover classification based on spectral signatures. This can be very useful to identify specific features (emerging lakes, crevasses, glacier tongues) for change detection and risk assessment. In summer season, the ice-velocity field on the Alpine glaciers from Chamonix valley was successfully measured by crosscorrelating SPOT5 optical images [1]. Satellite SAR images are used more and more to observe glaciers particularly because of two great advantages: the active SAR sensor acquires images independently from the weather conditions and it measures both the amplitude and phase of the backscattered signal. With the resolution of the data which have been available up to now (about 20 m with ERS 1/2 satellites images), the amplitude is often difficult to use to extract precise information on specific features. With interferometric data, the geometric deterministic component of the phase offers the opportunity to measure the glacier displacement between the two acquisitions with a precision of a fraction of the wavelength (5.6 cm at C-band) [2]. The two main limitations of this technique is the temporal decorrelation of the glaciers and the need to separate the topographical fringes from the displacement fringes. Among the different techniques which can be used, the safest one consists in using a Digital Terrain Model (DTM) of the target area. The DTM accuracy requirement increases with the baseline between the two SAR acquisitions, which makes interferograms more and more sensitive to the topography, especially in the high relief areas of alpine glaciers. The differential interferometry (D–InSAR) consists in differencing either two SAR interferograms or one interferogram and a topographical interferogram simulated using a DTM over the same target area [3], [4]. A D–InSAR processor which is widely used in the academic and research community is the Repeated Orbit Interferometry Package (ROI–PAC). From the initial experiments in spaceborne radar interferometry [5], ROI–PAC has been developed through the collaboration of many researchers at the Jet Propulsion Laboratory and Caltech [6]. It uses raw radar data, telemetry information and DTMs for generating the displacement maps [7]. In this processing chain, DTMs become necessary after the interferogram generation stage to enable topographic fringe removal and precise orbital phase corrections. It is also used for geocoding the processing results (amplitude, coherence and phase images) in ground geometry and for projecting of the unwrapped differential phase on the glacier main slope. Despite many applications are already using differential SAR interferometry, the processing of such data and the extraction of the sought-after information is still a difficult task. This is even more difficult in the context of the proposed test site with high relief topography, large displacements (30 cm/day) and snow and ice backscattering mechanisms which are still under investigation [8].
The existing standard processing D-InSAR software provide automatic modules that perform both local altitude projection and resampling in the radar slant range (radar coding), and also data geocoding. Unfortunately, these modules do not perform the radar coding of additional information as optical images or ground classification maps. This makes the information processing impossible in radar slant range geometry. Moreover, the geocoding modules do not contain all the necessary data interpolation methods as nearest neighbor, bilinear interpolation or other special interpolation kernels. In this paper we proposed a new method which allows data conversion from SAR slant range geometry to ground range geometry, and viceversa, by using a DTM of the studied area. This method is suitable for topographic fringes simulation and removal and data radar coding to add information in the standard D-InSAR processing chain.
2
Simulation of a SAR image
The analysis of radar images in mountainous area with high topography will greatly benefit from a software tool to simulate such images from known topographic data. Our intention is to develop such a simulation tool and demonstrate its usefulness in alpine terrain monitoring. The simulation is an essential element for better identification and understanding of the phenomena that affect the SAR images and for the quantification of its influence on the sought-after information. The processing chain of the proposed method is shown in the Fig.1. First of all, based on the radar parameters and the available DTM, the ground mask, that consist in a map of visible, foldover and shadow points, is obtained. After this we can resample in slant geometry different types of ground images (visibility mask, georefenced images and simulated intensity images).
2.1
Data preprocessing
At first, we use a DTM (Digital Terrain Model) in latitude and longitude coordinates. For bringing the DTM in a geometry close to the one of the SAR acquisition, we performed a rotation (using bilinear interpolation) with the angle between the satellite orbit and the local meridian of the first column of the DTM. The angle used is positive in the case of an ascending satellite pass (the satellite advances from north to south) and negative in the case of an descending satellite pass (the satellite advances from south to north).
2.2
Ground range processing
The special radar imaging geometry, based on range measurements, leads to geometric distortions in the result-
DTM +sensor parameters
Ground Mask Calculation
Ground Geometry
Georeferenced Information (label/grey level)
Visibility Mask
Intensity Simulation
Simulated Intensity
Radar Coding
Radar Geometry
Resampled Information
Shadow & Foldover Mask
Simulated SAR Intensity
Figure 1: Block diagram of the proposed method ing image, like foldover and shadow. The foldover occurs when a high altitude point is closer to the sensor than a lower altitude point. The shadow corresponds to the point that is not illuminated by the radar beam. Such radar specific phenomena are briefly reviewed in Fig.2.
Figure 2: Geometrical distortion of side-looking radar. On a mountain side oriented towards the radar source, the distances AB and CD are compressed (foreshortened) in the slant range (ab, cd) and the region EF presents an image with inverse order of points - the foldover. On an opposite side, dilatations, compressions or shadows can appear in slant range. The diagram shown in Fig.3 summarizes the local slope angle β dependence of slant phenomena - reversible (compression or dilatation) or irreversible (active foldover and active shadow) deformations. Active layover occurs when the terrain slope exceeds the radar viewing angle and the active shadow when the local incidence angle exceeds 900 . The passive foldover
Figure 3: The slant - ground dependency of the terrain slope (where θ is the incidence angle and β is the local slope angle) and shadow are induced not by incidence angle conditions, but by the vicinity with corresponding active zones [9]. Therefore, in our simulation, we make discrimination between zones of active (red color) and passive (blue and yellow color) foldover. This distinction active - passive for foldover is possible only in the case of mask in ground range. Due to the small zones covered by shadow, the distinction between active and passive character is not made, fact which leads in the reduction of computing time. In mountainous area, radar shadow or foldover render large areas of the received signal useless for operational purposes. For SAR image and interferogram interpretation the accurate prediction of such areas is indispensable [10]. Using the DTM, we determined the areas which are not polluted by irreversible geometric distortions meaning that are visible (observable). Our objective is to identify the zones where the foldover appears and the zones found in the shadow. The flat earth hypothesis is considered to create a foldover and shadow map (mask) in ground range. To simulate a SAR image we need to model the backscattered radar intensity on the ground range. Because of the nature of the DTM, an alpine environment, where the topographical effects have a stronger influence than thematic ones, we use for the modeling of backscattered radar radiation a cosine function. A Lambertian surface is considered and the formula employed to calculate the simulated radar intensity is [11]: cos2 γ
I=p
1 − cos2 γ
(1)
with γ being the local incidence angle determined from: − → → − l ·− n cosγ = (2) → k− nk
where: → • − n - the normal surface vector with the following components on the three directions Ox, Oy et Oz : δz δz − → n = (− , − , 1) δx δy − → • l - the radar aiming vector with the following components on the three directions Ox, Oy et Oz : − → l = (cos(90 − θ), 0, −cosθ) (θ being the satellite viewing angle)
we considered the contribution of every ground point (interval) that is projected in the respective slant position. To derive the corresponding intensity in slant range, we apply an integration within the slant resolution cell of the ground intensities weighted by square cardinal sine function in order to take into account the distance to the centre of the cell. We limited ourselves to the principal lobe of the sinc function and we used the rectangles method to calculate the integral. For the direct approach, we employed the following formula: I(s) =
2.3
Slant range processing
We used two different approaches to bring the images from the ground range to a geometry specific to the SAR sensors (slant range). In the first method, named inverse approach, we inspect each pixel of each line of the slant image searching for the correspondence in the ground image. For each line of the ground image, we have created an ordered vector containing the distances from the points on the ground surface to the satellite. We identify between which values the centre of each slant pixel is situated and we compute, according to these neighbors, the value that should be given to the pixel in slant range. The way this value is computed depends on the type of the image that we want to resample in the SAR geometry. The second method is named direct approach by intervals. In this case, we are situated on the ground range and we project intervals on the slant range in order to obtain a complete covering of slant axe. We can project on slant range different types of ground range images. One or several values from the ground have to be combined or selected according to the employed strategy which depends on the data type to be resampled: • foldover and shadow map: by priority rules; • images with ordered real values like the grey levels in optical images for instance. In this case, for the inverse approach we use linear interpolation, and for the direct approach - we use weighted average according to the difference between the distances to the satellite of the projected points and the centre of the slant pixel; • images of labels like classification results, geographical maps etc. In this case, a nearest neighbor interpolation is used for the inverse approach and a majority rule for the direct approach. The most important step of our simulation is to obtain the synthetic image of the backscattered radar intensity in slant range. This synthetic image will allow us to compare our results with real SAR images. In each slant pixel
X ci∈L
sinc2 (
2π(ρci − ρ(s + 12 )) ) · I(g) Res
(3)
where • L - the set of ground intervals that contribute to the slant pixel s • ρci - the distance from the satellite to the centre of the sub-interval ci (intersection between the slant pixel s and the projected ground interval) • ρ(s + 12 ) - the distance from the centre of the pixel s in slant range to the satellite • I(g) - ground range simulated intensity • I(s) - slant range simulated intensity corresponding to the pixel s • Res - sinc function principal lobe width
3
Results and discussion
The proposed test site is located in the Alps, near the borders between France, Italy and Switzerland. It goes from the glacier of Le-Grand-Plateau (45◦ 500 N, 6◦ 510 E) about 4000 m ASL up to the Trient glacier (46◦ 590 N, 7◦ 010 E) about 2000 m ASL. It includes the Mont-Blanc (4807 m), the Chamonix valley (1000 m) and two well-known and instrumented glaciers: Mer-de-Glace and Argenti`ere (see Fig.4-(c)). One SAR image from ERS 1 has been selected to study the feasibility of proposed method. It was acquired in 10/03/1996 in the descending configuration and it corresponds to the orbit 24330 and the frame 2673. The DTM used in the simulation (Fig.4-(a)) was build by fusing the SRTM (Shuttle Radar Topography Mission - http://srtm.usgs.gov ) DTM with a DTM covering the French Alps provided by the IGN (Institut Gographique National - http://www.ign.fr ). It is in DTED format (latitude-longitude coordinates) on the standard reference ellipsoid WGS-84, with a pixel size of 0.00083330 LAT× 0.00083330 LON. Firstly, the foldover and shadow map has been computed to detect the areas which do not contain useful information in the SAR image geometry for a descending
the real geocoded amplitude on the brighter regions corresponding to foldover polluted zones as it can be observed in figure 5-(c). Parameter satellite altitude (km) step on ground range (m) step on slant range (m) viewing angle at close range (degrees) (a)
(b)
(c) Figure 4: Chamonix valley: (a) the DTM used in the simulation, (b) foldover and shadow map for ERS satellite descending passes, (c) SPOT1 panchromatic image.
acqusition. The resulting image (Fig.4-(b)) is composed of active foldover areas (represented in red), regions of passive foldover (yellow stands for higher altitudes and blue for lower ones) and shadows (green). The parameters used in the simulation are given in Tab.1. Correct results are obtained over the South-East mountainsides in the Chamonix valley (Aiguille-du-Midi, Aiguille-Verte, Mont-Blanc) where the foldover occurs in the ERS descending passes. Secondly, the radar intensity is simulated according to Eq.3. The result corresponding to ERS descending pass parameters is illustrated in (Fig.5-(a)) using the DTM from (Fig.4-(a)). For comparison Fig.5-(b) presents a real ERS SAR amplitude geocoded by using the ROI-PAC software. The foldover and shadow map matches perfectly
Value 785 16.12 23.16 19.5
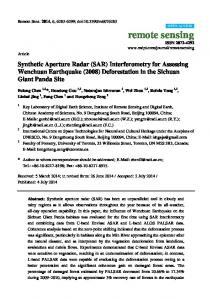
Table 1: Processing parameters. Fig.7-(a) presents the radar coding results of the simulated SAR amplitude image. The results are in good accordance with the real ERS amplitude image from Fig.7(b). The foldover regions appear in both images in a similar manner, while in less steep areas (as in the south-west of the image) the similarities are more difficult to evaluate. That is why the successful application of the proposed coding method relies on the precise simulation of the foldover regions. The main advantage of the proposed method is that, once the slant range projection of the simulated SAR amplitude is computed, additional information can be radar coded and made available for the D-InSAR processing chain. In Fig.6-(a) the foldover and shadow map is projected and resampled in slant range geometry. This is an important result for the phase unwrapping step as the masked regions should not be taken into account by the phase unwrapping algorithm [12]. Also, in building a differential interferogram, the topographic phase component must be compensated for obtaining the displacement on the radar line of sight. This can be done by rewrapping the radar coded altitude presented in Fig.6-(b) and subtract it from the initial interferogram [2]. Finally, available optical or multispectral images images can be radar coded for providing additional information for land classification or target detection algorithms [13]. Fig.6-(c) presents the radar coding result of the SPOT1 panchromatic image acquired in 26/08/2000 over the test site. In order to assure an accurate positioning of the geocoded data the images were processed and visualized with the Quantum Geographical Information System software (http://qgis.org). Each radar coded layer was stacked accordingly, by using the ENVI (Remote Sensing Exploitation Platform) software provided by the RSI company.
4
Conclusion
In this paper, an original method has been presented to facilitate the processing of different information sources which include SAR images in the difficult context of alpine glacier monitoring. The proposed method consists in using a DTM to detect foldover and shadow areas and to
(a) (a)
(b)
(b)
(c) (c) Figure 5: Chamonix valley in ERS descending passes: (a) SAR intensity simulation, (b) real SAR amplitude geocoded with ROI-PAC processor, (c) mosaic image with the simulated foldover and shadow map superposed on the real geocoded SAR amplitude.
Figure 6: Chamonix valley: (a) simulated foldover and shadow map in slant range, (b) radar coded altitude from the DTM, (c) radar coded SPOT1 panchromatic image.
simulate SAR intensity images in both ground and radar geometry. It allows us to combine georeferenced data such as optical images, slopes, land use maps and radar measurements such as strong scatterers, coherence and displacement fields either in ground geometry to include them in a Geographical Information System (GIS) for instance, or in the radar geometry which is rarely done. This radar-coding approach is much more interesting than geocoding to understand the physical phenomena occurring in SAR images or to provide prior information useful for the SAR interferometric processing. Further work will consist in using this approach for merging different data set over glaciers in order to extract spatio-temporal information using either change detection methods developed for SAR images and optical data or data mining techniques.
[10] M. Eineder. Efficient Simulation of SAR Interferograms of Large Areas and of Rugged Terrain . IEEE Transactions on Geoscience and Remote Sensing, 41(6):1415–1427, 2003. [11] S. Buckley. ROI PAC Documentation - Repeat Orbit Interferometry Package, 2000. abriged version of chapter 3 of PhD thesis. [12] E. Trouv´ e, J. M. Nicolas, and H. Maitre. Improving phase unwrapping techniques by the use of local frequency estimates. IEEE Transactions on Geoscience and Remote Sensing, 36(6):1963–1972, 1998. [13] A. Ferretti, C. Prati, and F. Rocca. Permanent scatterers in SAR interferometry. IEEE Transactions on Geoscience and Remote Sensing, 39(1):8–20, 2001.
Acknowledgments This work was supported by the French national project ACI-MEGATOR. The authors wish to thank to the European Space Agency for the provision of ERS SAR data through the Earth Observation Announcement of Opportunity (Category 1 proposal 3525).
References [1] E. Berthier, H. Vadon, D. Baratoux, Y. Arnaud, C. Vincent, K.L. Feigl, F. Rmy, and B. Legresy. Mountain glaciers surface motion derived from satellite optical imagery. Remote Sensing of Environment, 95(1):14–28, 2005.
(a)
[2] D. Massonnet and K. Feigl. Radar interferometry and its application to changes in the Earth’s surface. Reviews of Geophysics, 36(4):441–500, 1998. [3] A.K. Gabriel, R.M. Goldstein, and H.A. Zebker. Mapping small elevation changes over large areas: differential radar interferometry. J.Geophys.Res., 94:9183–9191, 1989. [4] D. Massonnet and T. Rabaute. Radar interferometry, limits and potential. IEEE Transactions on Geoscience and Remote Sensing, 31(2):455–464, 1993. [5] H.A. Zebker and R.M. Goldstein. Topographic mapping from interferometric SAR observations. J.Geophys.Res., 91:4993– 4999, 1986. [6] P.A. Rosen, S. Hensley, I.R. Joughin, F.K. Li, S. N. Madsen, E. Rodriguez, and R.M. Goldstein. Synthetic aperture radar interferometry. Proceedings of the IEEE, 88(3):333–382, 2000. [7] P.A. Rosen, S. Hensley, G. Peltzer, and M. Simons. Updated repeat orbit interferometry package released. The Earth Observation System, Transactions, American Geophysical Union, Electronic Supplement, http://www.agu.org, 85(5), 2004.
(b)
[8] K. Papathanassiou, I. Hajnsek, H. Rott, and T. Nagler. Polarimetric SAR interferometry for snow cover parameter estimation. In POLinSAR 2005 workshop, ESA ESRIN, Franscati, Italy, 2005.
Figure 7: Chamonix valley: (a) simulated amplitude in slant range, (b) real SAR amplitude from ERS1 descending pass March 1996.
[9] M. Gelautz, H. Frick, J. Raggam, J. Burgstaller, and F. Leberl. SAR image simulation and analysis of alpine terrain. ISPRS Journal of Photogrammetry and Remote Sensing, 53:17–38, 1998.