that the slick is an oil spill increases significantly because all other types of spills ... side of Fig.1, the method for the oil spill identification can be described by the ...
ESTIMATING THE WIND VECTOR FROM RADAR SAR IMAGES WHEN APPLIED TO THE DETECTION OF OIL SPILL POLLUTION Luca Salvatori (3), Samy Bouchaib (2), Fabio Del Frate (3), Juerg Lichtenneger (1), Youcef Smara (2) (1) European Space Agency, ESRIN, Frascati (IT) (2) Houari Boumediene University of Sciences and Technology, Faculty of Electronics and Computer Science Image Processing and Radiation Laboratory, Algiers (DZ) (3) Università Tor Vergata - Dipartimento di Informatica Sistemi e Produzione (IT)
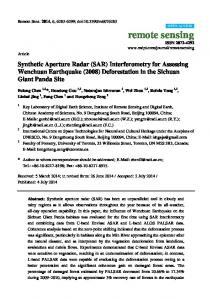
Abstract: The object of this study is to improve the procedure for the detection of oil spill based on neural networks described in [1] by means of the elaboration of an operational tool allowing the wind vector to be estimated from radar SAR images. This is done in order to include wind speed, in addition to parameters linked to the physics and the geometry of the oil spill, in the neural network as additional input. Introduction: The capacity of synthetic aperture radar to observe the sea surface and its potentiality for evaluating the wind vector and for the interpretation of atmospheric and oceanic phenomena make the radar a useful tool in the control and surveillance of oil spill pollution. Physical and geometric parameters alone are not always sufficient to provide enough information in order to identify the nature of the oil spill. There are several natural phenomena that can have the same radar signature as an oil spill. To help in the identification of the suspect objects, supplementary data, such as the wind speed that can be calculated from radar images, have proved themselves to be efficient [2]. It is the fact that when the wind speed is greater than 7-8 m/s (and less then 15 m/s), the probability that the slick is an oil spill increases significantly because all other types of spills tend to disappear in the meantime. When the wind speed is less than this value, the slick may also be caused by natural phenomena [3]. Integrated with the tool for the estimation of the wind vector, represented by the two boxes on the left side of Fig.1, the method for the oil spill identification can be described by the following procedures: 1) selection of the area concerned (the area containing the suspect slick) 2) evaluation of the wind direction. 3) calculation of the wind speed. 4) calculation of physical and geometric parameters characterising the slick. 5) decision as to the nature of the slick. (Oil spill or look-alike) The inversion of the CMOD4 model [4] allows the calculation of wind speed from an SAR image with an interactive pre-estimate on the image by the operator.
First stage: SAR/ASAR Image
Estimation of wind direction
Visual inspection: Selection of area
Calculation of wind speed (CMOD4)
Calculation of parameters linked to slick
Algorithm of decision (Neural network)
Final stage: Information file
Figure 1 - Synoptic of the method of identification
Methodology: A set of more than ERS-SAR PRI 35 images containing different examples of look-alike and oil spills has been considered. After the radiometric range correction and the georeferencing of each image, a dedicated oil spill processing and analysis tool is applied, based on edge detection. The procedure starts with the definition of a region of interest by the user. The tool analyse the overall backscattering of the region and in particular produce a histogram. The histogram generally contains two peaks; the lower is located around the mean backscattering value of the dark object, the taller around the mean value of the background. The local minimum value between the two peaks is stored and is the one used for image fragmentation. To this purpose, the darkest pixel in the region is selected as starting point, then, the region around this pixel grows defining an edge that corresponds to the border of the oil. The region grows until the neighbouring pixels have a value greater of the threshold value given by the local minimum previously calculated. Several routines have been implemented dealing with anomalies from the described general case. Subsequently, the human operator can either accept the result suggested by the automatic procedure or reject it and produce new edge detection by changing the threshold. In this way, the oil spill analysis tool is made flexible and adaptive to a variety of situations. Once the border of the dark object is accepted, a mask is generated and a number of morphological and physical parameters are computed. A description of these features is the following. 1) Area (A). Area of the object. 2) Perimeter (P). Length of the border of the object. 3) Complexity (C). Complexity is defined as follows:
C=
P 2 πA
(1)
This feature will generally take a small numerical value for regions with simple geometry and larger values for complex geometrical regions. 4) Spreading (S). This feature is derived from the principal component analysis [7] of the vectors whose components are the coordinates of the pixels belonging to the object. If and are the two eigenvalues associated with the computed covariance matrix and the spreading value is computed using this expression:
S=
100λ2 λ1 + λ2
(2)
will be low for long and thin objects and high for objects closer to a circular shape.
5) Object standard deviation (OSd). Standard deviation of the intensity values of the pixels belonging to the oil spill candidate. 6) Background standard deviation (BSd). Standard deviation of the intensity values of the pixels belonging to the region of interest, selected by the user, surrounding the object. 7) Max contrast (ConMax). Difference between the background mean value and the lowest value inside the object. 8) Mean contrast (ConMe). Difference between the background mean value and the object mean value. 9) Max gradient (GMax). Maximum value of border gradient. 10) Mean gradient (GMe). Mean border gradient. 11) Gradient standard deviation (GSd). Standard deviation of the border gradient values. 12) Wind Speed (V). Wind speed calculated around the object using the CMOD4 model. CMOD4-Inversion: Differently by the others 11 original parameters, calculated directly from a SAR image, to estimate the wind vector a procedure has been implemented and the wind speed is calculated using an inversion of the CMOD4 model. The CMOD4 wind retrieval model is developed by ESA for evaluation of wind vector from radar Cband scatterometer [8]. It gives the backscattering coefficient according to wind speed, wind direction and the angle of incidence. The model, however, can be applied also to radar SAR images. The CMOD4 [4] model provides backs cattering coefficient ó0 values as a function of relative wind direction (ö=0 for a wind blowing toward the radar), wind s peed and incidence angle, expres s ed as :
σ 0 = B0 [1 + B1 cos(ϕ ) + B3 tanh (B2 )cos(2ϕ )]1.6 The coefficients B0, B1, B2 and B3 depend on the local incidence angle of the radar beam and wind speed.
F igure 2 - Dependency of ó0 by wind speed, wind direction and incidence angle
One can see the periodic dependency by the relative wind direction, but the most important observation for the aims of this paper is the mono-tone growing dependency by the wind speed that allow the inversion of the model. Starting from this observation it was possible to invert the CMOD4 model having as inputs: • The mean backscattering value of the region of interest, selected by the user. Calculated knowing the values of the Digital Number (DN) of the pixels in the region and having a calibration procedure to obtain the backscattering coefficient from the DN value.
• The mean incidence angle in the region selected. Obtained knowing the minimum and the maximum incidence angle value in a SAR image. • The relative wind direction estimated by the user looking the image or using external information about the local wind conditions. In this paper, automatically extraction of the wind direction from a SAR image have not be considered. There are many natural and atmospheric phenomena that allow to estimate the wind direction with interactive estimation. This interactive inspection is based mainly on the interpretation of atmospheric phenomena. The greatest number of wind-provoked phenomena are then collected in order to estimate wind direction. Wind represents a most important atmospheric phenomenon capable of modifying the surface of the sea sufficiently for the coefficient of radar backscattering to be modified. eg. The presence of atmospheric gravity waves which appear to leeward of mountainous coastal areas, perpendicularly to the direction of wind [5] (Fig.3). Wind rolls which appear parallel of wind direction when wind speed is greater then 10 m/s (Fig.4). Bright band following the coast line caused by land-sea breeze and katabatic wind (Fig.5). Wakes caused by a strong wind blows against a mountainous islands and caps (Fig.4). The shape of an oil spill is also modified by the wind in the same way as the surface of the sea. It can cause separation of slick [6] (Fig.6)
Figure 3 - Atmospheric gravity waves generated by a west wind blowing across a mountainous coastal area.
Figure 4 - Wind rolls and wakes generated by north-eastern wind
Figure 5 - The bright band following the coast line is caused by a wind blowing late in the evening and at night from the land onto the sea. This land breeze is caused by the fact that after sunset the air over land cools off faster than over the sea.
Figure 6 - Two oil spill which have become separation due to a north wind.
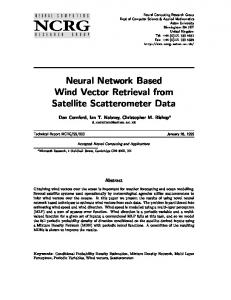
The results obtained with the inversion of the CMOD4 have been tested with the information provided by QUIKSCAT the NASA wind-scatterometer. The results obtained are shown in figure 7. Wind speed has been measured in different parts of an image, for different images, collecting 65 samples, utilising the inversion of CMOD4. Then these results have been checked with the corresponding wind speed values, provided by QUIKSCAT for the same regions at the same date. the difference between these two models is shown in figure 7 and the mean difference is about 1 m/s. Even if the number of samples considered is not high (for the limited images available), this is a encouraging result considering that the theoretic error for both the models (ESA CMOD4 model and NASA scatterometer model) is 2 m/s.
Figure 7 - Comparative between CMOD4 and QUIKSCAT data
Since we have examined the methodology to calculate the features that characterise the slicks and that we will utilise as inputs for the neural network classifier, such types of features for 149 dark objects have been calculated, 76 oil spills and 73 look-alikes. For a number of examples ground-truth was available. Else the discrimination was based on the independent judgment of experienced image analysts. Results: Several attempts have been initially made to properly select the number of units to be considered in the hidden layers. The topology 12-8-8-1, Fig. 8, has been finally chosen for its good performances well in terms of classification accuracy as well of training time. In fact, the number of about 75 training cycles was sufficient to get the network learned. The neural responses are generally not ambiguous, in fact, the outputs tend to assume the extreme values in the allowed range [0,1]. This means that with the considered data set and with the considered learning strategy the net succeeded in determining a precise mapping function. The function returns 0 if a dark spot in the image is oil spill, 1 if it is a lookalike.
Figure 8 – Topology of the neural network.
The evaluation of the neural net performance consists in the analysis of its behaviour once it is tested on a set of new examples, not belonging to the training set. To this purpose we divided the examples in two sets: a training set of 100 examples and a test set of 49 examples. After having trained on the learning set we found an overall rate of misclassified pixels of about 12%. So there are some situations in which the data points in the test set do not respect the internal rules that the net has learned from the training points. This can be explained with the heterogeneity of the data set, which includes several examples with very different geometric and physical characteristics. Conclusions: The potentialities of neural network algorithms for the detection of oil spills in ERS-SAR imagery have been investigated in this study. The data necessary to train the net has been generated using routines, which retrieve a set of specific features describing a dark area in an ERS-SAR image over the sea. The neural net could correctly discriminate over a set of independent examples between oil spills and look-alikes with a largely acceptable rate of success. Moreover we have investigate the possibility of calculate the local wind speed directly from a SAR image and this information appear useful not only to know the evolution of the oil spill but also to classify correctly the slicks. All the methodology described in this paper has been implemented in a software tool, developed in IDL, that make the analysis of a region, selected by the user, allowing the detection and the classification of possible oil spill in a semi-automatic way. Other parameters linked to the atmosphere, such as wind direction can be added to the input data of neural networks to improve the identification process, for that an automation of wind direction estimation must be performed. Acknowledgements: We thanks European Spatial Agency ESA for providing SAR images and for facilities supplied on European Spatial Research Institute ESRIN.
References: [1] F. Del Frate, A. Petrocchi, J. Lichtenegger, G. Calabresi," Neural networks for oil spill detection using ERSSAR data," IEEE Transactions of Geoscience and Remote Sensing, vol. 38, n. 5, pp. 2282-2287,2000. [2] H. A. Espedal, and T. Wahl, "Satellite SAR oil spill detection using wind history information," Int. J. Remote Sensing, 1999, vol. 20, no. 1, 49-65. [3] Torill Hamre, Heidi Espedal, Paul Samuel and Stein Sandven, "Operator's Manual for Slick Analysis," NERSC Special Report, no.37. February 1996. [4] Stoffelen A & D Anderson, Scatterometer data interpretation: "Estimation and validation of the transfer function CMOD4," JGR 102, 5767-5780, 1997. [5] GARY A. MASTIN, CHARLES A. HARLOW, OSCAR K. HUH, AND s. A. HSU, "Methods of Obtaining Offshore Wind Direction and Sea-State Data.From X-Band Aircraft SAR Imagery of Coastal Waters, "IEEE of Oceanic Engineering, vol. OE-10, no. 2, April 1985. [6] "Manuel pour l'observation aérienne des pollutions pétrolières, "CEDRE, Centre de Documentation, de Recherche et d'Experimentations sur les Pollutions Accidentelles des Eaux, 36p, 1993. [7] I. T. Jollife, "Principal Component Analysis," New York: Springer-Verlag, 1986. [8] "CMOD4 Model description," ESRIN DPE/OM, 8p, February 16, 1993.