elastic TCP connections in overload as a congestion settles in. Such flows adjust their transfer rate to the available network capacity. Typical examples are file.
Simulation Study of TCP in Overload P. Brown, D. Collange France Telecom R&D 905 rue A. Einstein, 06921 SOPHIA ANTIPOLIS Cedex, France {patrick.brown, denis.collange}@.francetelecom.com
Abstract We study through simulations the transient performance deterioration on an overloaded link and compare the results with the processor sharing model. We find many similarities. The performance depends essentially on the load and on the distribution of flow sizes. Moreover the distribution of sizes observed on public networks leads to a very slow degradation. The number of active flows and the sojourn times increase linearly. We also observe that the link capacities has a small impact. These results are independent of usual TCP releases and they are due to the relatively fair bandwidth sharing between connections. This may allow acceptable waiting times for short transfers during overloads lasting many tens of minutes. We however notice some differences. The arrival process has a low but non negligible influence on TCP simulations. More important are the worse performance and the slow convergence of the dispersion of sojourn times.
1.
Introduction
Congestions occur even on well dimensioned networks due for example to link failures or sudden traffic variations. New connections arrive at a faster rate than they can be served, the number of ongoing connections increases and the connection completion times worsen. We analyze through simulations the behavior of elastic TCP connections in overload as a congestion settles in. Such flows adjust their transfer rate to the available network capacity. Typical examples are file transfers and web transactions which account for a major proportion of the Internet traffic. We study a network link in light overload, for which the connection arrival rate exceeds the link transmission capacity, but the load remains lower than 2. Such light overloads would typically be observed during link failures with rerouted traffic. Observations on an IP backbone [1] have shown the later represent a major proportion of overload occurrences on such networks. The present analysis concerns a system for which the arrival rate of connections keeps a constant intensity as the congestion develops. This is the case for systems
where the population is large enough: the arrival rate stays constant even if the transfer completion times are delayed. We exclude the case of links shared by a small population of users, i.e. systems which may be modeled by a closed population queuing system. Our analysis doesn't either apply to flash crowds that may happen on some web servers, due to unexpected events, in which case the load may be much higher than 2. We study a system during a transient overload and we suppose that the congestion has no influence on the user behavior: transfers are neither interrupted nor reattempted. Past studies concerning TCP in overload have focused on the behavior once overload is installed. We will recall in section 3 the results for the processor sharing queue in overload studied by Jean-Marie and Robert [6]. Bonald and Roberts [2][3] show that for distributions of transfer sizes with high variances, the transfer completion rate may stay at a high value, while the transfer sojourn times and their goodput degrade. They also analyze, as Yang and Veciana [4], the impact of user impatience when overload is installed. This last paper focuses on the transient behavior of TCP connections in overload and shows there is a non negligible period before performance degrades significantly. Bansal and Harchol-Balter [5] also study the transient congestion due to an overloaded access link but in the context of a web server. The traffic analysis of congestion on an ADSL network is presented in [7]. The failure of a duplicated link causes light overload of 20% during three hours. Performance of users is impacted but not their behavior: neither interrupted nor reattempted transfers are observed, nor a lower arrival rate of transfers. Some differences are observed with the processor sharing model. In the next section we describe the simulated system. In section 3 we recall the performance obtained with a processor sharing queue in overload which we compare with our simulation results in following sections. We analyze then more systematically the sensitivity of TCP performance in overload with respect to many system parameters. We consider in section 4 the increase rate which gives an insight of the state of congestion in the system. And we look in section 5 at the sojourn time of transfers.
Proceedings of the Advanced International Conference on Telecommunications and International Conference on Internet and Web Applications and Services (AICT/ICIW 2006) 0-7695-2522-9/06 $20.00 © 2006 IEEE
2.
System Description
We simulate a single bottleneck link in overload with the network simulator NS-2 [8]. All TCP sources are directly connected to the link ingress node and all TCP destinations are directly connected to the link egress node. The TCP connections have all the same propagation delay in this network: 20 milliseconds. As in overload the buffer remains nearly full, all TCP connections see similar round trip times. Besides the propagation delay, the link parameters are the following (default values are in parentheses): the transmission capacity C (2 Mbits/s), the buffer size B (50 packets), and a constant packet size equal to the Maximum Transmission Unit MTU (1500 bytes). The considered loads range from 1 to 2 and we use 1.2 as default. The default TCP release is TCP-Reno but we compare it to the other versions of TCP in subsection 4.4. The granularity of the retransmission time is 500 milliseconds and "delayed acknowledgments" is implemented on TCP sinks (200 milliseconds). Unless mentioned, we simulate the arrival process of TCP connections as a Poisson process. As arrivals are correlated on real networks, we test in subsection 4.2 deterministic and Pareto distributed arrival processes varying their parameter. We check there that the arrival process burstiness has a much weaker influence on performance than the distribution of transfer sizes. Various theoretical connection size distributions are considered: constant, exponential, hyper-exponential, Pareto and an empirical distribution. This empirical distribution of transfer sizes is drawn from measurements we get on an Internet POP (Point Of Presence) concentrating DSL (Digital Subscriber Line) traffic generated by residential customers between a BAS (Broadband Access Server) and its core router. We observe that this empirical distribution is stable from one day to the other. Transfer sizes have a high variance and while almost all transfers are less than a few kilobytes, most of the traffic is due to transfers larger than one megabyte. The mean connection size is 8.2 Kbytes. We use this empirical distribution to generate transfer size except in subsection 4.1. The network architecture of DSL access services is more precisely described in [9]. Transfers are defined by a 5-tuple: source and destination IP addresses and ports and protocol type.
3.
Processor Sharing Queue in Overload
We recall in this section the results of [6] describing the transient behavior of processor sharing (PS) system in overload. We will then check in the following sections if simulations of TCP connections fed to an
overloaded link result in similar behavior and performance to this theoretical model. Jean-Marie and Robert [6] derive the transient behavior of the PS queue in overload when customers arrive according to a stationary ergodic marked point process. They obtain that the normalized population size N(t)/t tends almost surely to a limit α, depending on the arrival rate λ and on the distribution of service sizes B, where α is the unique solution of the equation: α = λ (1 − ∫ e −ασ / C B (dσ )) . (1) If Wn is the sojourn time of the n-th customer and tn its time of arrival, the authors show that the normalized waiting time converges in distribution to: Wn ασ / C → e −1 . (2) tn The sojourn time in a PS queue in overload has thus the following asymptotic characteristics. The time to complete a transfer of size σ started at time t after congestion: • increases linearly with time t, • increases exponentially with size σ, • is independent of the link capacity C. As we will see in the next section these expressions may lead to very resistant performance in overload depending on the distribution of transfer size B. We next study through simulations the behavior of TCP in transient overload.
(
4.
)
Increase rate
We consider in this section the performance obtained through simulations. We assume an overload on an Internet link lasting one hour. This may correspond for example to the repair time of a failure. We study more precisely the impact of many parameters of the system on the increase rate of the number of active transfers, i.e. the criterion α in the previous section. As TCP flow control mechanisms intend to share fairly the bandwidth between active TCP connections, α gives an insight on the mean throughput per connection after a given duration of overload. According to the PS model, the load and the transfer size distribution have a major impact. We verify this in subsection 4.1. According to the model, the increase rate does not depend on the arrival process except its mean and scales perfectly with capacity. We check these results respectively in subsections 4.2 and 4.3. Finally we study in subsection 4.4 the impact of the TCP release.
Proceedings of the Advanced International Conference on Telecommunications and International Conference on Internet and Web Applications and Services (AICT/ICIW 2006) 0-7695-2522-9/06 $20.00 © 2006 IEEE
4.1.
Distribution of transfer sizes and load
We plot on Figure 2 the number of ongoing connections as a function of time since the start of the overload for various distributions of sizes. For this figure and all the following ones, the order of the legend is the order of the curves, from top to down. We first observe that this number increases linearly with time for all distributions. We plot the curves for distributions with the highest variance, i.e. the empirical, hyper-exponential with coefficients of variation 3 and 10, and Pareto with power 1.1 and 1.2, at a higher scale on Figure 2b because they are an order of magnitude smaller. The later appear much more chaotic but they still show a clear linear increase tendency. As already observed in [3], the rate of increase of the number of ongoing connections may be much smaller than the difference between the arrival rate and the service rate for some distributions. This can be understood as if small connections manage to finish transmitting in spite of the persistent presence of long transfers. We remark that the empirical distribution gives far lower increase rate than all the other distributions.
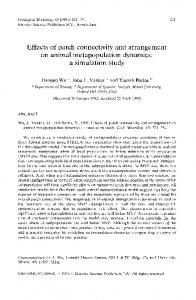
Figure 3 shows the dependence of the population increase rate on the load for various distributions of sizes. The upper diagram presents the curves for the PS system, the lower diagram for TCP simulations. We only consider light overloads where the load is less than 2. We note a similar behavior in each case: the increase rates grow with the load. Comparing constant, exponential and hyper-exponential distributions, larger variances seem to result in smaller increase rate. Pareto distributions show also better performance with parameter 1.1 than with 1.2. However the curves may cross. This is not due to TCP mechanisms as PS show similar result. Heavy tailed distributions do not necessarily result in better performance, even if it is usually true. We also note that the hyper-exponential distribution (cv=10) and the empirical distribution are less sensitive to variations in overload.
(a)
(a)
(b) Figure 3. Population increase rate for different service time distributions as function of load with processor sharing (a) and on TCP simulations (b).
(b) Figure 2. Number of ongoing connections during an hour for different distributions of transfer sizes.
Comparing both graphics we remark that for any distribution TCP simulations give much higher increase rates than the PS model. This can be explained first by packet retransmissions which increase the
Proceedings of the Advanced International Conference on Telecommunications and International Conference on Internet and Web Applications and Services (AICT/ICIW 2006) 0-7695-2522-9/06 $20.00 © 2006 IEEE
effective offered load as shown in [10]. Another possible cause may be a difference in the sojourn time distributions depending on transfer sizes, as studied in the next section. There are a great number of short transfers and according to the Little's formula they are more numerous if their mean sojourn time is longer.
4.2.
Arrival process
Previous simulations have been done assuming for sake of simplicity Poisson arrivals. This hypothesis does not hold on real networks. The main reason is that connection arrivals are most of the time correlated. We analyze then in this subsection the impact of the arrival process on the increase rate. According to the PS model [6], the increase rate of population in overload is independent of the nature of the arrival process; it depends only on its mean. Figure 4 shows the increase rate on TCP simulations for independent identically distributed inter-arrival times with various distributions: deterministic, and Pareto with power equal to 1.1, 1.2 and 1.5. We notice that the arrival process influences the increase rate of TCP ongoing connections. More precisely, arrival processes with higher variances tend to give worse performance. This may be explained by the slower service rate of transfers arriving in bursts, and they stay then longer in the system. Nevertheless the system is far less sensitive to the arrival process than to the transfer size distribution.
plot Nt/t*C/C0 as a function of the link capacity C which varies from 2 Mbits/s (C0) to 30 Mbits/s. Despite simulation errors the increase rates obtained over the range of link capacities vary in a factor of 4 which is however quite small with respect to their dependence to the load or the family of distributions of transfer sizes. The system considered does not scale perfectly with the link capacity as network delays, TCP timeout values and packet sizes are kept constant. From this result, we could try to estimate the influence of the ever growing network capacities on the results of our study. Higher capacities seem to lead to quicker effects of overloads.
Figure 5. Population increase rate depending on link capacities.
4.4.
TCP release
We observe on Figure 6 the increase rate depending on the load for three TCP releases: Tahoe, Reno and Selective Acknowledgments. We remark that the three respective curves are very close. The impact of the release of TCP on the performance of the system in overload appears then really minor.
Figure 4. Population increase rate for different arrival processes.
4.3.
Link capacity
According to the PS model, the asymptotic population increase rate scales with the link capacity given the system load and the transfer size distribution. The results obtained with TCP simulations, and shown on Figure 5, do not confirm exactly this property. We
Figure 6. Population increase rate for different versions of TCP.
Proceedings of the Advanced International Conference on Telecommunications and International Conference on Internet and Web Applications and Services (AICT/ICIW 2006) 0-7695-2522-9/06 $20.00 © 2006 IEEE
5.
Sojourn times
We analyze in this section the properties of the transfer times observed with TCP in overload and compare them to those obtained with a PS queue. We consider performance as acceptable if a standard web page can appear in less than ten seconds. This subjective criterion is chosen by arguing that the Internet is used both for interactive applications and for background transfers. During an overload, interactive applications are more critical and an acceptable degraded network service should transfer most interactive transactions in few seconds.
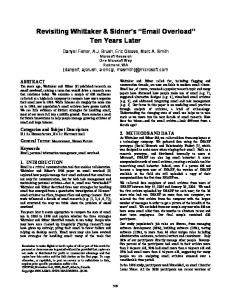
Figure 8 shows the normalized transfer time as a function of transfer size on a 5 minutes slot every 20 minutes. We observe that the mean normalized transfer time has converged after 20 minutes. We also notice that it appears to be a linear function of the transfer size on NS simulations as for PS. The equation (2) predicts an exponential dependence, but on the considered range of sizes the linear approximation is really close to the exponential function. We also observe on Figure 8 that the TCP performance degrades at least an order of magnitude faster than the PS performance. Moreover, this ratio remains approximately constant. Long connections are thus as affected as short ones.
Figure 7. Mean normalized transfer times as a function of the arrival time, for various transfer sizes. Figure 7 presents the mean normalized transfer time depending on the load for various transfer sizes with a Pareto distribution of transfer sizes. According to the PS equation (2), normalized transfer times converge to a limit depending only on transfer size, given the link capacity, the load and the distribution of sizes. We first notice on Figure 7 that the mean normalized transfer time effectively converges quickly.
Figure 8. TCP mean normalized transfer times through successive periods of five minutes compared to processor sharing.
Figure 9. 90th, 75th and 50th percentile, and mean sojourn time for various transfer sizes. The dispersion of transfer times is an important performance criterion for interactive applications. And it may have a major impact on user behavior, impatience and reattempts. We plot on Figure 9 the 90th, 75th and 50th percentiles and the mean of the sojourn time for different transfer sizes as a function of overload duration. We observe that after one hour of overload, 90% of the completion times of transfers smaller than 3 packets (i.e. 4500 bytes) are smaller than 3 seconds. We also note that the coefficient of variation is larger for short transfers than for large ones. For transfers up to 15 packets (22.5 kilobytes) the median is much smaller than the 90th percentile or even the mean. Thus users may be encouraged to reattempt a transmission if the response is not fast enough. According to the PS model, the normalized transfer time tends to a deterministic limit for a given transfer size. This limit increases exponentially as a function of the volume to be transferred. Figure 10 shows the normalized transfer times depending on the sizes of the
Proceedings of the Advanced International Conference on Telecommunications and International Conference on Internet and Web Applications and Services (AICT/ICIW 2006) 0-7695-2522-9/06 $20.00 © 2006 IEEE
TCP connections.
Figure 10. 90th percentile, mean and occurrences of the normalized transfer time of simulated TCP connections appearing after 1h of overload. Points correspond to single measurements. The continuous line corresponds to the mean as a function of transfer size, and the dashed line to the 90th percentile. We notice on Figure 10, that the 90th percentile is many times the mean., and some transfers have even sojourn times many orders of magnitude larger than the 90th percentile. We have shown in [10] that this can be explained by TCP retransmissions impacting transfers with a very high variance due to the timer granularity. Then the simulated normalized transfer times are still far from converging after one hour of overload. We believe that reducing the dispersion of transfer times will then highly improve the perceived performance, especially for short transfers. Various mechanisms may be investigated to reduce this dispersion. One possibility is to reduce the loss rate for example with mechanisms such as ECN (Explicit Congestion Notification). Another possibility is to reduce the impact of losses modifying for example timers. As the short transfers seem more sensitive to this dispersion, it may be worthwhile to prioritize them. These various suggestions have however many impact on other performance criteria and they need further investigations.
6.
Conclusions and future works
We have analyzed through simulations the impact of light overloads on the performance of TCP connections. TCP behaves similarly to the PS in overload in many aspects. The number of on-going connections and the transfer times increase linearly with time. Higher variance of transfer sizes leads usually to a lower increase rate. We have highlighted
that the distribution of transfer sizes observed on real networks is especially favorable to a slow degradation of the performance in light overload. These results do not depend on the TCP releases. We have however noticed and tried to explain some differences between the PS model and the TCP simulations, especially concerning TCP's much worse performance. We have also observed that the increase rate depends on the arrival process: higher variance gives worse performance. The link capacity has a much lower impact so all these results will still hold in the future in spite of higher link capacities. The last difference between TCP simulations and the PS model is that the dispersion of transfer times scales with time. For a given transfer size, the mean transfer time converges rather quickly to a limit. However the dispersion of transfer times remains still very important after one hour of overload, especially for small transfers. Thus small transfers do not take advantage of their size to finish before longer ones as they do in a PS queue. We propose many suggestions to improve the performance by reducing this dispersion. They will be analyzed in future works.
7.
References
[1] S. Iyer, S. Bhattacharyya, N. Taft, and C. Diot, "An approach to alleviate link overload as observed on an IP backbone", Proceedings of IEEE INFOCOM '03, San Francisco, CA, Apr. 2003. [2] T. Bonald, J. Roberts, "Performance modelling of elastic traffic in overload", Proceedings of ACM Sigmetrics 2001 pp. 342--343, 2001. [3] T. Bonald, J. Roberts, "Congestion at flow level and the impact of user behaviour", Computer Networks Vol 42, pp 521-536, 2003. [4] S. Yang, G. de Veciana, "Bandwidth sharing: The role of user impatience", Proceedings of IEEE Globecom 2001, pp. 2258-2262. [5] B. Schroeder, M. Harchol-Balter, "Web servers under overload: How scheduling can help", 18th International Teletraffic Congress, Berlin, Germany, September 2003. [6] A. Jean-Marie, P. Robert, “On the transient behavior of the processor sharing queue”, Queueing Systems, Theory and Applications 17 (1994), 129-136. [7] P. Brown, D. Collange "Impact of P2P traffic on the stability of Internet" 2nd EuroNGI Workshop “New Trends in Modelling, Quantitative Methods and Measurements” Aveiro, Portugal, November 2005. [8] "The ns Manual" K.Fall K. Varadhan editor, october 2005, http://www.isi.edu/nsnam/ns/ [9] P. Komisarczuk, "IP Access Service Provision for Broadband Customers" IEE Colloquium on Services Over the Internet - What Does Quality Cost?, IEE, 1999, London. [10] P. Brown, D. Collange "Performance of TCP in overload" Note Technique France Télécom R&D NT/FTRD/8555, April 2004.
Proceedings of the Advanced International Conference on Telecommunications and International Conference on Internet and Web Applications and Services (AICT/ICIW 2006) 0-7695-2522-9/06 $20.00 © 2006 IEEE