method has been developed and validated for the simultaneous estimation of drotaverine ... The mobile phase consisted of acetonitrile - triethylamine â water ..... application hence, utilised as quality control tool for the simultaneous estimation ...
Available online at www.derpharmachemica.com
Scholars Research Library Der Pharma Chemica, 2010, 2(2): 141-151 (http://derpharmachemica.com/archive.html) ISSN 0975-413X
Simultaneous estimation and validation of Drotaverine Hydrochloride and Nimesulide in tablet dosage form using Reversed-Phase HPLC Raj K. Prasada* and Rajesh Sharma* *
School of Pharmacy, Devi Ahilya Vishwavidyalaya, Takshshila Campus, Indore, M. P., India ______________________________________________________________________________ Abstract A simple, rapid, fast and precise reversed-phase high performance liquid chromatographic method has been developed and validated for the simultaneous estimation of drotaverine hydrochloride and nimesulide in tablet dosage form. Best separation was achieved using a Luna C18 (5µm×25cm×4.6mm i.d) column with the flow rate of 1.0 ml min-1. The analytes were monitored at 239 nm. The mobile phase consisted of acetonitrile - triethylamine – water (65:0.3:34.7 v/v/v), adjusted to pH 4.5 with 5% o-phosphoric acid. Under this conditions the retention time were of 4.14 and 5.87 minute respectively for drotaverine hydrochloride and nimesulide, indicating that the compounds were well separated. Total run was completed within eight minute. The method was validated for accuracy, precision, linearity, specificity and sensitivity as per ICH norms. The developed and validated method was successfully used for quantitative analysis of commercial formulation Nobel spas tablets. Validation study revealed that the method is specific, rapid, accurate, precise, reliable and reproducible. Keywords: Drotaverine Hydrochloride, Nimesulide, RP-HPLC. ______________________________________________________________________________ INTRODUCTION Drotaverine hydrochloride (DROT) is an analogue of papaver. Chemically it is 1-[(3, 4-[diethoxy phenyl) methylene]-6, 7-diethoxy-1, 2, 3, 4-tetrahydro isoquinolene [1]. DROT generally acts as an antispasmodic agent [2] by inhibiting phosphodiesterase IV enzyme, specific for smooth muscles spasm and pain associated with labor. Chemical structure of drotaverine hydrochloride is reported in (Fig.1a). It is not official in USP, BP and IP. Literature survey revealed that chromatographic method was reported for its estimation from human plasma [3] and urine [4] and spectrophotometric methods for estimation in single [5] and combined dosage forms[6, 7]. Nimesulide (NIMS) is an anti-inflammatory drug. Chemically, NIIMS is N-(4-nitro-2phenoxphenyl) methane sulphonamide. It is a potent selective cyclo-oxygenase-2 (COX-2) 141 www.scholarsresearchlibrary.com
Rajesh Sharma et al Der Pharma Chemica, 2010, 2 (2): 141-151 ______________________________________________________________________________ inhibitor and is highly effective in the treatment of various forms of pain and inflammatory conditions. Chemical structure of nimesulide is reported in (Fig.1b). It is official in USP BP and IP. A survey of the literature revealed that only a few UV [8-11] and visible spectrophotometric [12], liquid chromatography methods [13-18] and estimation from human plasma and urine [19, 20] have been reported for the estimation of nimesulide. NH
NHSO2CH3
OC2H5
O
.HCl OC2H5
C2H5O NO2
(b)
OC2H5
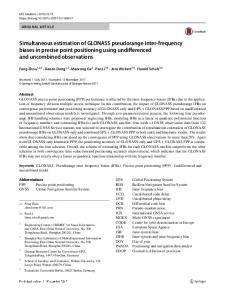
(a) Figure 1. Chemical structure of (a) DROT and (b) NIMS. RESULTS AND DISCUSSION HPLC Method Development and Optimization Column chemistry, solvent type, solvent strength (volume fraction of organic solvents in the mobile phase and pH of the solution), detection wavelength and flow rate were varied to determine the chromatographic conditions giving the best separation. The mobile phase conditions were optimized so that the components were not interfered from the solvent and excipients. Other criteria like time required for analysis, appropriate k range for eluted peaks, assay sensitivity, solvent noise and use of the same solvent system for extraction of drug from formulation matrices during drug analysis were also considered. After trying different column, the final choice of the stationary phase giving satisfactory resolution and run time was the reversed phase column Luna C18 . A series of aqueous mobile phases containing TEA solutions of different pH in combination and different volume fractions acetonitrile as modifiers were also tested. The best results were obtained by use of the mobile phase, pH adjusted to 4.5 with 5% o-phosphoric acid. The flow rate was determined by testing the effect of different flow rate on the peak area and resolution, flow rate of 1.0ml min-1 was found optimum. All experiments were carried out at ambient temperature. To determine the appropriate wavelength for simultaneous determination of DROT and NIMS solutions of these compounds in the mobile phase were scanned by UV–visible spectrophotometry (Shimadzu 1700) in the range 200–400 nm. From the overlain UV spectra, suitable wavelength choices considered for monitoring the drugs were 239 nm Fig. 2. Solutions injected directly for HPLC analysis and the peak area were recorded at 239 nm. It was observed there was no interference from the mobile phase or baseline disturbance and all the analyte absorbed well at 239 nm.
142 www.scholarsresearchlibrary.com
Rajesh Sharma et al Der Pharma Chemica, 2010, 2 (2): 141-151 ______________________________________________________________________________
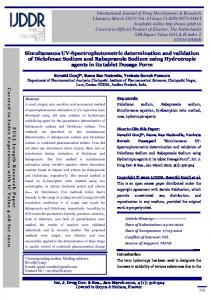
Figure 2. The overlain spectra of DROT and NIMS Under these optimum chromatographic conditions, a satisfactory separation of mixture compounds was achieved. All two compounds eluted within 7 min and satisfactory values for required chromatographic parameters were obtained. The retention times obtained for DROT and NIMS were 4.14 and 5.87 min respectively (Fig. 3 and 4). The resolution (Rs) between DROT and NIMS was 4.64. The result of capacity factor, tailing factor, theoretical plate’s number are reported in Table 1. The values obtained for these properties shows (RS > 2) show these chromatographic conditions are appropriate for separation and quantification of these two compounds. The number of plates (N) is a measure of column efficiency; which shows the good separation efficiency of the column used.
Figure 3. Chromatogram of DROT and NIMS in sample solution along with their retention
143 www.scholarsresearchlibrary.com
Rajesh Sharma et al Der Pharma Chemica, 2010, 2 (2): 141-151 ______________________________________________________________________________
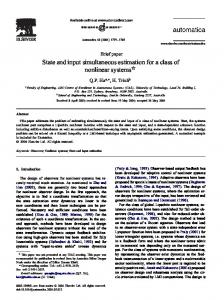
Figure 4: 3D chromatogram of sample solution of DROT and NIMS Table 1- Optimized chromatographic conditions and system Suitability Chromatograph Mobile Phase Column Detection wavelength Injection volume Temperature Run time Flow rate
Shimadzu HPLC model LC-10 AT VP. acetonitrile: TEA: water (65:0.3:34.7 v/v/v) Luna C18 (5µ m×25cm×4.6mm i.d). 239 nm. 20 µ L Ambient 10 min. -1 1.0 ml min .
PARAMETERS (n=6)
DROT
NIMS
Rt (Retention time) Tf (Tailing factor) k (Capacit y factor) N (Plates number) Rs (Resolution)
4.14 1.25
5.87 1.42
0.65 2696 -
1.55 3346 4.64
Assay of Tablet Formulation The amounts of DROT and NIMS per tablet were determined by extrapolating the value of area from the respective calibration curve. Results are reported in table 2.
144 www.scholarsresearchlibrary.com
Rajesh Sharma et al Der Pharma Chemica, 2010, 2 (2): 141-151 ______________________________________________________________________________ Table 2- Results of assay of tablet formulation Amount found (mg) % of drug S.D. (n=5) content
% COV
S.E.
DROT 40
40.03
100.07
0.052
0.052
0.037
NIMS
99.97
99.97
0.283
0.284
0.200
Drug
Label claim (mg/tab)
100
S.D.: Standard deviation, COV: Coefficient of variance, S.E.: Standard error.
Validation of the Developed Method The method was validated for linearity, accuracy, precision, repeatability, selectivity and specificity study. All the validation studies were carried out by replicate injection of the sample and standard solutions. Linearity The linearity was determined for DROT and NIMS separately by plotting a calibration curve of peak area against their respective concentration. From the calibration curve it was found the linearity range between 5-40 µg mL-1 and 10-50 µg mL-1 for DROT and NIMS respectively. Drug samples were quantified with reference to these calibration plots (Fig.5 and 6). The linear regression equation for DROT and NIMS were; DROT Area = 30539 conc. – 10109 (n=6, r2 =0.9995) NIMS Area = 36861 conc. – 107991 (n=6, r2 =0.9998) Where y: area and x: concentration.
Linearity of DROT y = 30178x - 4912.4 R 2 = 0.9998
1400000
Peak Area
1200000 1000000 800000 600000 400000 200000 0 0
10
20
30
40
50
Concentration (µg ml-1)
Figure 5. Calibration curve of DROT
145 www.scholarsresearchlibrary.com
Rajesh Sharma et al Der Pharma Chemica, 2010, 2 (2): 141-151 ______________________________________________________________________________ Linearity of NIMS y = 36861x - 107991 R 2 = 0.9998
Peak A rea
2000000 1500000 1000000 500000 0 0
10
20
30
40
50
60
Concentration (µg/ml)
Figure 6. Calibration Curve of NIMS Accuracy Accuracy of the developed method was conformed by doing recovery studies as per ICH norms at three different concentration levels 80%, 100%, 120% by replicate analysis (n=6). Here to a preanalysed sample solution, standard drug solutions were added and then percentage of drug content was calculated. From the recovery study it was clear that the method is very accurate for quantitative estimation of DROT and NIMS in tablet dosage form. The statistical results were found within the acceptance range i.e. %COV< 2.0 and S.D. < 1.0, Table 3. Table 3- Results of Recovery Studies %Mean Level of % (n=3) recovery DROT 80 100.07 100 100.88 120 100.25
Recovery NIMS 100.47 100.61 100.03
% COV
S.D. DROT 0.133 0.702 0.433
NIMS 0.641 0.558 0.046
DROT 0.133 0.696 0.432
NIMS 0.638 0.554 0.046
S.D.: Standard deviation, COV: Coefficient of variance
Table 4- Intraday, Interdays, LOD and LOQ data %COV Drug
Intraday (n=6)
Interdays (n=6)
DROT NIMS
0.527 0.231
0.396 0.363
LOD (ng mL-1)
LOQ (ng mL-1)
12.51 26.56
38.10 99.35
COV: Coefficient of variance, LOD and LOQ is least of detection and least of quantitation.
146 www.scholarsresearchlibrary.com
Rajesh Sharma et al Der Pharma Chemica, 2010, 2 (2): 141-151 ______________________________________________________________________________ Precision, LOD and LOQ study Precision study was carried out by doing intra and inters day study. For intra day precision study concentration of three drugs were calculated for three times on the same day at an interval of 1 hr. In inter day study the concentration of drug contents were calculated on three different days. Both LOD and LOQ values were calculated according to the equation: LOD = 3.3 σ / S, LOQ = 10 σ / S, Where σ is the standard deviation and S is the slope of the curve, Table 4. Selectivity and Specificity To check the selectivity of the developed method solutions of all the two drugs were injected into the system and it was observed that two sharp peaks of DROT and NIMS were obtained at retention time of 4.14 and 5.87 min respectively in reference to placebo solution. Specificity of the method was assessed by comparing the chromatograms obtained from standard drugs (Fig. 6a and 6b), with the chromatogram obtained from tablet solutions. As the retention time of standard drugs and the retention time of the drugs in sample solutions were same, so the method was specific. The developed method was found specific and selective as there was no interference of excipients found.
(a)
(b) Figure 6. Chromatograms of (a) DROT (b) NIMS and their retention time 147 www.scholarsresearchlibrary.com
Rajesh Sharma et al Der Pharma Chemica, 2010, 2 (2): 141-151 ______________________________________________________________________________ MATERIALS AND METHODS Chemical and Reagents DROT and NIMS reference drug were obtained as gift sample from Plethico Pharmaceutical Ltd. India. The tablet dosage form, Nobel spas manufactured by Akums drugs and pharmaceuticals Ltd., Ranipur, Haridwar, India (Label claim: 40mg DROT and 100mg NIMS) was procured from the local market. All the chemical and reagents used were of HPLC grade and purchased from Spectrochem, Mumbai, India.
(a)
(b) Figure 7: 3D Plot- (a) DROT (b) NIMS: The retention time response to Acetonitrile in mobile phase
148 www.scholarsresearchlibrary.com
Rajesh Sharma et al Der Pharma Chemica, 2010, 2 (2): 141-151 ______________________________________________________________________________ Instrumentation and Chromatographic Conditions HPLC analysis was performed with a Shimadzu chromatograph equipped with an LC-10 AT vp solvent-delivery system with universal loop injector (Rheodyne 7725i) of injection capacity of 20 µL. Detector consist of photodiode array detector SPD-10 AVP UV-Visible detector. Compounds were separated on a Phenomenex Luna C18 analytical column (5µm×25cm×4.6mm i.d) under reversed phase partition chromatographic conditions. Mobile phase and solutions were degassed using sonicator and vacuum filtered through 0.2 µm nylon 6, 6 membranes (Ultipor, Pall Life sciences, Mumbai) before the use. The work was carried out in an air-conditioned room maintained at temperature 25±20C. 3D surface plot of DROT and NIMS, retention time response to acetonitrile reported in (Fig. 7a and b). The mobile phase consisted of acetonitrile – triethylamine (TEA) – water (65:0.3:34.7 v/v/v) and pH adjusted to 4.5 with 5% o-phosphoric acid. Isocratic elution was performed at a flow rate of 1.0 ml min-1 and UV- detection at 239 nm. The run time was of 10 min. The identities of the two compounds were established by comparing retention time of the sample solution with those of standard solutions. After chromatographic conditions were set, the instrument was stabilized to obtain a steady base line (Placebo chromatograms) Fig. 8, Chromatograms was recorded using CLASS-VP software (Shimadzu, Kyoto, Japan) using PC work station.
Figure 8. Chromatogram of Placebo Solution Preparation of Standard Solution Weighted the accurately 10 mg DROT and NIMS and transferred to 100 ml volumetric flasks separately. All the two drugs were dissolved and make up the volume up to 100 ml with HPLC grade acetonitrile, to prepare standard stock solution of 100µg mL-1. Preparation of Sample Solution For analysis of the tablet dosage form, twenty tablets of Nobel spas were weighted individually and their average weight was determined and crushed to fine powdered. Amount equivalent to weight of one tablet was transferred in to 100 ml volumetric flask, dissolved in approximately 25 ml of acetonitrile. The solution was sonicating for 15 min and the solution diluted up to volume with the same solvent and filtered. Solution was further diluted in 10 ml of volumetric flask to 149 www.scholarsresearchlibrary.com
Rajesh Sharma et al Der Pharma Chemica, 2010, 2 (2): 141-151 ______________________________________________________________________________ get required concentration with the same solvent. Each solution was chromatographed three times. All solutions were freshly prepared before the analysis. Preparation of Calibration Plots Different dilutions were prepared from the standard stock solutions of the two drugs and their area was calculated. The calibration curve was plotted between concentration against their respective area for DROT and NIMS separately Assay of Tablet Formulation Six replicates of required dilutions were prepared from the tablet stock solution and sonicate for 10 min. Then 20µl of the sample solution was injected for quantitative analysis. The amounts of DROT and NIMS per tablet were determined by extrapolating the value of area from the respective calibration curve. Analytical Validation The method was validated for linearity, accuracy, precision, repeatability, selectivity and specificity. Accuracy study was carried out by doing recovery study as per ICH norms [21, 22] at three different levels 80%, 100%, 120%. Precision was carried out by doing intra and inter day precision study. In intraday study concentration of all the two drugs were calculated for three times on the same day at an interval of one hour. In inter day study the concentration of drug contents were calculated on three different days. Selectivity and specificity of the method was validated by injecting solutions and after running, two sharp peaks were obtained. Limit of detection (LOD) and Limit of Quantitation (LOQ) study was carried out to evaluate the detection and quantitation limits of the method to determine presence of any impurities [23]. CONCLUSION A new, rapid, sensitive and accurate RP- HPLC method for simultaneous estimation of DROT and NIMS in tablets dosage form has been developed. It is shown above that the developed method achieved accuracy, reproducibility; repeatability, linearity, precision and selectivity prove the reliability of the method. The run time is relatively short i.e. with in eight min., which enables rapid quantitation of many samples in routine and quality control analysis of tablet formulation. The same solvent was used through out the experimental work and no interference of any excipients matrices was found. As the result shows that the method could find practical application hence, utilised as quality control tool for the simultaneous estimation of two drugs from their combined dosage form in quality control laboratory, as well as purity and stability testing. Acknowledgments The authors are thankful to Plethico pharmaceutical Ltd. Indore, India, for gift sample of pure drotaverine hydrochloride and nimesulide and thanks to Head, School of Pharmacy for providing facilities to carry out all the proposed work. One of the authors Mr. Raj K. Prasad is grateful to All India council of Technical education (AICTE) for providing junior research fellowship.
150 www.scholarsresearchlibrary.com
Rajesh Sharma et al Der Pharma Chemica, 2010, 2 (2): 141-151 ______________________________________________________________________________ REFERENCES [1] S. Budavari, A. Smith, P. E. Heckelman, In: The Merk Index: An Encyclopedia of Chemicals, Drugs and Biological, merck & Co., Inc. Whiehouse Station, New Jersey, 2001. [2] P. P. Dahivelkar, V. K. Mahajan, S. B. Bari, A. A. Shirkhedkar, S. J. Suran, Indian drugs, 2006, 43(11), 896-900. [3] J. K. Lalla, M. U. Shah, M. B. Jain, A. H. Sharma, J. Pharm. Biomed. Ana, 1993, 11(4-5), 385-388. [4] O. O. Bolaji, C. O. Onyeji, J. of Chromatogr. Biomed. App., 1993, 622(1), 93-97. [5] V. K. Mahajan, P. P. Dahivelkar, R. A. Fursule, A. A. Shirkhedkar, S. J. Surana Indian drugs, 2006, 43(8), 656-659. [6] A. S. Amin, F. El-sheikh Zahran, A. A. El-fetouh Gouda, Spectrochim Acta A: Mol. Biomol. Spectros., 2007, 6-7(3-4), 1088-1093. [7] E. A. Hisham, M. A. Magda, V. Suzan, F. Y. Nadia, Spectrochim Acta A Mol Biomol Spectrosc., 2006, 18, 1021 [8] S. Chandran, S. Saggar, K. P. Priya, N. Ranendra, Drug Development and Industrial Pharmacy, 2000, 26 (2), 229–234 [9] S. Altino, O. O. Dursun, J. Pharm Biomed Ana., 2000, 22, 175–182. [10] K. Ashok, B. Anroop, K. S. Vijay, Indian drug, 2003, 40(12), 727-729. [11] H. Verma, N. Bairwa, A. Sinha, S. M. Verma, P. R. P. Verma, J. Inst. of Chem.. India, 2005, 77(5), Part 1. [12] S. R. Chilukuri, L. M. N. Reddy, Spectrophoto. Microchem. Acta., 1999, 132(1), 1-6. [13] S. Indrajeet, Philippine J. Sci., 2002, 131(1), 59-64. [14] B. S. Nagaralli, J. Seetharamappa, B. G. Gowda, M. B. Melwanki, J. of Analy. Chem., 2003, 58(8), 778–780. [15] M. Hemlata, S. P. Wate, D. P. Dharkar, R. Razdan, 2007, 69 (2), 281-183. [16] B. P. Vandana, S. D'Souza, Y. Narkar, J. Phram. Biomed. Ana., 2001, 25 (3-4), 685-688. [17] C. Ravelet, A. Geze, A. Villet, C. Grosset, A. Ravel, D. Wouessidjewe, E. Peyrin, J. Pharm. Biomel Ana., 2002, 29 (3), 425-430. [18] K. E. V. Nagoji, S. Vijayasrinivas, K. M. Kumar, N. Mathivanan, S. M. Kumar, M. E. B. Rao, Indian J. Pharm. Sci., 2003, 65 (4), 407-409. [19] D. Castoldi , V. Monzani , O. Tofanetti , J. Chromatogr. , 1988, 425 (2), 413-8. [20] G. Khaksa and N. Udupa, J. Chromatgr B: Biomed. Sci.Appl., 1999, 727(1-2), 241-244. [21] ICH, Q2A Validation of Analytical Procedures: Consensus Guidelines; ICH harmonized tripartite guidelines, 1994. [22] ICH, Q2B Validation of analytical procedures: Methodology, Consensus Guidelines; ICH harmonized tripartite guidelines, 1996. [23] M. Ribani, C. H. Collins, C. B. G. Bottoli, J. Chromatogr. A, 2007, 1156, 201.
151 www.scholarsresearchlibrary.com