Jasmine Chaudhary et al. IRJP 2011, 2 (12), 81-83 INTERNATIONAL RESEARCH JOURNAL OF PHARMACY Available online www.irjponline.com
ISSN 2230 – 8407 Review Article
SIMULTANEOUS ESTIMATION OF MULTICOMPONENT FORMULATIONS BY UV-VISIBLE SPECTROSCOPY: AN OVERVIEW Jasmine Chaudhary*, Akash Jain, Vipin saini M.M. College of Pharmacy, M.M.University, Mullana, Ambala Article Received on: 14/10/11 Revised on: 20/11/11 Approved for publication: 29/12/11
*Email:
[email protected] ABSTRACT UV-visible spectroscopy, a simple, rapid, precise and highly accurate method for quantitative estimation is in great use now a day. The basic principle behind this technique is that the amount of light absorbed is proportional to the concentration of analyte. Simultaneous equation is applicable for the estimation of those drugs where the spectra of drugs overlap properly whereas multi-component analysis can be applied on any degree of spectral overlap provided that two or more spectra are not similar exactly. Quantitative estimation is necessary before introduction of any drug into the market as either concentration is more in formulation can cause toxicity problem or if concentration is found less, then formulation may not be effective in prescribed dose. Keywords: Simultaneous equation, Isoabsorptive, Derivative, Multicomponent Mode, Area under Curve
INTRODUCTION Analytical chemistry is the branch of science which is useful in all fields of science and medicine due to its versatile applications. It deals basically with the two aspects of chemical characterization i.e. qualitative (what it is) and quantitative (how much it is).1 The qualitative analysis reveals the chemical identity of the sample while quantitative analysis gives the amount of one or more components present in numerical terms. The basic criterion behind these methods is the measurement of some property which is proportional to amount of analyte in sample. Depending on the property to be measured, these methods are classified as classical methods such as gravimetry, volumetry, titrimetry, etc and systemic or instrumental methods like refractometry, colorimetry, absorptimetry etc.1, 2 In present era, market is flooded with various combinations in dosage forms and the number is increasing day by day. 3 These multi-components formulations due to greater patient acceptability, increased potency, multiple action, fewer side effects and quicker relief are gaining interest.4 Therefore, it is desired that these formulations meet all the standards related to their quality, safety & efficacy and this can only be possible if they are analyzed by different methods. The motto behind this quantitative estimation is to ensure that whether a particular drug contains the same amount of drug as mentioned because if the dose given will be high then it will cause over dosage side effects & if it is less then the patient will not get the required dose. For the estimation of multi-component formulation, the instrumental techniques like Spectrophotometric, HPLC, GLC, HPTLC etc are employed due to their inherent advantages viz. avoid time consuming extraction and separation, economical in the sense that use of expensive regents is minimized, equally accurate and precise. These methods are based upon the measurement of specific and nonspecific physical properties of the substances. Sometimes the dosage form in addition to the main drugs known to contain other substances which potentially interfere in the assay and if not corrected may impart a systemic error to the assay. The need to develop new methods to analyze the drugs simultaneously and without interferences is a basic need. Thus, it becomes necessary to develop new analytical methods for such drugs for which no analytical method is still available for estimation. In brief the reasons for the development of newer methods of drugs analysis are: Ø The drug or drug combination may not be official in any pharmacopoeias.
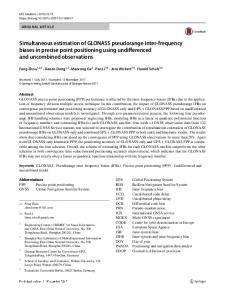
Ø A proper analytical procedure for the drug may not be available in the literature due to patent regulations. Ø Analytical methods for the estimation of drug in combination with other drugs may not be available. Ø The existing analytical procedures may require expensive reagents and solvents. It may also involve cumbersome extraction and separation procedure and these may not be reliable.1, 5 The UV-Visible spectroscopic methods for estimation of drugs are highlighted in this review. Simultaneous Equation Method6, 7, 8 Consider a multicomponent system consisting of two components X and Y, each of which absorbs at the λmax of the other, λ1 being the wavelength of maximum absorbance of X (λmax) and λ2 being the wavelength of maximum absorbance of Y (λmax) (Fig.1.1.) In such cases, it can be possible to determine both the components by simultaneous equation method. The information required is: Ø The absorptivities of X at λ1 and λ2, ax1 and ax2 respectively. Ø The absorptivities of Y at λ1 and λ2, ay1 and ay2 respectively. Ø The absorbance of the diluted sample at λ1and λ2, A1 and A2 respectively. Ø cx and cy be the concentrations of X and Y respectively in the diluted sample. Thus the absorbance of the mixture at λ1 and λ2 may be expressed as follows: A1 = aX1bcX + aY1bcY …………………At λ1 …… (1) A2 = aX2bcX + aY2bcY ………………….At λ2 …… (2) For measurements in 1 cm cell, b = 1, therefore, Cx = A2ay1 – A1ay2/ ax2ay1 – ax1ay2 Cy = A1ax2 – A2ax1/ ax2ay1 – ax1ay2 Using the above two equations the concentration of component X and component Y in the sample mixture can be determined. The Absorption Ratio Method: Isoabsorptive Point Method6 This method is a modification of the simultaneous equations method. According to this method, the ratio of absorbance at any two wavelengths for a substance, which obeys Beer's law, is constant value independent of concentration and path length. This constant is termed as “Hufner’s Quotient’ or Q-value. This method involves the measurement of absorbance at two wavelengths, one being the λ max of one of the components (λ2) and the other being a wavelength of equal absorptivity of the two components (λ1), called as Iso-absorptive point (Fig. 1.2.).5
INTERNATIONAL RESEARCH JOURNAL OF PHARMACY, 2(12), 2011
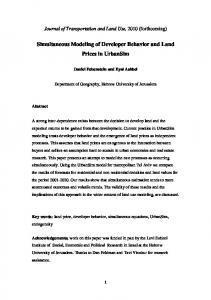
Jasmine Chaudhary et al. IRJP 2011, 2 (12), 81-83 The concentration of each component can be calculated by mathematical equation: Cx = (Qm – Qy / Qx – Qy)* A/ a1 Cy = (Qm – Qx / Qy – Qx)* A/ a2 Where, Cx and Cy = concentration of x and y respectively, A = Absorbance of sample at isoabsorptive wavelength, a1 and a2 = Absorptivity of x and y respectively at isoabsorptive wavelength, Qm = Absorbance of sample solution at λ max of one of the components (λ2) Absorbance of sample solution at isoabsorptive wavelength Qx = Absorptivity of x at λ max of one of the components (λ2) Absorptivity of x at isoabsorptive wavelength Qy = Absorptivity of y at λ max of one of the components (λ2) Absorptivity of y at isoabsorptive wavelength Derivative Spectroscopic Method6 Derivative spectrophotometry involves the conversion of a normal spectrum (fundamental, zeroth order or D spectrum) to its first, second or higher derivative spectrum by differentiating absorbance of a sample with respect to wavelength λ for higher accuracy (Fig.1.3.).4 [A] = f (λ): zero order [dA/dλ ] = f (λ): first order [d2A/d λ 2] = f (λ): second order The strong positive & negative bands with maximum and minimum at same wavelength of an absorption band as inflection point in absorbance band governs the odd (first & third) derivative spectrum whereas the strong positive & negative band with minimum or maximum at same wavelength as λmax of absorbance band governs the even (second & fourth) derivative spectrum.10 Number of bands = Derivative order + 1 The amplitude (D) is directly proportional to the concentration of analyte provided Beer’s law is obeyed by D° spectrum. In first order derivative spectroscopy, zero crossing point for both drugs is found and the wavelengths are selected in a manner such that at the zero crossing of one drug, the other drug should show substantial absorbance. Advantages: • It enhances resolution permitting identification of analyte with close λmax. • It eliminates baseline shift effect arising from instrument or sample handling. • It eliminates scattering effects thus helpful for analyte present in turbid solution.11 Multicomponent Mode Method This method requires two wavelengths. One wavelength is selected such that one drug shows maximum absorbance while other drug shows considerable absorbance. The second wavelength is selected such that other drug shows maximum absorbance while the first one shows considerable absorbance. Consider a mixture consisting of two components M and N where X1 nm and X2 nm are the maximum absorbance of component M and N respectively (Fig.1.4.) The absorbance of mixture containing components M and N at wavelength X1 and X2 may be expressed as follows, A′ = E′MBCM + E′NBCN------------------------------at X1 A′′ = E′′MBCM + E′′NBCN-----------------------------at X2 Using individual standard solution of M and N, the two
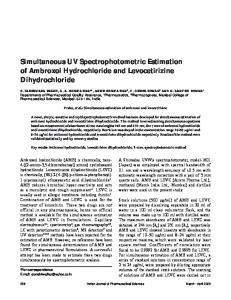
absorptivities (E′M, E′N) at one wavelength and the other two absorptivities (E′′M, E′′N) at the other wavelength can be determined. The absorbance of the mixture A’ and A’’ are experimentally determinable and thus from the above two equations the concentration of the individual constituents CM and CN can be readily calculated. This relationship is valid if Beer’s law is followed and both the components behave independently of one another. Choosing wavelengths at which the differences in molar absorptivities are large, leads to attain greater accuracy in this analysis. Area Under Curve Method6-9 This method also utilizes two wavelength ranges. From the overlain spectra of both drugs the area under curve is determined at both the selected analytical wavelength ranges. Within the above selected wavelength ranges, the area under curve was determined for both the drugs and analysis was performed using “Cramer’s Rule” and “Matrix Method”. Consider a binary mixture consisting of two components M and N. From the two spectra (Fig.1.5. and Fig.1.6.) following information are obtained: M v AUC λ1 – λ2: area under curve for component M at the wavelength range λ1 – λ2. M v AUC λ3 – λ4: area under curve for component M at the wavelength range λ3 – λ4. N v AUC λ1 – λ2: area under curve for component N at the wavelength range λ1 – λ2. N v AUC λ3 – λ4: area under curve for component N at the wavelength range λ3 – λ4. The total area under the curve of a mixture at a particular wavelength range is equal to the sum of area under curve of the individual components at same wavelength range. The area under curve of the mixture containing component M and N can be given as follows: AUC λ1– λ2 = AUCMλ1– λ2 + AUCNλ1 – λ2 ------------------------------- (1) M N AUC λ3 – λ4 = AUC λ3 – λ4 + AUC λ3 – λ4 ------------------------------- (2) Now the above equation can also be written as follows: M N AUC λ1– λ2 = X λ1 – λ2bCM + X λ1 – λ2bCN ------------------------------ (3) M N AUC λ3– λ4 = X λ3 – λ4bCM + X λ3 – λ4bCN- ----------------------------- (4) Where, X λ1 – λ2 = AUC λ1 – λ2/ Conc. in g/l X λ3 – λ4 = AUC λ3 – λ4/ Conc. in g/l
By applying “Cramers Rule” and “Matrix Method”, the concentration of component M and component N can be determined as follows: N N N M N M CM = X λ1– λ2 AUC λ3 – λ4 – X λ3 – λ4 AUC λ1– λ2 / X λ1– λ2 X λ3 – λ4 – X λ3 – λ4 X λ1– λ2 ----------------- (5) M M N M N M CN = X λ1– λ2 AUC λ3 – λ4 – X λ3 – λ4 AUC λ1– λ2 / X λ1 – λ2 X λ3 – λ4 – X λ3 – λ4 X λ1– λ2 --------------- (6)
INTERNATIONAL RESEARCH JOURNAL OF PHARMACY, 2(12), 2011
Jasmine Chaudhary et al. IRJP 2011, 2 (12), 81-83 From the study, it has been found that so many combinations have been successfully estimated by UV-Visible spectroscopic methods like combinations of Diclofenac sodium and tizanidine10, Pantoprazole & domperidone11, Dexibuprofen & Paracetamol12, Enalapril maleate & Amlodipine besylate13, Sulphamethaxole & Trimethoprin14, Rabeprazole and Itopride15, Ondansetron and Paracetamol16, Ofloxacin and Satranidazole17, Nebivolol and Hydrochlorothiazide18, Metronidazole & Amoxicillin19, Norfloxacin & Ornidazole20, Ofloxacin & Ornidazole21etc. CONCLUSION It can be concluded that UV-visible spectroscopy can be effectively used for estimation of many drug combinations for which no method of estimation has been reported so far and it is simple, less time consuming, accurate and highly sensitive. ACKNOWLEDGMENT The authors are very thankful to the management of Maharishi Markandeshwer University, Mullana (Ambala) for constant support. REFERENCES 1. Willard HH, Merritt LL, Dean JA, Settle FA. Instrumental Methods of Analysis. 7th ed. New Delhi: CBS Publishers and Distributors; 2001. Skoog DA, Holler FJ, Nieman TA, Principles of Instrumental Analysis. 5th ed. 2. Thomson Brooks/Cole; 1998. 3. Indian Drugs Review: A. Mediworld Publication, New Delhi. 2006. Tripathi KD. Essential of Medical Pharmacology. 5th ed. New Delhi: Jaypee 4. Brothers Medical Publishers (P) Ltd; 2003. Rashmin. An Introduction to Analytical Method Development for 5. Pharmaceutical Formulations. Pharmainfo.net.2008, 6 (4): 1-11. 6. Beckett AH, Stenlake JB. Practical Pharmaceutical Chemistry. 4th ed. Part 2, New Delhi: CBS Publishers and Distributors; 2002. ICH, Q2A, Text on Validation of Analytical Procedures, International 7. Conference on Harmonization, Geneva; October 1994, 1-5. ICH, Q2B, Validation of Analytical Procedures: Methodology, International 8. Conference on Harmonization, Geneva; November 1996, 1-8. 9. Jadhav SM and Arbad BR. Spectrophotometric methods for simultaneous estimation of tinidazole and nimesulide from tablet formulation. The Indian Pharmacist 2004; III (22): 63-65. 10. Kumar SR, Karthikeyan C, Moorthy NSHN, Trivedi P. New Spectrophotometric Method applied to simultaneous estimation of Diclofenac & Tizanidine hydrochloride. International Journal of Pharmaceutical Sciences 2006, 317-322. 11. Kakde RB, Gedam N, Chaudhary NK, Barsagade AG, Kale DL, Kasture AV. Three-wavelength Spectrophotometric Method for Simultaneous Estimation of Pantoprazole and Domperidone in Pharmaceutical Preparations. International Journal of PharmTech Research 2009; 2(1): 386-389. 12. Chitlange CS, Soni R, Wankhede SB, Kulkarni A. Spectrophotometric Methods for Simultaneous Estimation of Dexibuprofen and Paracetamol. Asian J. Research Chem. 2009; 2(1): 30-33. 13. Garg G, Saraf S, Saraf S. Development and Validation of Simultaneous estimation of Enalapril Maleate and Amlodipine Besylate in Combined dosage forms. Trends in Applied Sciences Research 2008; 3(3): 278-284. 14. Nalewajko E, Galvez M, Benito CG, Calatayud JM. FIA and batch simultaneous determination of sulphamethaxole and trimethoprim in pharmaceutical formulations by derivative spectrophotometry. J.Flow Inj.Anal. 2003; 20: 75-80. 15. Heralgi RV, Simpi CC, Kalyane NV, Karajgi SR. Simultaneous spectrophotometric estimation of rabeprazole & itopride hydrochloride in capsule formulations. Asian J. Pharmaceutics 2008; 148-149. 16. Kumar PR, Krishna MM, Prakash PB, Kumar BA, Madhusudhan P. Derivative Spectroscopic Estimation of Ondansetron and Paracetamol. E.Journal of Chemistry 2006: 3(12): 134-136. 17. Wankhede SB, Prakash A, Chitlange SS. Simultaneous Spectrophotometric Estimation of Ofloxacin and Satranidazole in Tablet Dosage Form. Asian J. Research Chem. 2008; 1(1): 9-11. 18. Tarte PS, Wate SP, Khedikar PB, Satpure BT ,Pawnikar G. Simultaneous Estimation of Nebivolol and Hydrochlorothiazide in Combined Tablet Dosage Form by Multicomponent Mode of Analysis. Asian J. Research Chem. 2008; 1(2): 77-79. 19. Tiwari G, Tiwari R, Srivastava B, Rai A, Pathak K. Simultaneous Estimation of Metronidazole and Amoxicillin in Synthetic Mixture by Ultraviolet Spectroscopy. Asian J. Research Chem. 2008; 1(2): 91-94. 20. Wankhede SB, Prakash A, Chitlange SS, Kumari B. Simultaneous Spectrophotometric Estimation of Norfloxacin and Ornidazole in Tablet Dosage Form. Indian J. Pharm. Sci. 2009; 71(3): 325-328. 21. Bhusari KP, Chaple DR. Simultaneous Spectrophotometric Estimation of
Ofloxacin and Ornidazole in Tablet Dosage Form. Asian J. Research Chem.2009; 2(1): 60-62.
Fig: 1.1. Overlain spectra of component X, Y and Mixture containing X & Y
Fig: 1.2. Overlain spectra of component X and Y.
Fig.1.3 Zero, First, Second, Third and Fourth order derivative spectra of gaussian peak
Fig: 1.4. Overlain spectra of component M, N and Mixture containing M & N.
Fig: 1.5. Spectra showing Area under Curve for drug M.
Fig: 1.6. Spectra showing Area under Curve for drug N
INTERNATIONAL RESEARCH JOURNAL OF PHARMACY, 2(12), 2011