Oct 5, 2009 - ing a mapping between feature space and control space. We show both in ..... replaced with two cheap web cameras. We do not use a ...
Linköping University Post Print
Simultaneously learning to recognize and control a low-cost robotic arm
Fredrik Larsson, Erik Jonsson and Michael Felsberg
N.B.: When citing this work, cite the original article.
Original Publication: Fredrik Larsson, Erik Jonsson and Michael Felsberg, Simultaneously learning to recognize and control a low-cost robotic arm, 2009, Image and Vision Computing, (27), 11, 1729-1739. http://dx.doi.org/10.1016/j.imavis.2009.04.003 Copyright: Elsevier Science B.V., Amsterdam. http://www.elsevier.com/ Postprint available at: Linköping University Electronic Press http://urn.kb.se/resolve?urn=urn:nbn:se:liu:diva-21195
Simultaneously Learning to Recognize and Control a Low-Cost Robotic Arm Fredrik Larsson, Erik Jonsson and Michael Felsberg Computer Vision Laboratory, Department of E.E. Link¨ oping University, Sweden
October 5, 2009 Abstract In this paper we present a visual servoing method based on a learned mapping between feature space and control space. Using a suitable recognition algorithm, we present and evaluate a complete method that simultaneously learns the appearance and control of a low cost robotic arm. The recognition part is trained using an action precedes perception approach. The novelty of this paper, apart from the visual servoing method per se, is the combination of visual servoing with gripper recognition. We show that we can achieve high precision positioning without knowing in advance what the robotic arm looks like or how it is controlled.
1
Introduction
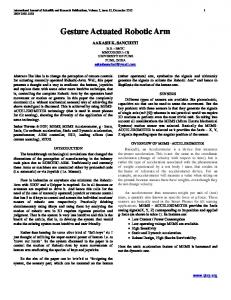
Low cost robotic systems become increasingly available. This requires appropriate methods to control the system despite limitations such as weak servos, no joint feedback and hysteresis. Classical methods based on modeling the inverse kinematics are unable to cope with these added challenges. In this paper, we show that high accuracy positioning can nevertheless be achieved with inexpensive hardware. In our work we do not assume that the appearance of the robotic arm is known in advance, which means that the system simultaneously needs to learn what constitutes the robotic arm, how to recognize the end-effector and how to control it. We have included a heuristic detection and recognition algorithm in Appendix A to be able to present a complete method. Learning detection and recognition is achieved by an action precedes perception approach [11] where we are using a simulated palmar grasp reflex [23]. To be able to control the robotic arm we use visual servoing based on learning a mapping between feature space and control space. We show both in simulations and in real world experiments that we can achieve high accuracy. A Lynx-6 low cost robotic arm, see Fig. 1, has been used for the real world experiments. 1
Figure 1: The Lynx-6 low-cost robotic arm used in real world evaluation. The paper is organized as follows: • Section 2 gives a brief overview of related work on recognition, learning robot control and visual servoing. • Section 3 deals with learning the control of the low-cost robotic-arm. In earlier work we have shown that by using visual servoing based on Locally Weighted Projection Regression (LWPR) [29] we can achieve high precision positioning [18]. The positioning was accurate up to the noise in the detection of position. In this paper we have replaced the position based visual servoing used in [18] with imaged based visual servoing. • In Section 4 we present real world experiments which show that we can achieve accuracy that is sufficient for simple assembling tasks by combining automatic recognition and visual servoing based on LWPR. For the real world experiments a 5 DOF robotic arm of Lynx-6 type [2] has been used. • Section 5 contains a discussion which reflects advantages and drawbacks of the proposed method. • Appendix A presents our method for detecting and recognizing the gripper1 which has been used in the experiments. 1 In
this paper we use the term end-effector synonymously with the term gripper
2
2
Related Work
In this paper we address the problem of controlling a robotic arm by visual servoing without knowing in advance what the robotic arm looks like. The different aspects of this problem, i.e. uncalibrated visual servoing and generic visual recognition, have been considered separately in the literature. However, we are not aware of any paper that performs visual servoing without actually knowing what the robotic arm looks like. The approaches by Ognibene et al. [20] and Butz et al. [5] are similar to ours in that way that they use motor babbling, i.e. spontaneous random movements, to learn how to associate the limbs’ final position with motor commands. Ognibene et al. use pre-training of the actuator by motor babbling. However, in their experiments they use a simulator and do not have to deal with the problem of learning how to recognize the hand, i.e. they are in fact fully aware of what the robotic arm looks like. Butz et al. are using a hierarchical neural network structure to learn the inverse kinematics and how to resolve redundancies. They do however not deal with the problem of learning how to acquire the information regarding the end-effector configuration. Toussaint and Goerick [26] present an alternative approach to the control problem. They are using dynamic bayesian networks to infer and emit control signals, contrary to the more traditional use of modeling observed data. By this approach they attack the problem of motor planning. They do not address the issue of learning how to acquire information of the robots configuration. J¨ agersand and Nelson [13] are performing combined visual model acquisition and agent control. They do not explain in detail how they analyze the visual scene, but they mention a template matching tracker that tracks surface markers as well as a special purpose tracker which tracks attached targets or small lights. From their cited technical report [12], it is clear that they are tracking predefined features, such as attached light bulbs or markers. Visual servoing based on an estimated inverse image Jacobian is a well established technique, but most reported experiments are using prior knowledge about the appearance of the robotic arm, e.g. markers, or just computer simulations. Siebel and Kassahun [24] and Buessler and Urban [4] are using neural networks for learning visual servoing. Siebel and Kassahun are reporting real world experiments where they use a robotic arm fitted with circular markers while Buessler and Urban do not present how they obtain the description of the end-effector. Farahmand et al. [7] propose two methods for globally estimating the visualmotor Jacobian. Their first method uses a k-nearest neighbor regressor on previously estimated local models to estimate the Jacobian for a previously unseen point. If the estimated Jacobian differs more than a certain threshold from Jacobians that are already in a database, it is added to the database. The second method is based on a local least squares method. They opt to keep the history of all robot movements and to estimate the Jacobian from this data when it is needed. For experiments, they use MATLAB simulations where the features tracked are the projection of the end-effector position. 3
3
Learning to Control a Robotic Arm
Since we do not assume that the appearance of the robotic arm is known beforehand the first thing we need to do is to learn how to recognize the end-effector. Once this is achieved we can focus on learning how to control the robotic arm. We discuss the general prerequisites needed for a recognition algorithm in Section 3.1 and we have included a heuristic recognition method in Appendix A that fulfills these requirements. In Section 3.2 we describe how we can learn a mapping from feature space to control space. How this mapping can be used for visual servoing is discussed in Section 3.3. In Section 4.3 we show in real world experiments that we can achieve good accuracy by combining the autonomous recognition and learning of control.
3.1
Requirements for Recognition of an End-Effector with Unknown Appearance
In this section we discuss the requirements we need to impose on a method that autonomously detects and recognizes the end-effector. What we need is an algorithm, that given an image of the robotic arm, returns a vector that describes the configuration. Ideally we would get the image coordinates of sufficiently many interest points, e.g. the position of each joint and tip of the end-effector, to be able to uniquely determine the configuration. If we were to choose manually, the intuitive thing to do would be to choose a number of physical features, e.g. the tip of the end-effector, that we track through subsequent frames. Since we do not manually choose which physical features to track, we might end up using interest points that are counterintuitive - in the sense that it is hard for a human operator to specify how to position these points in order to be able to manipulate an object. This makes it impossible to hard-code how to grip objects. For a learning system this is of no concern, since the system will learn how to position these partly arbitrary points in order to manipulate objects. We are only concerned with obtaining a consistent estimate of the configuration. By consistent we mean that whenever the robotic-arm is in a given configuration, say c1 , we should end up with the same description of this configuration. Assume for the moment that the description of the configuration consist of a single interest point, p, that in configuration c1 corresponds to the physical feature f 1 . It is fully acceptable if we in another configuration c2 match our tracked point to another physical feature f 2 . What we do require, is that every time we are in c1 we match p with f 1 and every time we are in c2 we match p with f 2 . In Appendix A we have included a heuristic recognizing method, in order to be able to evaluate a self contained method that simultaneously learns the appearance and the control of a robotic arm. This method is used to recognize the end-effector of a robotic arm without specifying its shape, size, color or texture. The only assumptions we make are that the end-effector is an articulated object and that we know the motor command that controls the opening and closing of the end-effector. These assumptions are used for generating training 4
data that we will use for learning recognition. The method described in the appendix is based on template matching [3, 27]. Instead of template matching we could use other features, e.g. SIFT-features [19] or channel coded feature maps [14]. In that case, the extraction of template patches, Section A.2, should be replaced by extraction of the chosen feature. However the restriction to features within the segmented regions of interest should be kept.
3.2
Locally Weighted Projection Regression
We give a brief introduction of LWPR and introduce the minimum of details needed in order to be able to explain our visual servoing approach. For a detailed description we refer the interested reader to [29]. LWPR is an incremental local learning algorithm for nonlinear function approximation in high dimensional spaces and has successfully been used in learning robot control [29, 28, 22]. The key concept in LWPR is to approximate the underlying function by local linear models. The LWPR model automatically updates the number of receptive fields (RFs), i.e. local models, as well as the location (which is represented by the RF center c) of each RF. The size and shape of the region of validity (decided by the distance metric D) of each RF is updated continuously based on the performance of each model. Within each local model an incremental version of weighted partial least-squares (PLS) regression is used. LWPR uses a non-normalized Gaussian weighting kernel to calculate the activation or weight of RFk (the subscript k will be used to denote that the particular variable or parameter belongs to RFk ) given query x according to wk = exp(−
(ck − x)T Dk (ck − x) ). 2
(1)
Note that (1) can be seen as a non-regular channel representation of Gaussian type if the distance metric Dk is equal for all k [9]. The output of RFk can be written as a linear mapping ˆ k = Ak x + β k,0 y
(2)
where Ak and β k,0 are known parameters acquired through the incremental PLS. The incremental PLS bears a resemblance to incremental associative networks [15], one difference being the use of subspace projections in PLS. ˆ of the LWPR model is then given as the weighted The predicted output y output of all RFs according to PK ˆk k=1 wk y ˆ= P y K w k=1 k with K being the total number of RFs.
5
(3)
We have been using LWPR to learn the mapping between the configuration x of the end-effector and the control signals y. All training data was acquired through image processing since no joint-feedback was available from the robotic arm that has been used. To improve accuracy we have combined the moderately trained LWPR model with visual servoing. That is, we perform the first move of the robotic arm by querying the LWPR model for the appropriate control signal. Then we estimate the deviation from the target configuration and correct the control signal by using visual servoing.
3.3
Visual Servoing Based on LWPR
We use visual servoing [6, 17] to minimize the quadratic norm of the deviation vector ∆x = xw − x, where x denotes the reached configuration and xw denotes the desired configuration of the end-effector. The optimizing criteria can thus be written as 2
min k∆xk .
(4)
If the current position with deviation ∆xi originates from the control signal yi , the new control signal is, in accordance to Newton methods, given as yi+1 = yi − J∆xi
(5)
where the Jacobian J is the linear mapping that maps changes ∆x in configuration space to changes ∆y in control signal space2 . When the Jacobian has been estimated the task of correcting for an erroneous control signal is in theory straightforward. The process of estimating J and updating the control signal is performed in a closed loop until some stopping criterion, e.g. small enough deviation from the target position, has been fulfilled. The entire control scheme is illustrated in Fig. 3.3. In our case, we get the first control signal from the trained LWPR model and he visual servoing loop is activated after the first move. Using LWPR as a basis for visual servoing is straightforward for the first iteration. The trained LWPR model gives a number of local linear models from which the Jacobian can be estimated. According to (2) each y ˆk can be written as y ˆk = Ak (x − xk,c ) + β k,0
(6)
leading to 1
wk y ˆk = e− 2 (x−ck ) The derivatives
dwk dx
and
d(wk y ˆk ) dx
dwk dx
T
Dk (x−ck )
(Ak (x − xk,c ) + β k,0 ).
(7)
are
= −(x − ck )T Dk wk
(8)
2 J is sometimes denoted the inverse image Jacobian or visual-motor Jacobian. We will simply use the term Jacobian in this paper.
6
y Camera
‐ Δy J
x
J(x,y)
‐
Δ Δx
Image processing
x
xw
Figure 2: Illustration of the closed loop control scheme. The box denoted J(x, y) corresponds to algorithm 1. We use the notation x for estimated configuration, xw for target configuration and y for the control signal.
7
d(wk y ˆk ) = −ˆ yk (x − ck )T Dk wk + wk Ak . (9) dx PK PK By setting g = k=1 wk y ˆk and h = k=1 wk , see (3), and by using the y quotient rule, dˆ dx can be written as � � � � dˆ y 1 dg d �g� dh 1 dg dh ˆ = 2 = h−g = −y (10) dx dx h h dx dx h dx dx giving dˆ y = dx
PK
yk (x k=1 (−ˆ
− ck )T Dk wk + wk Ak ) − y ˆ h
PK
k=1 (−(x
− ck )T Dk wk ) (11)
ultimately leading to the expression dˆ y J(x, y ˆ) = = dx
PK
k=1
wk (Ak + (ˆ y−y ˆk )(x − ck )T Dk ) . PK k=1 wk
(12)
Once we have an estimate of J we use (5) to obtain the corrected control signal yi+1 . We use this control signal to move the robotic arm and estimate the new deviation from the target. If none of our stopping criteria have been met we need to reestimate the Jacobian and apply (5) to obtain the new estimate yi+2 . In order to estimate the new Jacobian according to (12) we need b when used as input to the configuration x that results in the control signal y LWRP. But we only know this relationship for the first visual servoing iteration since, for subsequent iterations, our control signal was obtained by (5) and not as the result of an input to the LWPR model. We propose a static and an approximative updating approach to solve this problem. Static approach: The simplest solution is the static approach. The Jacobian is simply not updated and the Jacobian used in the first step is (still) used in the following steps. It should be noted that this approach can be expected to work only if the first estimation of the Jacobian points in the right direction. Still this approach works fairly well (see Section 4). However, for a poorly trained LWPR model one can expect the static approach to be less successful. Approximative updating approach: The somewhat more complex solution treats the LWPR model as if it was exact. This means that we use the reached position as query and estimate the Jacobian for this configuration. The pseudo-code is given in Algorithm 1. The wanted configuration is denoted xw and y = LWPR(x) means the output from the trained LWPR model given query x. A threshold � is used to terminate the visual servoing loop if the deviation is small enough. The procedure is also explained in Fig. 3.
8
Y
Y
J1
y1
y1
X
x1
X
xw
x1
∆x1
xw ∆x1
A : Given the wanted configuration xw we obtain the first prediction y1 . Which results in deviation ∆x1 .
B : The true Jacobian J1 is estimated.
Y
Y
J1
y1 – J1∆x1 = y2 y1
y2
X
x1
X
xw
x2
∆x1
xw ∆x2
C : The prediction is updated, giving y2 .
D : y2 results in x2 with deviation ∆x2 .
Y
Y
J2
y2 – ~ J2∆x2 2 = yy3 3 y2
y2
~ J2
X
x2
X
xw x?
x2
∆x2
xw ∆x2
E : The true Jacobian J2 cannot be estimated due to the unknown x? .
F : The approximative Jacobian e2 is estimated and used to update J the control signal.
Figure 3: The approximative updating approach explained. The green line to the left in each figure represents the true function and the dotted black line to the right the LWPR approximation.
9
Algorithm 1 Approximative Updating of the Jacobian 1: y1 = LWPR(xw ) 2: Estimate the reached configuration x1 3: y2 ← y1 − J(xw , y1 )(xw − x1 ) 4: for k = 2 to the maximum number of iterations do 5: Estimate the reached configuration xk 2 6: if kxw − xk k > � 7: yk+1 ← yk − J(xk , LW P R(xk ))(xw − xk ) 8: else 9: done 10: end if 11: end for
4
Results
This section is divided into three parts. First, in Section 4.1 we make a comparison between LWPR and position based visual servoing on simulated data. We assume that the appearance of the end-effector is known in advance and we use 3D coordinates. In this case the accuracy of our visual servoing approach is limited by noise in the estimated position. In Section 4.2 we confirm that these results are valid on real world data by showing that the accuracy (once again) is limited by the noise level also in this case. In the last experiment, Section 4.3, we present results from image based servoing in combination with the autonomous recognition of the end-effector, as described in Appendix A. We show that we can achieve sufficient accuracy for basic assembly tasks. For all tests we use the reduced 3D task space, denoted 2D+, defined in the COSPAL project [1]. 2D+ refers to the fact that the end-effector can be positioned in two different planes only, the grip- and the movement-plane, see Fig. 4. The approach vector of the end-effector is restricted to be perpendicular to the ground plane. In our evaluations the task space is further restricted to a half circle (position based evaluation) or to a quarter circle (image based evaluation). We are controlling all 5 DOF of the robotic arm but use only the position of the end-effector to describe the configuration, i.e. for the position based setup we use the 3D position between the fingers of the end-effector. The smoothness bias for LWPR is set to 10−5 , the initial learning rate to 50 and the default distance metric to 30I + 0.05, where I denotes the identity matrix. All 3D positions were measured in mm and the image coordinates are given in pixels. The same LWPR parameters are used for all experiments.
4.1
Position Based Visual Servoing (Simulator Results)
We implemented a simulator of an ideal version of the same robotic arm that we use for real world experiments, i.e. we assume perfect servos and perfect inverse kinematics. We generated training data by randomly positioning the robot arm in the 2D+ planes. We performed 100 test with 100 testing configurations in 10
Figure 4: Illustration of the 2D+ scenario. The end-effector, here equipped by green and red markers, can be moved in two different planes, the movement and the gripper plane.
11
each test. The configurations used for evaluation were not used during training. Tables 1 and 2 contain the maximum likelihood estimates of the mean absolute error from the target position and corresponding standard deviation from simulations with and without added Gaussian noise. LWPR denotes that the trained model was used in a one-shot fashion while I-LWPR denotes that the model has been updated incrementally. This means that for each position 100 attempts to reach the target were made. The position after each attempt was used to update the LWPR model and the final position after the 100th attempt was used. J indicates that the Jacobian of the LWPR model has been used for visual servoing and Static/Update denotes whether the static or the updating approach has been used. The stopping criteria for the visual servoing was set to 20 iterations or a deviation of less than 0.1 mm from the desired position. 2D+ simulated data. Added noise std: Training points: 500 1000 LWPR 8.90 (4.81) 7.53 (4.01) I-LWPR 5.90 (4.29) 5.56 (3.78) J Static 0.34 (1.20) 0.17 (0.52) J Update 0.29 (0.90) 0.15 (0.40)
0 [mm] 5000 6.46 (3.44) 5.73 (3.40) 0.11 (0.23) 0.09 (0.15)
Table 1: Evaluation on simulated 2D+ scenario when trained on 500, 1000 and 5000 samples. The numbers are the ML estimates of the mean absolute error from the target position and corresponding standard deviation in mm. 100 test runts with 100 test points were used. No noise has been used.
The standard deviation of the added Gaussian noise was set to 2.6 mm in order to match the estimated real world noise level. 2D+ simulated data. Added noise std: 2.6 [mm] Training points: 500 1000 5000 LWPR 10.10 (4.99) 8.81 (4.27) 7.78 (5.11) I-LWPR 6.08 (4.40) 5.67 (3.85) 5.70 (4.82) J Static 2.10 (1.31) 1.90 (0.96) 1.80 (1.08) J Update 2.00 (1.06) 1.90 (0.85) 1.90 (1.04) Table 2: Evaluation on simulated 2D+ scenario when trained on 500, 1000 and 5000 samples. The numbers are the ML estimates of the mean absolute error from the target position and corresponding standard deviation in mm. 100 test runts with 100 test points were used. Gaussian noise with standard deviation of 2.6 mm was added to the positions in order to simulate the noise in the estimation process.
12
4.2
Position Based Servoing (Real World Results)
The real world experimental setup consists of a low cost robotic arm of Lynx-6 type, shown in Fig. 1, and a calibrated stereo rig. The end-effector has been equipped with spherical markers to allow accurate estimation of the configuration. Since we are using a low-cost robotic arm we have to deal with additional challenges compared to a top-of-the-line robotic arm with challenges such as weak servos, no joint-feedback and hysteresis. The weak servos are not fully able to compensate for the effect of gravity, meaning that we have a highly nonlinear system. Lack of joint-feedback means that all information of the configuration of the system has to be acquired by external sensors, in our case cameras, and that we can not use joint-feedback to compensate for the weak servos or hysteresis. The hysteresis effect is highly cumbersome, especially for control policies based on the inverse kinematics only, since the same control input will result in different configuration depending on what the previous configuration was. The noise in estimated positions due to e.g. the robotic arm shaking, noise in captured images and imperfect segmentation of markers, is assumed to be Gaussian with zero mean. The standard deviation is estimated to 2.6 mm and this is also the standard deviation used in the simulations. The analytical model has been evaluated and verified to be correct on synthetic data and the real world performance has been evaluated on 100 random positions in the 2D+ space. The analytical model was used in a one-shot fashion, i.e. no visual servoing are used. The estimated mean error was 15.87 mm. However, we suspect that a slightly better result could be achieved by tedious calibrating of the parameters of the analytical model. Still, the nonlinear effect caused by the weak servos and the hysteresis effect makes it very unlikely that we could achieve a mean error less than 10 mm with the analytical model. The analytical model relies on an accurate calibration of the stereo rig and on a correct mapping from camera frame to robot frame. The learned inverse kinematics on the other hand, has been trained with data that has been acquired including these imperfections. A summary of the result can be seen in table 3. LWPR denotes the mean absolute error from the target position when the trained model was used in a one-shot fashion. J indicates that the Jacobian of the LWPR model has been used for visual servoing and Static/Update denotes whether the static or the updating approach has been used. The stopping criteria for the visual servoing was set to 10 iterations or deviation of less than 1 mm from the desired position.
4.3
Image Based Visual Servoing with Autonomous Recognition
The second real world experimental setup consists of the same low cost robotic arm that was used in the position based experiments. The spherical markers have been removed from the gripper and the high resolution cameras have been replaced with two cheap web cameras. We do not use a calibrated stereo setup
13
2D+ Real World. Estimated noise std: 2.6 [mm] Training points: 100 500 5000 LWPR 16.89 (8.30) 12.83 (4.86) 8.78 (4.44) J Static 9.83 (8.93) 5.41 (5.23) 1.74 (1.63) J Update 9.07 (8.29) 4.32 (4.21) 1.65 (1.43) Analytical solution: 15.87 (3.24)
10 000 3 5.86 (3.05) -
Table 3: Evaluation on real-world 2D+ scenario. The numbers are the mean absolute error from the target position and corresponding standard deviation in mm. 50 test points were used for evaluation except from in the 10k case and in the analytical case were 100 test positions have been used. Stopping criteria for the visual servoing was 10 iterations or a deviation less than 1 mm. No evaluation of the visual servoing methods was done for the 10k case. The level of accuracy reached for 1k and 5k is as accurate as the noise level permits.
for this experiment. The view from the two web cameras can be seen in Fig. 5.
Cam 1
Cam 2
100
100
200
200
300
300
400
400 100
200
300
400
500
600
100
200
300
400
500
600
Figure 5: The view seen from the two web cameras during the image based evaluation The automatic detection and recognition algorithm is fully described in Appendix A. In short, the initialization phase automatically detects and labels region of interests, ROIs, by using a simulated palmar grasp reflex, see Fig. 6. From each ROI, we extract a number of template patches which are labeled according to the ROI they were extracted from. In each new frame the position of the best match for each template patch is found. Then the median position of all template patches belonging to the same label is estimated. These coordinates are then used to describe the configuration of the end-effector; which gives us a total of R coordinates for each image, with R being the number of 3 The LWPR model was trained on a total of 6k unique points. The first 1000 points were shown (in random order) 5 times and then the additional 5k points were used.
14
labels. Open Gripper
Segmented ROIs
100
100
200
200
300
300
400
400 100
200
300
400
500
600
1
100
200
300
2
400
500
600
Figure 6: Left: The image of the opened gripper. Right: After the simulated palmar grasp reflex we get labeled regions of interests. In the evaluation presented below R = 2, meaning that templates were extracted from two regions, which allow oriented positioning in the 2D+ scenario. To present an intuitive error measure, and also in order to be able to compare to the position based experiments, we use the coordinate halfway between the median positions of the two labels as our final position. This gives us one coordinate in each image that describes the configuration of the robotic arm. The size of the templates was 15x15 pixels and we used 20 patches for each label. The template-size was kept fixed and was not adjusted to compensate for scale changes. Since we are using two different cameras and the templates are automatically selected, we might end up using different physical features in the different cameras, i.e. one camera might use templates at the tip of the end-effector while the other camera might use templates belonging to the base. This complicates things when we evaluate the performance. We cannot simply select a 3D position in space and project this position into the two image planes and use these coordinates as a target configuration. This could result in trying to position the tip and the base of the end-effector at the same position, which is obviously not doable. Instead we have used a configuration already visited, but omitted during the training phase, as a target configuration. Training data was obtained by random movements within (near) the 2D+ planes using the analytical model. Given a target configuration, the trained LWPR model was queried in order to obtain the first control signal. This signal was used and the deviation from the target was estimated. The visual servoing approach was then used with the end position obtained with LWPR as the starting position for servoing. Typical trajectories for the visual servoing can be seen in Fig. 7. Note in the second row how the minimization of the combined deviation makes the deviation in the right camera increase. able 4 contains the results from the second series of real world experiments. 15
Cam 1
Cam 2
210
190
212
192
214
194
216
196
218
198
202
224
204
226
206
228
208
357
359
361
363
365
367
369
371
373
210 295
375
10
0
4 3
2 8 9
297
299
301
303
305
Cam 1
307
309
311
313
315
246
248
Cam 2
220
194
222
196
224
198
226
200
5 6
4
5
4 228
10 9 8
202
6
7
3
10
3
230
6 5 7
200
3 4 5 2 6 7 10 9 8
222
230 355
1
0
1
220
7
8
9
204
232
206
234
208
2
2
1
236
210
0
238
0
212
1 240 410
412
414
416
418
420
422
424
426
428
214 228
430
230
232
234
236
238
240
242
244
Figure 7: The position after each visual servoing iteration. The red circle indicates the target position and the green cross, at the 0th position, indicated the position reached by the LWPR model. The left/right column corresponds to the left/right camera and each row corresponds to one target configuration.
16
LWPR denotes the mean absolute error from the target position and corresponding standard deviation, within parenthesis, for the trained LWPR model. J Update denotes that the updating approach has been used for visual servoing. A distance of 1 pixel corresponds to roughly 0.5 mm within the reaching area of the robotic arm (both along the x-axis and along the y-axis) in both cameras.
Training points: 250 250 500 500 1000 1000
Real world evaluation Camera LWPR J Update 1 2 1 2 1 2
6.64 7.27 8.99 8.74 8.37 6.51
(4.31) (4.92) (5.57) (5.39) (3.18) (3.61)
3.08 (2.62) 2.71 (2.40) 4.12 (3.14) 4.06 (3.07) 4.68 (2.26) 3.80 (2.17)
Table 4: Real world evaluation of the image-based visual servoing. Mean absolute error from target position and corresponding standard deviation are given in pixels. A pixel corresponds to roughly 0.5 mm within the task space. A total of 250 test points were used for each evaluation. The obtained errors are, as expected, higher than those when using markers to describe the configuration. Still, we do achieve sufficient accuracy for simple object manipulating tasks. It is interesting to note that the highest accuracy was obtained for the model trained by only 250 training configurations. This is explained by the fact that we continuously replace patches with poor performance in order to compensate for e.g. light changes. We can expect to replace more patches when collecting more training data, thus the risk of getting conflicting information becomes higher. We address this issue in the discussion.
5
Discussion
We have presented a method that allows simultaneous learning of appearance and control of a robotic arm. Sufficient accuracy for simple assembly tasks is reached by combining autonomous recognition with visual servoing based on Locally Weighted Projection Regression (LWPR). We have seen that by using powerful algorithms we can suffice with inexpensive hardware, such as web cameras and low-cost robotic arms. In Section 4.2 we show that the accuracy is limited mainly by noise in the estimated positions when the appearance of the end-effector is known and we use 3D coordinates. In Section 4.3 we show that these conclusions can also be drawn for image based visual servoing with an end-effector that is unknown in advance. The restrictions imposed by the 2D+ test scenario avoid problems with multiple valued solutions to the inverse kinematic problem. If the training samples 17
form a non-convex set, our linear technique basically fails. This potentially happens for robotic systems with redundant degrees of freedom. For instance, if all positions would be reachable with servo 1 set to either +π or −π, the linear averaging of the LWPR method predicts the output to 0 for servo 1. Presumably this can be avoided with a non-linear representation of the signals, e.g. using the channel representation [10] which allows for multi-modal estimation [8]. Due to the restrictions of our test scenarios we have not encountered any problem with singularities in control space. However, for the same reasons as data with ambiguities would be a problem for LWPR, existing singularities would cause problems. From a theoretical point of view, the same solution based on channel representation could solve this problem. In a real world setup this needs to be verified. Due to noise, unstable configurations might occur that could be dealt with by a finite state machine as a higher level controller. This is something that should be investigated in future work. Future work will also include replacing our heuristic recognition algorithm with a theoretically more profound one. We need to decrease the noise in the estimated configurations in order to increase our real world performance. We have tried to use a KLT-tracker where the initial tracking features were initialized by the same method that we use for extracting our patches. However, this did not turn out better than the described template matching method. Also, since we do not have any available joint-feedback, it is hard to justify the extra computational burden required by the KLT-tracker, because we cannot use the intermediate positions as training data. Only the final position of a movement can be used for training since it is only for this position we have the corresponding control signals.
6
Acknowledgments
The research leading to these results has received funding from the European Community’s Seventh Framework Programme (FP7/2007-2013) under grant agreement n◦ 215078 DIPLECS and from the European Community’s Sixth Framework Programme (FP6/2003-2007) under grant agreement n◦ 004176 COSPAL.
References [1] The COSPAL project. http://www.cospal.org/. [2] Lynxmotion robot kits. http://www.lynxmotion.com/. [3] D.H. Ballard and C.M. Brown. Computer Vision. Prentice Hall Professional Technical Reference, 1982. [4] Jean-Luc Buessler and Jean-Philippe Urban. Visually guided movements:
18
learning with modular neural maps in robotics. Neural Networks, 11(78):1395–1415, 1998. [5] M. V. Butz, O. Herbort, and J. Hoffman. Exploiting redundancy for flexible behavior: Unsupervised learning in a modular sensorimotor control architecture. Psychological Review, 114(4):1015–1046, 2007. [6] P. I. Corke. Visual Control of Robots: High-Performance Visual Servoing. John Wiley & Sons, Inc., New York, NY, USA, 1997. [7] A. Farahmand, A. Shademan, and M. Jgersand. Global Visual-Motor Estimation for Uncalibrated Visual Servoing. In Proc. of the International Conference on Intelligent Robots and Systems (IROS), pages 1969–1974, 2007. [8] M. Felsberg, P.-E. Forss´en, and H. Scharr. Channel smoothing: Efficient robust smoothing of low-level signal features. IEEE Transactions on Pattern Analysis and Machine, 28(2):209–222, February 2006. [9] P-E. Forss´en. Low and Medium Level Vision using Channel Representations. PhD thesis, Link¨oping University, Sweden, SE-581 83 Link¨oping, Sweden, March 2004. Dissertation No. 858, ISBN 91-7373-876-X. [10] G.H. Granlund. An associative perception-action structure using a localized space variant information representation. In Proceedings of Algebraic Frames for the Perception-Action Cycle (AFPAC), Kiel, Germany, September 2000. [11] G.H. Granlund. Organization of architectures for cognitive vision systems. In H.I Christensen and H.H. Nagel, editors, Cognitive Vision Systems: Sampling the spectrum of approaches, pages 37–55. Springer-Verlag, Berlin Heidelberg, Germany, 2006. [12] M. J¨ agersand and R.C. Nelson. Adaptive Differential Visual Feedback for Uncalibrated Hand-Eye Coordination and Motor Control. Technical Report 579, Comp. Sci. Dept. University of Rochester, Rochester NY, 1994. [13] M. J¨ agersand and R.C. Nelson. On-Line Estimation of Visual-Motor Models Using Active Vision. In Proc. of ARPA96, pages 677–682, 1996. [14] E. Jonsson and M. Felsberg. Accurate interpolation in appearance-based pose estimation. In Proc. 15th Scandinavian Conference on Image Analysis, volume 4522 of LNCS, pages 1–10, 2007. [15] E. Jonsson, M. Felsberg, and G.H. Granlund. Incremental associative learning. Technical Report LiTH-ISY-R-2691, Dept. EE, Link¨oping University, Sept 2005. [16] V. Kolmogorov and R. Zabih. What energy functions can be minimized via graph cuts? IEEE Trans. Pattern Analysis and Machine Intelligence, 26(2):147–159, 2004. 19
[17] D. Kragic and H. I. Christensen. Survey on visual servoing for manipulation. Technical report, ISRN KTH/NA/P–02/01–SE, Jan. 2002., CVAP259, 2002. [18] F. Larsson, E. Jonsson, and M. Felsberg. Visual servoing for floppy robots using LWPR. In Proceedings of the International Workshop on Robotics and Mathematics, 2007. [19] D. G. Lowe. Object recognition from local scale-invariant features. In Proc. of the International Conference on Computer Vision, pages 1150– 1157, 1999. [20] D. Ognibene, A. Rega, and G. Baldassarre. A model of reaching that integrates reinforcement learning and population encoding of postures. In SAB, pages 381–393, 2006. [21] C. Ridder, O. Munkelt, and H. Kirchner. Adaptive background estimation and foreground detection using Kalman filtering. In Proc. of ICAM, 1995. [22] S. Schaal, C.G. Atkeson, and S. Vijayakumar. Scalable techniques from nonparametric statistics for real time robot learning. Applied Intelligence, 17(1):49–60, 2002. [23] J.M. Schott and M.N Rossor. The grasp and other primitive reflexes. Journal of Neurology Neurosurgery and Psychiatry, 74:558–560, 2003. [24] Nils T. Siebel and Yohannes Kassahun. Learning neural networks for visual servoing using evolutionary methods. In HIS ’06: Proceedings of the Sixth International Conference on Hybrid Intelligent Systems, page 6, Washington, DC, USA, 2006. IEEE Computer Society. [25] C. Stauffer and W.E.L Grimson. Adaptive background mixture models for real-time tracking. In Proc. of IEEE International Conference on Computer Vision and Pattern Recognition, 1999. [26] M. Toussaint and C. Goerick. Probabilistic inference for structured planning in robotics. International Conference on Intelligent Robots and Systems (IROS), pages 3068–3073, 2007. [27] D. Vernon. Machine vision: automated visual inspection and robot vision. Prentice-Hall, Inc., 1991. [28] S. Vijayakumar, A. D’souza, T. Shibata, J. Conradt, and S. Schaal. Statistical learning for humanoid robots. Auton. Robots, 12(1):55–69, 2002. [29] S. Vijayakumar and S. Schaal. Locally weighted projection regression: An O(n) algorithm for incremental real time learning in high dimensional spaces. In Proceedings ICML, pages 288–293, 2000.
20
A
Recognition of an End-Effector with Unknown Appearance
In this appendix we present a method to recognize the end-effector of a robotic arm without specifying its shape, size, color or texture. The only two assumptions we make is that the end-effector is an articulated object and that we know which state that controls opening and closing. These assumptions are used to determine the template patches that we use for recognition.
A.1
Detecting Regions of Interest
The template patches are extracted in two steps. First we detect the regions of interests (ROIs), secondly we extract a large number of patches within these ROIs. These patches are evaluated and the best ones are kept. We begin by estimating a background image Ib in order to detect ROIs. This is done by moving the robotic-arm out of the field of view and then capturing a number of images. Letting the mean value represent the background. This could also be done by e.g. Gaussian Mixture Models [25] or by the use of Kalman-filters [21] in order to obtain a more advanced model. After we have obtained Ib , we move the robotic-arm to a random position and open and close the end-effector. ROIs are found by simultaneous background segmentation and motion segmentation. As a part of the extraction of ROIs we use the sum of absolute differences X SAD(t, q) = |t(i) − q(i)| . (13) i
The pseudo-code for the automatic extraction of ROIs can be found in Algorithm 2. Images captured when the end-effector is open or closed are denoted with Io and Ic respectively. Furthermore, Doc denotes the SAD image between opened image and closed image, and Dob the SAD image between opened image and background image. Before creating the final labeled image we may use morphological operations, graph-cut [16] or impose some restrictions on the ROIs, e.g. only keeping homogeneous regions with area larger than a certain threshold. We use |Ωi | to denote the cardinality of the i : th connected region in Dbin . The image Dlabel R is the final output of the algorithm. Each pixel in Dlabel R has a value between 0 and R, meaning that we defined the ROIs as the pixels where the value is non-zero.
21
Algorithm 2 Labeling of ROIs 1: R ← 0 The number of non-overlapping ROIs 2: for every pixel (x,y) in Io do 3: Dlabel (x, y) ← 0 4: Dbin (x, y) ← 0 5: D0l (x, y) ← 0P 6: Doc (x, y) ← Pi |Io (x, y, i) − Ic (x, y, i)| 7: Dob (x, y) ← i |Io (x, y, i) − Ib (x, y, i)| 8: if Doc (x, y) > T and Dob (x, y) > T then 9: Dbin (x, y) ← 1 10: end if 11: end for 12: Dbin ← morph(opening,Dbin ) 13: Dbin ← morph(dilation,Dbin ) 14: for each connected region Ωi in Dbin do 15: if |Ωi | > Tsize then 16: Dlabel R+1 = Dlabel R + (R + 1)Ωi 17: R=R+1 18: end if 19: end for
Figure 8 to 10 shows the different steps of Algorithm 2. In Figure 8 the original image is shown together with the final ROIs. Figure 9 contains to the thresholded Doc and Dob . Figure 10 shows the final Dlabel . Open Gripper
Segmented ROIs
100
100
200
200
300
300
400
400 100
200
300
400
500
600
1
100
200
300
2
400
500
600
Figure 8: Left: The image of the opened gripper. Right: Final Dlabel R after imposing requirement of minimum size for ROIs. Here R = 2
22
Doc>T
Dob>T
100
100
200
200
300
300
400
400 100
200
300
400
500
600
100
200
300
400
500
600
Figure 9: Left: The thresholded Doc Right: The thresholded Dob .
Dbin=(Doc>T).*(Dob>T)
Dbin after morph
100
100
200
200
300
300
400
400 100
200
300
400
500
600
100
200
300
400
500
600
Figure 10: Left: Dbin after line 8 in Algorithm 2 Right: Dbin after morphological erosion and dilation
23
A.2
Choosing Template Patches
Within each ROI, obtained according to Algorithm 2, we extract N randomly positioned template patches. N typically being in the order of 100. Each tem(r) plate is denoted tn were n indicates the patch number. The superscript r is a label indicating from which of the R ROIs the template has been extracted, e.g. in the example shown in Figure 8 the possible values for r would be 1 or 2 depending on if the template was extracted from the left or the right ROI. To evaluate the quality of these patches we move the robotic-arm to a random position and perform the opening and closing procedure to obtain new ROIs. At each position in the new ROIs we extract a query patch qm of the same size as the original patches. M being the total number of positions in the ROIs. For (r) (r) (r) (r) each of the RN template patches we compute sn , mn , xn and yn according to: (r) s(r) (14) n = min SAD(tn , qm ) m∈M
(r) m(r) n = argmin SAD(tn , qm )
(15)
m∈M
x(r) n = x(qm(r) )
yn(r) = y(qm(r) ).
n
(16)
n
(r)
(r)
The lowest SAD score for tn with respect to all qm is denoted sn and the (r) index to the query patch corresponding to this score is denoted mn . We as(r) (r) (r) (r) sign a position (xn , yn ) to the template patch, where (xn , yn ) is the (x,y) position of qm(r) . Finally we keep K < N templates belonging to each label. n
(r)
The K templates are chosen with respect to sn . The RK chosen templates are used in subsequent frames to detect the end-effector.
A.3
Using the Templates to Recognize the End-Effector
Each time we move the robotic-arm, new ROIs are obtained by background segmentation. Note that we do not perform the opening-closing procedure described above at this stage. One reason is that it is time consuming, but more important, the opening-closing is impossible if the end-effector is already holding an object. The ROIs are extracted based only on the difference against the background image. (r)
For all RK templates kept in memory, we compute sn and the best corre(r) (r) sponding position (xn , yn ) according to (14)-(16). This simple procedure will lead to a number of mismatches but typically we get sufficiently many reliable matches to determine the position of the end-effector in the images. We are countinously evaluating the quality of the matches. We use e.g. the SAD-score and the movement vector. If the cost for a template is too high with 24
respect to the SAD-score it is classified as an outlier. If the movement vector for a template deviates with an angle larger than a threshold from the movement vectors of templates with the same label r, it is also classified as an outlier. We keep the number of templates in each label constant by extracting new templates from the current view every time we remove those classified as outliers. For each template from label r that we remove, we extract a new template patch near the median position of the templates of class r not classified as an outlier. By this procedure we are able to cope with changes in scale and illumination if the changes are not too rapid. The detection result before and after outlier removal can be seen in Figure 11.
Outliers present
Outliers removed
100
100
200
200
300
300
400
400 100
200
300
400
500
600
100
200
300
400
500
600
Figure 11: Left: Before outliers are removed. Right: After outliers have been removed and after new templates have been extracted. .
25