Hindawi Publishing Corporation International Journal of Photoenergy Volume 2012, Article ID 103672, 8 pages doi:10.1155/2012/103672
Research Article Enhancement of Photocatalytic Activity of ZnO/SiO2 by Nanosized Pt for Photocatalytic Degradation of Phenol in Wastewater R. M. Mohamed1, 2 and M. A. Barakat3, 4 1 Chemistry
Department, Faculty of Science, King Abdulaziz University, P.O. Box. 80203, Jeddah 21589, Saudi Arabia Materials and Nanotechnology Division, Advanced Materials Department, Central Metallurgical Research & Development Institute (CMRDI), P.O. Box 87 Helwan, Cairo 11421, Egypt 3 Department of Environmental Sciences, Faculty of Meteorology, Environment, and Arid Land Agriculture, King Abdulaziz University, Jeddah 21589, Saudi Arabia 4 Minerals Technology Department, Central Metallurgical Research & Development Institute (CMRDI), Cairo 11421, Egypt 2 Nanostructured
Correspondence should be addressed to M. A. Barakat,
[email protected] Received 20 March 2012; Revised 24 May 2012; Accepted 2 June 2012 Academic Editor: Manickavachagam Muruganandham Copyright © 2012 R. M. Mohamed and M. A. Barakat. This is an open access article distributed under the Creative Commons Attribution License, which permits unrestricted use, distribution, and reproduction in any medium, provided the original work is properly cited. ZnO-SiO2 nanoparticles were synthesized by a sol-gel technique from Zn(NO3 )2 · 6H2 O and tetraethyl orthosilicate (TEOS). The synthesized samples were further modified by nanosized Pt from H2 PtCl6 solution through photoassisted deposition (PAD) and impregnation (Img) routes. The obtained samples were characterized by a series of techniques including X-ray diffraction (XRD), UV-Vis diffuse reflectance spectroscopy, N2 adsorption, extended X-ray absorption fine structure (EXAFS), and transmission electron microscopy (TEM). The photocatalytic activity of the Pt-ZnO/SiO2 was evaluated by photocatalytic degradation of phenol in synthetic wastewater under UV-irradiation. Results obtained revealed that the surface area and the photocatalytic activity of the prepared samples were increased in the order ZnO/SiO2 < PAD: Pt-ZnO/SiO2 < img: Pt-ZnO/SiO2 . The surface area decreased from 480 to 460 and 450 m2 /g, while the efficiency of the phenol degradation increased from 80 to 85 and 100%, with the ZnO/SiO2 , Img: Pt-ZnO-SiO2 , and PAD: Pt-ZnO-SiO2 samples, respectively.
1. Introduction Zinc oxide (ZnO) is an n-type semiconductor with a wide direct bandgap of 3.37 eV. Recently, much effort has been devoted to study ZnO as a promising photocatalyst for photocatalytic degradation of water pollutants, owing to its high activity, low cost, and environmentally friendly feature [1–4]. ZnO microcrystal showed also good photocatalytic activity for dye wastewater treatment [5]. However, a major drawback of ZnO is the large bandgap of 3.37 eV; so, wavelengths below 400 nm are necessary for excitation. Another disadvantage of ZnO is that charge carrier recombination of photogenerated electron/hole pairs occurs within nanoseconds and the photocatalytic activity is low [6–9]. Therefore, it is necessary to improve its visiblelight activities by extending its absorption threshold from the
UV light region to the visible light region and also reduce the recombination of photogenerated electron/hole. Different works were performed recently to improve the activity of ZnO catalyst. Development of core/shell-structured materials on a nanometer scale has been receiving extensive attention [10, 11]. The shell can alter the charge, functionality, and reactivity of surface or improve the stability and dispersive ability of the core material. Furthermore, catalytic, optical, or magnetic functions can be imparted to the core particles by the shell material. In general, the synthesis of core/shell-structured material has the goal of obtaining a new composite material having synergetic or complementary behaviors between the core and shell materials. Many studies on the synthesis of composites such as NiO [12], V2 O5 [13], TiO2 [14], Fe2 O3 [15], Pt [16], and Ag [17, 18] coated with SiO2 shells have been reported. SiO2 is one of the most
2 studied shell candidates due to its relative ease in preparation, good environmental stability, and compatibility with other materials, which motivated us to prepare the core/shellstructured composite of ZnO and SiO2 and expected to achieve novel properties resulting from the synergic interaction of these two chemical components. One of the most promising methods to increase the photocatalytic efficiency is surface modification of ZnO, this can be achieved by metal doping into the ZnO catalyst. Dopant can act as a sink to collect photogenerated electrons from the conduction band of the semiconductor. Thus, it hinders the recombination of photogenerated electrons and holes through increasing the charge separation [19–22]. The surface modification of ZnO nanoparticles by preparing charge-transfer catalysts with mixing multicomponent oxides can enhance the surface chemical and physical properties and be considered as the key for the successful photocatalytic applications of such nanoparticles. Several metal ions such as Fe [23] and Ag [24, 25] have been used as dopants for ZnO to improve its photocatalytic activity. Photocatalytic degradation of phenolic compounds with semiconducting oxides holds promise for the purification and treatment of both drinking and industrial wastewater [26–28]. The presence of such organic pollutants in aquatic environments has caused several environmental pollution problems. In the present work, Pt/ZnO-SiO2 nanoparticles with large specific surface areas had been synthesized by the application of a photoassisted deposition (PAD) and impregnation (Img) methods, and the properties of the nanoparticles were characterized by XRD, TEM, EXAFS, UV-Vis/DRS, and BET analysis. The photocatalytic activity of the synthesized nanoparticles was evaluated by the photodegradation of phenol (as a model for pollutants in wastewater) under UV irradiation.
2. Experimental Methods 2.1. Chemicals. Zn(NO3 )2 ·6H2 O, H2 PtCl6 , and tetraethyl orthosilicate (TEOS) were purchased from Aldrich and selected as the precursors of zinc, platinum, and silica, respectively. Standard grade phenol was purchased from Merck with 99.5% purity. 1 M NaOH and 1 M HCl solutions were used for pH adjustment. All chemicals used in this work were of reagent-grade quality. The water used was deionized water. 2.2. Preparation of ZnO/SiO2 . ZnO/SiO2 nanoparticles were synthesized via a sol-gel technique and calcination. In a typical procedure, 20 mL TEOS was mixed with ethyl alcohol (C2 H5 OH), ultrapure water (H2 O), and nitric acid (HNO3 ) under vigorous stirring for 1 hr. The overall molar ratio of TEOS : C2 H5 OH : H2 O : HNO3 was 1: 4 : 8 : 0.02. Subsequently, after 60 min, an aqueous solution of Zn(NO3 )2 ·6H2 O was added in to the above solution under vigorous stirring for 60 min. The reaction was performed at room temperature. The prepared samples were aged for 24 h. Finally, the samples were evaporated and dried at 80◦ C, followed by calcination at 550◦ C for 3 h in air.
International Journal of Photoenergy 2.3. Preparation of Pt Loaded on ZnO/SiO2 Using PAD Method. Pt metal (3 wt%) was deposited on ZnO-SiO2 from aqueous solution of H2 PtCl6 under UV-light irradiation. The samples were dried at 100◦ C and reduced by H2 (20 mL/min) at 350◦ C for 4 h. 2.4. Preparation of Pt Loaded on ZnO/SiO2 Using Img Method. In a typical impregnation (Img) method, the 3 wt% of Pt metal was deposited by a simple impregnation of ZnO-SiO2 in the absence of light with aqueous solution of H2 PtCl6 . The samples were dried at 100◦ C and reduced by H2 (20 mL/min) at 350◦ C for 4 h. 2.5. Characterization Techniques. To determine the crystallite sizes and identities of the Pt loaded on ZnO/SiO2 nanocomposite photocatalyst, X-ray diffraction (XRD) analysis was carried out at room temperature using Rigaku X-ray diffractometer with Cu Kα radiation over a 2θ collection range of 10–80◦ . The shape of the samples was tested using Hitachi H9500 transmission electron microscope (TEM), the prepared samples were prepared by suspending the prepared samples in ethanol, followed by ultrasonication for 30 min, then a small amount of this solution onto a carbon-coated copper grid and drying for TEM. Specific surface area was calculated from measurements of N2 -adsorption using Nova 2000 series chromatech apparatus at 77 K. Prior to the measurements, all samples were treated under vacuum at 200◦ C for 2 h. The band gap of the samples was identified by UV-visible diffuse reflectance spectra (UV-Vis-DRS) in air at room temperature in the wavelength range of 200–800 nm using Shimadzu UV2450 spectrophotometer. The extended X-ray absorption fine structure (EXAFS) is performed at BL-7C facility [29] of the Photon Factory at the National Laboratory for High Energy Physics, Tsukuba, Tokyo, Japan. A Si (1 1 1) doublecrystal was used to monochromatize the X-rays from the 2.5 GeV electron storage ring. The K-edge EXAFS spectra of Fe were measured in the fluorescence mode at 25◦ C. The Fourier transformation was performed on K3 -weighted ˚ EXAFS oscillations in effective range from 0–5 A. 2.6. Photocatalytic Activity Measurements. Photodegradation experiments were performed with a photocatalytic reactor system at 25◦ C. This bench-scale system consisted of a cylindrical Pyrex-glass cell with 1 L. A 150-Watts mercury lamp was placed in a 5 cm diameter quartz tube with one end tightly sealed by a Teflon stopper. The photoreactor was filled with 1 L of 100 mg/L aqueous phenol solution with 1 g/L of each of the three prepared nanoparticles samples. The whole reactor was cooled with a water-cooled jacket on its outside to the temperature. Compressed air was purged into the solution by bubbling compressed air from the bottom to maintain an aerobic condition [30]. Magnetic stirrer was also used to keep the solution chemically uniform. The pH of the solutions was adjusted and kept constant at 7 during the experiments by adding NaOH (1 M) and HCl (1 M) using an Orion Model 801 A pH meter. The experiments were carried out for 60 minutes. The liquid samples were filtered for analysis through 0.2 μm syringe
(100) (002) (101)
International Journal of Photoenergy
3 15
10 FT (a.u.)
Intensity (a.u.)
(102)
(110)
PAD-Pt-ZnO-SiO2
Img-Pt-ZnO-SiO2
(a) 5
(b) ZnO-SiO2
0 0
1
2
3
4
5
6
Distance (A) 10
20
30
40
50
60
Figure 2: Fourier transforms of the Pt LIII -edge EXAFS spectra for Img: Pt-ZnO-SiO2 (a) and PAD: Pt-ZnO-SiO2 (b).
2θ
Figure 1: XRD patterns of the (ZnO-SiO2 , Img: Pt-ZnO-SiO2 and PAD: Pt-ZnO-SiO2 ).
filters. The residual phenol was analyzed by the reaction with 4-aminoantipyrine [31]. Diluted sample of phenol was treated with 2 mL of 4 N NH4 OH, 1 mL of 1.5% 4aminoantipyrine, and 1 mL of 4% K3 [Fe (CN)6 ] and quantitatively diluted to 100 mL with H2 O. After 5 min, the reaction was determined colorimetrically at 510 nm. The photodegradation efficiency of phenol has been calculated applying the following equation: % Photodegradation efficiency =
C0 − C × 100, C0
(1)
where C0 is the initial phenol concentration; C is the retained phenol in solution.
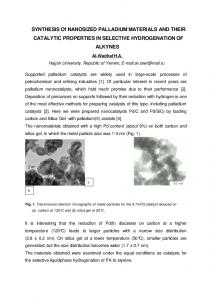
3. Results and Discussions 3.1. Phase Analysis. The XRD patterns of the ZnO-SiO2 and Pt-doped ZnO-SiO2 nanoparticles prepared by (Img) and (PAD) routes are shown in Figure 1. It can be seen that the diffraction patterns of ZnO-SiO2 sample and all Pt-doped ZnO-SiO2 are mainly composed of ZnO phase which still exists after applying both mentioned preparation methods. While in the Pt-doped samples, no diffraction peaks of Pt were observed, this is probably attributed to the low Ptdoping content (ca. 3 wt%). Moreover, it is obvious that Pt is well dispersed over the ZnO-SiO2 surface. 3.2. Nanostructure Characterization. Figure 2 displays the Fourier transforms of Pt LIII -edge EXAFS spectra of the Ptloaded catalysts. It can be noticed that the presence of the peak assigned to the Pt–Pt bond of Pt metal at around 2.5 A˚ is an indication of the formation of nanosized Pt metal [32]. In addition, the intensity of the Pt–Pt peak of the PAD: Pt-ZnO-SiO2 catalyst is smaller than that prepared by impregnation route. Therefore, Pt metal particles formed
on (PAD: Pt-ZnO-SiO2 ) showed smaller particle size than (Img: Pt-ZnO-SiO2 ). The grain sizes of PAD: Pt-ZnO-SiO2 and Img: Pt-ZnO-SiO2 nanocomposite photocatalysts were displayed in TEM images as shown in Figure 3. The particle size distribution obtained from the analysis of TEM images is shown in Figure 4. The result reveal that the nano-sized Pt metal with a mean diameter (d) of ca. 3 nm having a narrow size distribution was found on the PAD: PtZnO-SiO2 catalyst, whereas the aggregated Pt metal within various sizes is observed on Img: Pt-ZnO-SiO2 catalyst (d = 15 nm) which is in agreement with the results of EXAFS measurement. These findings suggest that the size of Pt metal particles depends on the preparation method. Also, TEM micrographs showed the homogenous distribution of Pt over ZnO-SiO2 matrix which was prepared by PAD method. 3.3. Surface Area Analysis. Specific surface area (SBET ) of ZnO/SiO2 , PAD: Pt-ZnO-SiO2 , and Img: Pt-ZnO-SiO2 powder samples were determined. The SBET values were 480, 460, and 450 m2 /g for the ZnO-SiO2 , PAD: Pt-ZnO-SiO2 , and Img: Pt-ZnO-SiO2 , respectively. The parameters of surface area and the data calculated from the t-plot are collected in Table 1. Furthermore, the total pore volume of Pt-ZnO-SiO2 is higher than that of ZnO-SiO2 . The values of SBET and St are generally close in most samples indicating the presence of mesopores. The values of Smicro are high compared to that of Smeso implying that the main surface is mesoporous solid. The surface texture data are correlated with the catalytic activity as will be mentioned later on. The N2 adsorptiondesorption isotherm of the prepared samples is shown in Figure 5. It is clear that the isotherm shows a typical type IV sorption behavior, which confirms the presence of mesoporous form. 3.4. Band-Gap Analysis (UV-Vis-DRS). Study of the UVvisible radiation absorption is an important tool for evaluating the changes in the absorbance spectra of the prepared semiconductor materials. This is expressed by the band-gap
4
International Journal of Photoenergy
(a)
(b)
60
60
50
50
40
40 Distribution (%)
Distribution (%)
Figure 3: The TEM images of the Img: Pt-ZnO-SiO2 (a) and PAD: Pt-ZnO-SiO2 (b) catalysts.
30
30
20
20
10
10
0
0 0
5
10
15
20
25
30
Particle size (nm) (a)
0
2
4
6
8
10
Particle size (nm) (b)
Figure 4: Size distribution diagrams of Pt metal obtained from the TEM images of the Img: Pt-ZnO-SiO2 (a) and PAD: Pt-ZnO-SiO2 (b) catalysts.
(Eg ) measurement which can be altered by different parameters. For instance, Eg value for pure ZnO phase is usually reported 3.37 [7]; however, these values are influenced by the synthesis method, and also affected by the existence of impurities doping the crystalline network and also the average crystal size of the semiconductor. In a previous study, different methods for calculating the Eg from the UV-Vis reflectance spectra were used. For example, some authors calculated the Eg values by a direct extrapolation of the F(R) spectrum, whereas others reported the wavelength corresponding to the maximum absorption [33]. As a consequence, quite different Eg values for ZnO samples are found in the literature. For instance, threshold wavelength values of 240 nm [34], 290 nm [35], and 360 nm [36] correspond to bandgaps 5.15, 4.28, and 3.45, respectively. Figure 6 gives UV-Vis-DRS of (ZnO-SiO2 , Img: Pt-ZnO-SiO2 , and
PAD: Pt-ZnO-SiO2 ). The results showed an increase in the absorbance in the visible light region with the Pt doping. The values of Eg for the synthesized semiconductors can be derived from the spectra by plotting (F(R) · hν)1/2 against hν [37, 38] as shown in Figure 7 and tabulated as shown in Table 2. The results revealed that the calculated values of Eg for (ZnO-SiO2 , Img: Pt-ZnO-SiO2 , and PAD: Pt-ZnOSiO2 ) were 3.4, 3.25, and 3.05 eV, respectively. This indicates shifting the spectra of the PAD: Pt-ZnO-SiO2 sample to the visible light area. 3.5. Evaluation of Photocatalytic Activity. The photocatalytic activity of the synthesized nanoparticles samples was evaluated by degradation of phenol in solution under UV light. Figure 8 displays the photocatalytic degradation of
International Journal of Photoenergy
5
Table 1: Texture parameters of ZnO-SiO2 , Img: Pt-ZnO-SiO2 , and PAD: Pt-ZnO-SiO2 . SBET (m2 /g) 480 450 460
Sample ZnO-SiO2 Img: Pt-ZnO-SiO2 PAD: Pt-ZnO-SiO2
St (m2 /g) 485 455 465
Smicro (cm2 /g) 380 500 650
Sext (cm2 /g) 100 365 385
Vp (cm3 /g) 0.866 0.726 0.668
Vmicro (cm3 /g) 0.069 0.022 0.066
Vmeso (cm3 /g) 0.803 0.704 0.602
r ˚ (A) 38.00 36.00 34.00
Note: (SBET ) BET-Surface area, (St ) surface area derived from Vl−t plots, (Smic ) surface area of micropores, (Sext ) external surface area, (Vp ) total pore volume, (Vmic ) pore volume of micropores, (Vmes ) pore volume of mesopores, and (r − ) mean pore radius.
600
0.045
500
0.035
0.04
Absorbance
V (adsorbed/g)
0.03 400
300
0.025 0.02 0.015 0.01 0.005
200
0 −0.005
200
100
300
400
500
600
700
800
Wavelength (nm) 0 0
0.2
0.4
0.6
0.8
1
P/P0
Figure 6: Diffuse reflectance UV-Vis absorption spectra of ZnOSiO2 , Img: Pt-ZnO-SiO2 , and PAD: Pt-ZnO-SiO2 .
ZnO-SiO2 PAD: Pt/ZnO-SiO2 Img: Pt/ZnO-SiO2
Figure 5: N2 sorption isotherms of ZnO-SiO2 , PAD-Pt/ZnO-SiO2 , and Img-Pt/ZnO-SiO2 . Table 2: The calculated band gap energy of ZnO-SiO2 , Img: PtZnO-SiO2 , and PAD: Pt-ZnO-SiO2 . Sample
ZnO-SiO2 Pt/ZnO-SiO2 Img Pt/ZnO-SiO2 PAD
Band gap energy (eV)
ZnO-SiO2 Img: Pt-ZnO-SiO2
3.40 3.25
PAD: Pt-ZnO-SiO2
3.05
100 mg/L phenol pertaining to (ZnO-SiO2 , Img: Pt-ZnOSiO2 , and PAD: Pt-ZnO-SiO2 ) at solution pH 7 for different time intervals. It can be seen that the rate of phenol photodegradation increased gradually with time reaching maximum efficiency values of 80, 85, and 99.9% after 1 h with parent ZnO-SiO2 , Img: Pt-ZnO-SiO2 , and PAD: PtZnO-SiO2 samples, respectively. Considering that the pure Pt oxides have no photocatalytic oxidation properties, such change in the photodegradation activity may be explained in terms of the differences in interaction between Pt and ZnO-SiO2 that led to several modifications in physical properties such as bandgap, particle size, and surface texture. Also, one could observe that the catalytic activity of ZnOSiO2 generally increased with the addition of Pt promoters. Figure 9 shows the good correlation between the physical
properties of the synthesized samples, such as bandgap, surface area, and pore volume, with their catalytic activity. It was obvious that the photodegradation activity was gradually increased with the decrease of bandgap and the increase of the surface area and pore volume. The maximum photocatalytic degradation of phenol was achieved in the case of PAD: Pt-ZnO-SiO2 in which the surface area and pore volume were maximum with lower bandgap value. It is believed that the lack of electron scavengers (surface Zn2+ ) and hole traps (surface hydroxyl groups) is responsible for the rapid recombination rate of e− /h+ , which leads to lower photocatalytic activity with the parent ZnO-SiO2 sample [6–9]. The photocatalytic activities of the Pt-doped ZnO-SiO2 nanoparticles increased due to that Pt plays two important roles; noble metal incorporation into TiO2 dielectric provides an absorption feature due to the surface plasmon resonance (SPR) occurring over the visible range of the spectrum. In particular, Ag, Pt, and Au metals are the most popular materials due to the strong SPR character [39, 40]. On the other hand, the superior driven photocatalytic efficiency of the Pt/TiO2 nanocomposite photocatalyst can be ascribed to the high efficiency of charge-pair separation due to the presence of deposited Pt serving as electron sinks to retard the rapid e− -h+ couple recombination, the good photoabsorption capacity in the visible light region, and the higher concentration of surface hydroxyl groups, which are able to effectively scavenge photogenerated valence band holes [41].
6
International Journal of Photoenergy 4
0.14 Bandgap (eV)
0.12
F(R∗E)1/2
0.10 0.08 0.06
3
B
80
85
A
2 1 0 70
75
0.04
90
95
100
105
110
0 6
5.5
5
4.5
4 3.5 Energy (eV)
3
2.5
2
ZnO-SiO2 Pt/ZnO-SiO2 Img Pt/ZnO-SiO2 PAD
Pore volume (cm3 /g)
Photocatalytic degradation of phenol (%)
0.02
1
A
0.8
C
B
0.6 0.4 0.2 0 70
100 80
80
85
90
95
800 Surface area (m2 /g)
120
75
100
105
110
Photocatalytic degradation of phenol (%)
Figure 7: Bandgap calculated from the DR-UV-Vis spectra of ZnOSiO2 , Img: Pt-ZnO-SiO2 , and PAD: Pt-ZnO-SiO2 . Photocatalytic degradation of phenol (%)
C
A B
600
C
400 200 0 70
60
75
80
85
90
95
100
105
110
Photocatalytic degradation of phenol (%)
Figure 9: Effect of physical parameters of the materials on their photocatalytic activity.
40 20
Accordingly, the highest activity was more clear in the PAD: Pt-ZnO-SiO2 sample in which the Pt diffuses in the lattice of the semiconductor. Thus, it lowered both the bandgap (as confirmed from the UV-Vis-DRS spectra analysis) and particle size (as confirmed from the TEM analysis). This resulted in increase in the surface area and pore volume, and consequently showed the best photoactivity with phenol degradation.
Pt metal with a mean diameter (d) of ca. 3 nm having a narrow size distribution was found on the PAD: Pt-ZnOSiO2 catalyst, whereas the aggregated Pt metal with various sizes is observed on Img: Pt-ZnO-SiO2 catalyst (d = 15 nm). The surface area of the synthesized samples was decreased from 480 to 460 and 450 m2 /g with ZnO-SiO2 , PAD: PtZnO-SiO2 , and Img: Pt-ZnO-SiO2 , respectively. The UV-VisDRS spectra analysis confirmed the lowest bandgab of PAD: Pt-ZnO-SiO2 with a value of 3.05, comparing to 3.25 and 3.4 with Img: Pt-ZnO-SiO2 and ZnO-SiO2 , respectively. The photocatalytic degradation of phenol in synthetic wastewater solution was found to be much more effective in the PAD: Pt-ZnO-SiO2 . The degradation efficiency increased from 80 to 85 and 99.9%, with the ZnO/SiO2 , Img: Pt-ZnO-SiO2 , and PAD: Pt-ZnO-SiO2 samples, respectively. The smallest particle size and lowest bandgab of the PAD: Pt-ZnO-SiO2 sample resulted in a high increase in the surface area and pore volume and consequently showed the best photoactivity with phenol degradation.
4. Conclusions
Acknowledgments
Pt doping, through photoassisted deposition (PAD) and impregnation (Img) routes, can greatly enhance the performance of ZnO-SiO2 as a photocatalyst. The nano-sized
This paper was funded by the Deanship of Scientific Research (DSR), King Abdulaziz University (KAU), Jeddah, under Grant no. (265/155/1431). The authors, therefore,
0 0
10
20
30 40 50 Reaction time (min)
60
70
ZnO-SiO2 Img Pt/ZnO-SiO2 PAD Pt/ZnO-SiO2
Figure 8: Photocatalytic degradation of phenol (%) for ZnO-SiO2 , Img: Pt-ZnO-SiO2 , and PAD: Pt-ZnO-SiO2 . (a) PAD: Pt-ZnO-SiO2 , (b) Img: Pt-ZnO-SiO2 , and (c) ZnO-SiO2 .
International Journal of Photoenergy acknowledge with thanks DSR and KAU for technical and financial support.
References [1] C. Hariharan, “Photocatalytic degradation of organic contaminants in water by ZnO nanoparticles: revisited,” Applied Catalysis A, vol. 304, no. 1-2, pp. 55–61, 2006. [2] M. Mrowetz and E. Selli, “Photocatalytic degradation of formic and benzoic acids and hydrogen peroxide evolution in TiO2 and ZnO water suspensions,” Journal of Photochemistry and Photobiology A, vol. 180, no. 1-2, pp. 15–22, 2006. [3] T. Pauport´e and J. Rathousk´y, “Electrodeposited mesoporous ZnO thin films as efficient photocatalysts for the degradation of dye pollutants,” Journal of Physical Chemistry C, vol. 111, no. 21, pp. 7639–7644, 2007. [4] J. Yu and X. Yu, “Hydrothermal synthesis and photocatalytic activity of zinc oxide hollow spheres,” Environmental Science and Technology, vol. 42, no. 13, pp. 4902–4907, 2008. [5] J. H. Sun, S. Y. Dong, Y. K. Wang, and S. P. Sun, “Preparation and photocatalytic property of a novel dumbbell-shaped ZnO microcrystal photocatalyst,” Journal of Hazardous Materials, vol. 172, no. 2-3, pp. 1520–1526, 2009. [6] M. Zhou, J. Yu, and B. Cheng, Journal of Hazardous Materials, vol. 137, 2006. [7] C. F. Klingshirn, “ZnO: material, physics and applications,” ChemPhysChem, vol. 8, no. 6, pp. 782–803, 2007. [8] A. Singhal, S. N. Achary, A. K. Tyagi, P. K. Manna, and S. M. Yusuf, “Colloidal Fe-doped ZnO nanocrystals: facile low temperature synthesis, characterization and properties,” Materials Science and Engineering B, vol. 153, no. 1–3, pp. 47–52, 2008. [9] C. R. Estrellan, C. Salim, and H. Hinode, “Photocatalytic activity of sol-gel derived TiO2 co-doped with iron and niobium,” Reaction Kinetics and Catalysis Letters, vol. 98, no. 1, pp. 187–192, 2009. [10] J. J. Schneider, “Magnetic core/shell and quantum-confined semiconductor nanoparticles via chimie douce organometallic synthesis,” Advanced Materials, vol. 13, no. 7, pp. 529–533, 2001. [11] H. B. Lee, Y. M. Yoo, and Y. H. Han, “Characteristic optical properties and synthesis of gold-silica core-shell colloids,” Scripta Materialia, vol. 55, no. 12, pp. 1127–1129, 2006. [12] R. M. Mohamed and E. S. Aazam, “Photocatalytic oxidation of carbon monoxide over NiO/SnO2 nanocomposites under UV irradiation,” Journal of Nanotechnology, vol. 2012, Article ID 794874, 9 pages, 2012. [13] A. A. Ismail, I. A. Ibrahim, and R. M. Mohamed, “Sol-gel synthesis of vanadia-silica for photocatalytic degradation of cyanide,” Applied Catalysis B, vol. 45, no. 2, pp. 161–166, 2003. [14] J. Zhang, Z. Liu, B. Han et al., “Preparation of silica and TiO2 SiO2 core-shell nanoparticles in water-in-oil microemulsion using compressed CO2 as reactant and antisolvent,” Journal of Supercritical Fluids, vol. 36, no. 3, pp. 194–201, 2006. [15] V. Maurice, T. Georgelin, J. M. Siaugue, and V. Cabuil, “Synthesis and characterization of functionalized core-shell γFe2 O3 -SiO2 nanoparticles,” Journal of Magnetism and Magnetic Materials, vol. 321, no. 10, pp. 1408–1413, 2009. [16] R. M. Mohamed, “Characterization and catalytic properties of nano-sized Pt metal catalyst on TiO2 -SiO2 synthesized by photo-assisted deposition and impregnation methods,” Journal of Materials Processing Technology, vol. 209, no. 1, pp. 577–583, 2009.
7 [17] K. S. Chou and C. C. Chen, “Fabrication and characterization of silver core and porous silica shell nanocomposite particles,” Microporous and Mesoporous Materials, vol. 98, no. 1–3, pp. 208–213, 2007. [18] R. M. Mohamed and I. A. Mkhalid, “Characterization and catalytic properties of nano-sized Ag metal catalyst on TiO2 SiO2 synthesized by photo-assisted deposition and impregnation methods,” Journal of Alloys and Compounds, vol. 501, no. 2, pp. 301–306, 2010. [19] M. J. Height, S. E. Pratsinis, O. Mekasuwandumrong, and P. Praserthdam, “Ag-ZnO catalysts for UV-photodegradation of methylene blue,” Applied Catalysis B, vol. 63, no. 3-4, pp. 305– 312, 2006. [20] T.-Y. Han, C.-F. Wu, and C.-T. Hsieh, “Hydrothermal synthesis and visible light photocatalysis of metal-doped titania nanoparticles,” Journal of Vacuum Science and Technology B, vol. 25, no. 2, article 430, 6 pages, 2007. [21] R. Ullah and J. Dutta, “Photocatalytic degradation of organic dyes with manganese-doped ZnO nanoparticles,” Journal of Hazardous Materials, vol. 156, no. 1–3, pp. 194–200, 2008. [22] R. Slama, F. Ghribi, A. Houas, C. Barthou, and L. El Mir, International Journal of Nanoelectronics and Materials, vol. 3, p. 133, 2010. [23] R. M. Mohamed, M. A. Al-Rayyani, E. S. Baeissa, and I. A. Mkhalid, “Nano-sized Fe-metal catalyst on ZnO-SiO2 : (photo-assisted deposition and impregnation) Synthesis routes and nanostructure characterization,” Journal of Alloys and Compounds, vol. 509, no. 24, pp. 6824–6828, 2011. [24] C. Ren, B. Yang, M. Wu et al., “Synthesis of Ag/ZnO nanorods array with enhanced photocatalytic performance,” Journal of Hazardous Materials, vol. 182, no. 1–3, pp. 123–129, 2010. [25] Y. Lai, M. Meng, and Y. Yu, “One-step synthesis, characterizations and mechanistic study of nanosheets-constructed fluffy ZnO and Ag/ZnO spheres used for Rhodamine B photodegradation,” Applied Catalysis B, vol. 100, no. 3-4, pp. 491– 501, 2010. [26] M. A. Barakat, H. Schaeffer, G. Hayes, and S. Ismat-Shah, “Photocatalytic degradation of 2-chlorophenol by Co-doped TiO2 nanoparticles,” Applied Catalysis B, vol. 57, no. 1, pp. 23– 30, 2005. [27] M. A. Barakat, J. M. Tseng, and C. P. Huang, “Hydrogen peroxide-assisted photocatalytic oxidation of phenolic compounds,” Applied Catalysis B, vol. 59, no. 1-2, pp. 99–104, 2005. [28] A. Abdel Aal, M. A. Barakat, and R. M. Mohamed, “Electrophoreted Zn-TiO2-ZnO nanocomposite coating films for photocatalytic degradation of 2-chlorophenol,” Applied Surface Science, vol. 254, no. 15, pp. 4577–4583, 2008. [29] M. Nomura and A. Koyama, “Design of an XAFS beamline at the photon factory: possibilities of bent conical mirrors,” Journal of Synchrotron Radiation, vol. 6, no. 3, pp. 182–184, 1999. [30] M. A. Barakat, Y. T. Chen, and C. P. Huang, “Removal of toxic cyanide and Cu(II) Ions from water by illuminated TiO2 catalyst,” Applied Catalysis B, vol. 53, no. 1, pp. 13–20, 2004. [31] J. R. Pemberton, “Retention of preservative levels of formaldehyde in desiccated biological products,” Journal of Clinical Microbiology, vol. 2, no. 2, pp. 144–146, 1975. [32] A. Caballero, F. Villain, H. Dexpert, F. Lepeltier, B. Didillon, and J. Lynch, “In situ EXAFS studies of modifications to supported metallic catalysts under reactive atmospheres,” Catalysis Letters, vol. 20, no. 1-2, pp. 1–13, 1993. [33] R. J. Davis and Z. Liu, “Titania-silica: a model binary oxide catalyst system,” Chemistry of Materials, vol. 9, no. 11, pp. 2311–2324, 1997.
8 [34] H. Yoshida, T. Shimizu, C. Murata, and T. Hattori, “Highly dispersed zinc oxide species on silica as active sites for photoepoxidation of propene by molecular oxygen,” Journal of Catalysis, vol. 220, no. 1, pp. 226–232, 2003. [35] M. Huang, P. E. J. Rivera-D´ıaz-Del-Castillo, O. Bouaziz, and S. Van Der Zwaag, “Irreversible thermodynamics modelling of plastic deformation of metals,” Materials Science and Technology, vol. 24, no. 4, pp. 495–500, 2008. [36] G. D. Mihai, V. Meynen, M. Mertens, N. Bilba, P. Cool, and E. F. Vansant, “ZnO nanoparticles supported on mesoporous MCM-41 and SBA-15: a comparative physicochemical and photocatalytic study,” Journal of Materials Science, vol. 45, no. 21, pp. 5786–5794, 2010. [37] M. Anpo and M. Che, “Applications of photoluminescence techniques to the characterization of solid surfaces in relation to adsorption, catalysis, and photocatalysis,” Advances in Catalysis, vol. 44, pp. 119–257, 1999. ´ and A. R. Gonz´alez[38] G. Lassaletta, A. Fern´andez, J. P. Espinos, Elipe, “Spectroscopic characterization of quantum-sized TiO2 supported on silica: influence of size and TiO2 -SiO2 interface composition,” Journal of Physical Chemistry, vol. 99, no. 5, pp. 1484–1490, 1995. ´ [39] J. F. Rivadulla, M. C. Vergara, M. C. Blanco, M. A. LopezQuintela, and J. Rivas, “Optical properties of platinum particles synthesized in microemulsions,” Journal of Physical Chemistry B, vol. 101, no. 44, pp. 8997–9004, 1997. [40] N. A. M. Barakat, K. D. Woo, M. A. Kanjwal, K. E. Choi, M. S. Khil, and H. Y. Kim, “Surface plasmon resonances, optical properties, and electrical conductivity thermal hystersis of silver nanofibers produced by the electrospinning technique,” Langmuir, vol. 24, no. 20, pp. 11982–11987, 2008. [41] D. Zhang, “Visible light-induced photocatalysis through surface plasmon excitation of platinum-metallized titania for photocatalytic bleaching of rhodamine B,” Monatshefte f¨ur Chemie, vol. 143, no. 5, pp. 729–738, 2012.
International Journal of Photoenergy
International Journal of
Medicinal Chemistry Hindawi Publishing Corporation http://www.hindawi.com
Volume 2014
Photoenergy International Journal of
Organic Chemistry International Hindawi Publishing Corporation http://www.hindawi.com
Volume 2014
Hindawi Publishing Corporation http://www.hindawi.com
Volume 2014
International Journal of
Analytical Chemistry Hindawi Publishing Corporation http://www.hindawi.com
Volume 2014
Advances in
Physical Chemistry Hindawi Publishing Corporation http://www.hindawi.com
Volume 2014
International Journal of
Carbohydrate Chemistry Hindawi Publishing Corporation http://www.hindawi.com
Journal of
Quantum Chemistry Hindawi Publishing Corporation http://www.hindawi.com
Volume 2014
Volume 2014
Submit your manuscripts at http://www.hindawi.com Journal of
The Scientific World Journal Hindawi Publishing Corporation http://www.hindawi.com
Journal of
International Journal of
Inorganic Chemistry Volume 2014
Journal of
Theoretical Chemistry
Hindawi Publishing Corporation http://www.hindawi.com
Hindawi Publishing Corporation http://www.hindawi.com
Volume 2014
Spectroscopy Hindawi Publishing Corporation http://www.hindawi.com
Analytical Methods in Chemistry
Volume 2014
Hindawi Publishing Corporation http://www.hindawi.com
Volume 2014
Chromatography Research International Hindawi Publishing Corporation http://www.hindawi.com
Volume 2014
International Journal of
Electrochemistry Hindawi Publishing Corporation http://www.hindawi.com
Volume 2014
Journal of
Hindawi Publishing Corporation http://www.hindawi.com
Volume 2014
Journal of
Catalysts Hindawi Publishing Corporation http://www.hindawi.com
Journal of
Applied Chemistry
Hindawi Publishing Corporation http://www.hindawi.com
Bioinorganic Chemistry and Applications Hindawi Publishing Corporation http://www.hindawi.com
Volume 2014
International Journal of
Chemistry Volume 2014
Volume 2014
Spectroscopy Volume 2014
Hindawi Publishing Corporation http://www.hindawi.com
Volume 2014