Abstract. Currently, Wireless Sensor Networks (WSNs) are formed by hundreds of low energy and low cost micro-electro-mechanical systems. Routing and low ...
SIR: A New Wireless Sensor Network Routing Protocol Based on Artificial Intelligence Julio Barbancho, Carlos Le´ on, Javier Molina, and Antonio Barbancho Department of Electronic Technology, University of Seville, C/ Virgen de Africa, 7. Seville 41011, Spain Tel: (+034) 954 55 71 92, Fax: (+034) 954 55 28 33 {jbarbancho, cleon, fjmolina, ayboc}@us.es
Abstract. Currently, Wireless Sensor Networks (WSNs) are formed by hundreds of low energy and low cost micro-electro-mechanical systems. Routing and low power consumption have become important research issues to interconnect this kind of networks. However, conventional Quality of Service routing models, are not suitable for ad hoc sensor networks, due to the dynamic nature of such systems. This paper introduces a new QoS-driven routing algorithm, named SIR: Sensor Intelligence Routing. We have designed an artificial neural network based on Kohonen self organizing features map. Every node implements this artificial neural network forming a distributed intelligence and ubiquitous computing system. Keywords: Wireless sensor networks (WSN); Ad hoc networks, Quality of service (QoS); Routing; Artificial neural networks (ANN); SelfOrganizing Map (SOM).
1
Introduction
Due to the sensor features (low-power consumption, low radio range, low memory, low processing capacity, and low cost), self-organizing network is the best suitable network architecture to support applications in such a scenario. Goals like efficient energy management, high reliability and availability, communication security, and robustness have become very important issues to be considered. Many research centers in the whole world have focused their investigations in this kind of networks [1]. We present in this paper a new routing algorithm which introduces artificial intelligence (AI) techniques to measure the QoS supported by the network. The wireless sensor networks (WSN) architecture as a whole has to take into account different aspects, such as the protocol architecture; Quality-of-Service, dependability, redundancy and imprecision in sensor readings; addressing structures, scalability and energy requirements; geographic and data-centric addressing structures; aggregating data techniques; integration of WSNs into larger networks, bridging different communication protocols; etc. [2]. H.T. Shen et al. (Eds.): APWeb Workshops 2006, LNCS 3842, pp. 271–275, 2006. c Springer-Verlag Berlin Heidelberg 2006 �
272
2
J. Barbancho et al.
SIR: Sensor Intelligence Routing
The necessity of connectivity among nodes introduces the routing problem. In a WSN we need a multi-hop scheme to travel from a source to a destiny. The problem is solved by a technique called network backbone formation. We propose a modification on Dijkstra’s algorithm to form the network backbone, with the minimum cost paths from the base station or root, r, to every node in the network. We have named this algorithm Sensor Intelligence Routing, SIR, which is described as follows in table 1. Table 1. SIR algorithm #1: Set up phase: d(r) = 0 wri if vi ∈ Γ (r) d(vi ) = / Γ (r) ∞ if vi ∈ r if vi ∈ Γ (r) Γp (vi ) = / Γ (r) 0 if vi ∈ #2: Find a vj ∈ T such as d(vj ) = min{d(vi )|vi ∈ T } Do T = T − {vj }
#3: ∀
vi ∈ T ∩ Γ (vj ) calculate ti := d(vj ) + wji
If ti < d(vi ) do d(vi ) = ti � #4: If |T | > 0 go to #2 � If |T | = 0 stop
Once it is designed the backbone formation algorithm, we have to define the way of measuring the edge weight parameter, wij . We use a QoS definition based on three types of QoS parameters: timeliness, precision and accuracy. Due to the distributed feature of sensor networks, our approach measures the QoS level in a spread way, instead of an end-to-end paradigm. Each node tests every neighbor link quality with the transmissions of a specific packet named ping. With these transmissions every node obtains mean values of latency, error rate, duty cycle and throughput. These are the four metrics we have define to measure the related QoS parameters. Once a node has tested a neighbor link QoS, it calculates the distance to root using the obtained QoS value. The expression 1 represents the way a node vi calculates the distance to root through node vj , where qos is a variable which value is obtained as an output of a neural network. This tool is described in section 2.1. d(vi ) = d(vj ) · qos 2.1
(1)
SOM: Self Organizing Map
One of the most powerful mechanism developed in AI is the Self-Organizing Map (SOM) model [3], created by Teuvo Kohonen in 1982, at the University of Helsinky, Finland. In SOM we can distinguish two phases: learning phase, and execution phase. SOM gives an output denoted by qos. This value is returned by a function Θ defined by the SOM user, according to his aims. Θ depends on the winning neuron: qos = Θ (g). In section 3 we define this function.
SIR: A New WSN Routing Protocol Based on Artificial Intelligence
3
273
Performance Evaluation by Simulation
Due to the desire to evaluate the SIR performance, we have created two simulation experiments running on our wireless sensor network simulator OLIMPO. Every node in OLIMPO implements a neural network (online processing). We have focused our simulation on a wireless sensor network composed by 4000 nodes covering an area of 87 Km2 . This is the typical area of a european medium size city like Seville (Spain) or Zurich (Switzerland). The density of nodes which are within the transmission radius of a node es 7. Noise influence over a node has been modelled as an Additive Gaussian White Noise, (AWGN). Noise power has been modelled as a stochastic variable with a mean value expressed as a percentage of the antenna sensibility; and a standard deviation expressed as a percentage of its mean value. Our SOM has a first layer formed by four input neurons, corresponding with every metric (latency, throughput, error rate and duty cycle); and a second layer formed by twelve output neurons forming a 3x4 matrix. Next, we detail our SOM implementation process. Learning Phase. In order to organize the neurons in a two dimensional map, we need a set of input samples x(t)=[latency(t),throughput(t),error-rate(t),dutycycle(t)]. This samples should consider all the QoS environments in which a link communication between a pair of sensor nodes can work. For that reason we have to create the special environments. These scenarios are implemented by different noise simulations. In our research we created a WSN over OLIMPO composed by 4000 sensor nodes. In this network, we chose a pair of nodes (let us denote them as v800 and v1250 ) and introduced a low power noise into one of them (e.g. v1250 ). According to the input requirements, we had to measure the QoS metrics. In that sense, we ran a ping application 50 times at node v800 . This application pings are sent from node v800 to node v1250 . Ping requires acknowledgment (ACK). The way node v800 receives ACKs will determine a specific QoS environment, expressed on the four elected metrics: latency (seconds), throughput (bits/sec), error rate (%) and duty cycle(%) [4]. This process was repeated 100 times while increasing the noise power. With the set of 100 input samples we trained our neural network. This process was implemented on a personal computer using the MATLAB� neural toolbox (offline processing). Once we had ordered the neurons on the Kohonen layer, we identified each one of the set of 100 input samples with an output layer neuron. According to this procedure the set of 100 input samples were distributed over the SOM. We realized that input samples obtained from a similar noisy environment and with similar QoS features were allocated in a specific region of the SOM. Consequently we obtained a map formed by clusters, where every cluster corresponded with a noise level introduced at the environment and consequently a specific QoS. Furthermore, a synaptic-weight matrix is formed, where every synapsis identifies a connection between input and output layer.
274
J. Barbancho et al.
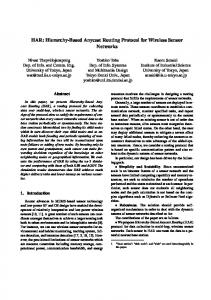
In order to quantify the QoS level we studied every cluster features and assigned a value between 0.2 and 10, according to the level of noise introduced. This assignment was based on our experience as experts in networks. In that way we defined the output function Θ(i, j), i ∈ [1, 3], j ∈ [1, 4] with twelve values corresponding with every neuron (i, j), i ∈ [1, 3], j ∈ [1, 4]. Execution Phase. Every sensor node measures the QoS of its links collecting input samples and running the wining neuron election algorithm. For example, if a specific input sample is quite similar than the synaptic-weight-vector of neuron (2,2), this neuron will be activated. After the winning neuron is elected, the node uses the output function Θ to assign a QoS estimation, qos. Finally this value is employed to modified the distance to root (eq. 1). Our SIR algorithm has been evaluated by the realization of two experiments detailed as follows. Experiment #1. First, a wireless sensor network with 4000 nodes is created. The network backbone is formed using SIR algorithm, as detailed in table 2. However, no SOM is applied, so, the distance from a node vi to root d(vi ) is not modified by the neighbor link quality, qos (eq.1). We have called this algorithm as No AI algorithm. Next, a high level of noise is introduced at nodes v100 and v200 , figure 1.c. Finally, a specific node (e.g. node number v300 ) runs the ‘Transmit clock to base station’ application. Node v300 sends 10 packets to root to measure the latency. Every packet contains ‘clock’ information.
30
25
NoAI routing algorithm
30
20 25
15 20
Clock latency (sec)
Clock latency (sec) 15
10
SIR routing algorithm
10
5
5 0 0 200
150
50 100
50
Mean noise (% Ps)
0
Noise standard deviation (% Mean noise)
100
(a) noisy stations
(c)
0
0
20
40
60
80
100
120
140
160
180
200
Mean noise (% Ps) (when noise standard deviation is set to 50% of Mean Noise)
noisy stations
(b)
(d)
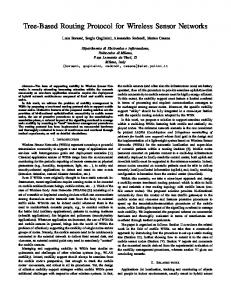
Fig. 1. (a) Clock latency measurement: No AI performance (b) Clock latency measurement: SIR versus No AI (c) Network backbone formation based on No AI algorithm (d) Network backbone formation based on SIR algorithm.
SIR: A New WSN Routing Protocol Based on Artificial Intelligence
275
Figure 1.a represents clock latency depending on the level of the noise power introduced at nodes v100 and v200 . Experiment #2. This experiment is similar than experiment #1, but in this case, the distance d(vi ) is modified by the neighbor link quality, using equation 1. The network backbone is formed in such a way that the path created from the node v300 to root does not contain the noisy nodes, figure 1.d. Figure 1.b shows SIR algorithm performance compared with No AI algorithm performance. As depicted in this figure, if the mean noise is low, both algorithm performances are excellent. In this case, the path from the node v300 to root contains nodes v100 and v200 . However, when the mean noise grows up above the antenna sensibility SIR algorithm performance improves No AI algorithm performance, maintaining the QoS. In this case, the path from the node v300 to root does not contain the noisy nodes.
4
Conclusion and Future Works
SIR has been presented in this paper as an innovative QoS-driven routing algorithm based on artificial intelligence. This routing protocol can be used over wireless sensor networks standard protocols, such as IEEE 802.15.4 and Bluetooth� , and over other well known protocols such as Arachne, SMACS, EAR, LEACH, etc. The inclusion of AI techniques (e.g. neural networks) in wireless sensor networks has been proved to be an useful tool to improve network performances. An additional advantage is the low cost the AI implementation represents. The great effort made to implement a SOM algorithm inside a sensor node means that the use of artificial intelligence techniques can improve the WSN performance. According to this idea, we are working on the design of new protocols using this kind of tools.
References 1. I.F. Akyildiz, Y. Su, W. Sankarasubramaniam, and E. C ¸ ayirci. Wireless sensor networks: A survey. Computer Networks, Elsevier, 38:393–422, December 2002. 2. F.J. Molina, J. Barbancho, and J. Luque. Automated meter reading and SCADA application. Lecture Notes in Computer Science, Springer Verlag, 2865:223–234, October 2003. 3. T. Kohonen. The self-organizing map. In Proccedings of the IEEE, volume 78, pages 1464–1480, 1990. 4. R. Iyer and L. Kleinrock. QoS control for sensor networks. In IEEE International Conference on Communications, ICC’03, volume 1, pages 517–521. IEEE Press, May 2003.