vice is hosted by a Web application server (e.g., IBM's. Websphere1 or JBoSS2). ..... Instead, data- base updates were serialized and scheduled from a single. 7 ...
SLA-driven Resource Provisioning of Multi-tier Internet Applications Swaminathan Sivasubramanian, Guillaume Pierre, Maarten van Steen, Sandjai Bhulai Department of Mathematics and Computer Science, Vrije Universiteit, Amsterdam
Abstract
To ensure that a service can meet its target SLA, various techniques have been proposed that replicate the database, application or Web servers [1, 6, 8, 10, 17, 19, 20, 21]. Each of these techniques aims to optimize the performance of a single tier of a service, and can be of great value for achieving scalability. However, from the viewpoint of an administrator, the real issue is not optimizing the performance of a single tier, but hosting a given service such that its end-to-end performance meets the SLA. In the most general case, effective hosting of an Internet service involves replicating its code to a number of application servers and its data to an array of data store machines. Furthermore, different caching layers such as service response caches and database caches can be deployed to improve performance. As we demonstrate in this paper, the widely adopted technique of scaling each tier of a service individually can result in gross overprovisioning and even poor performance. Instead, effective hosting of a service requires careful deployment of several techniques at different tiers. The underlying challenge then is, given a service and its workload, to find the best resource configuration for hosting the service in order to meet its SLA. We define the best resource configuration as the configuration that meets the SLA with the smallest quantity of resources.
In this paper, we present a novel resource provisioning approach for multi-tiered Internet services. In contrast to previous works, we propose to select the resource configuration based on its end-to-end performance instead of optimizing each tier individually. The proposed approach employs a combination of queueing models and runtime cache simulations. We demonstrate the effectiveness of our proposed approach through extensive experimentations with a wide range of applications. Our experiments show that our approach, compared to optimizing tiers independently, is able to host services more scalably with less resources.
1
Introduction
Modern Internet services have evolved from simple monolithic systems to complex multi-tiered architectures. Web sites such as Amazon.com, yahoo.com and ebay.com do not simply deliver static pages but generate content customized for each user. To this end, these sites often use complex multi-tiered software systems. For instance, the Web page generated in response to each client request to Amazon.com is not generated by a single application but by hundreds of smaller Web applications operating simultaneously [27]. Such elementary software applications, designed to be composed with each other are commonly referred to as services. As shown in Figure 1(a), a service generates a response to each request by executing some applicationspecific business logic, which in turn typically issues queries to its data store and/or requests to other services. A service is exposed through well-defined client interfaces accessible over the network. Examples of services include those for processing orders and maintaining shopping carts. In such environments, providing low response latency is often considered a crucial business requirement and forms an integral component of customer service-level agreements (SLAs).
Efficient provisioning of a multi-tier service poses three important challenges. First, choosing the right set of techniques to host a service in a scalable manner is not trivial as different techniques are best suited for different kinds of services. The best resource configuration for a service is dependent on its characteristics and its workload. For example, if requests to the service exhibit high temporal locality and generate very few data updates, caching service responses might be beneficial. On the other hand, if the bottleneck is the retrieval of the underlying data, then database caching or replication might be preferable depending on the temporal locality of database queries. Sometimes, a combination of these techniques might be required to meet a certain SLA. Second, choosing the best resource configuration as the workload 1
changes is challenging. This is because changes in the request workload have different impact on the performance of different tiers. For example, changes in the temporal locality of the requests will affect the performance of caching tiers but not that of the business logic tier. Third, the benefits of adding a resource to different tiers vary, and are highly dependent on the nature of the service. For example, a computationally intensive tier such as a business logic tier can benefit from a linear decrease in queueing latency when adding a server. On the other hand, caching tiers follow a law of diminishing returns, and the benefit of increasing the number of cache servers decreases after a certain threshold. The motivation behind our work is based on the following observation: since the SLA of a multi-tier service is based on its end-to-end performance, it is not obvious that one can simply optimize the performance of each tier independently. As we will show, due to the complex interaction between tiers, such an approach does not allow to explain the overall performance of the service effectively, and moreover can lead to poorly performing or over-provisioned resource configurations. Instead, we claim that effective hosting of services requires a good understanding of the dependency between different tiers, and requires to make provisioning decisions based on an end-to-end performance model. This paper presents a novel approach to resource provisioning of multi-tier Internet services. Provisioning decisions are made based on an analytical model of the endto-end response time of a multi-tiered service. A key observation behind our solution is that resource provisioning algorithms based on queueing models alone are not sufficiently effective as they do not capture the temporal properties of the workload such as the cache locality and the update characteristics. Our system addresses this limitation by employing a combination of queueing models and runtime cache simulations. We have implemented a prototype system based on our approach for provisioning database-driven Web services. The implementation continuously gathers the required performance metrics (such as execution times at each tier, the incoming request rate, and cache hit ratio) using sensor software plugged into the different tiers. These data are passed to the resource provisioning system to decide on the right resource configuration for a given service to ensure that it meets its SLA. We demonstrate using several industry standard benchmarks that our approach makes the correct choices for different types of services and workloads. In many cases, our approach reaches the required performancerelated SLA with less servers than traditional resource provisioning techniques. Finally, we discuss the problem of availability-based resource provisioning and discuss how we can extend our approach to meet availability related SLAs. This paper is structured as follows. Section 2 presents the background and overview of techniques used in host-
ing multi-tiered Internet services. Sections 3 and 4 present our analytical model and resource provisioning approach respectively. Section 5 presents experiments that demonstrate the effectiveness of our approach. Section 6 discusses the issues that arises from our approach and the mechanisms to address them. Section 7 presents the related work and Section 8 concludes the paper.
2
Background
2.1 Infrastructure Model Typically, large-scale e-commerce enterprises deploy their software system across multiple data centers. A data center is built out of cluster(s) of servers connected to each other and to the Internet through a high-speed network. In this paper, we assume that the resources allocated to a service are located within a single data center. Furthermore, we assume that each data center has a pre-allocated rescue pool of resources. We assume that each service is assigned a performance and availability goal (usually referred to as an SLA). For sake of simplicity, we will initially restrict ourselves to performance-related SLAs. We define the SLA of a service such that its average response time should be within a [LowRespT ime, HighRespT ime] interval. Availability related SLAs are discussed in Section 6. We treat a single PC machine as the smallest unit of resource allocation. This approach is primarily motivated by the infrastructure model used by organizations such as Google and Amazon. Such organizations build their infrastructure out of inexpensive PCs instead of high-end multiprocessor server machines [3, 27]. When a service hosted in a data center does not meet its SLA, one or more machines from the rescue pool are added to the service to ensure that it meets its desired performance. However, a service should not use more resources from the pool than necessary as these resources are shared with other services hosted in the data center.
2.2 Generalized Service Hosting Architecture As shown in Figure 1(a), a service conceptually consists of business logic that generates responses to incoming requests. To do so, it may issue (zero or more) queries to a service-specific database and (zero or more) requests to other services. Usually, the business logic of a Web service is hosted by a Web application server (e.g., IBM’s Websphere1 or JBoSS2 ). The data tier can use a relational DBMS (e.g., IBM’s DB23 , or MySQL4 ) or an object store such as [11, 16]. In our work, we focus on 1 http://www.ibm.com/software/websphere 2 http://www.jboss.org 3 http://www.ibm.com/db2 4 http://www.mysql.com
2
Client-side service caches Tier 2 a
Requests Responses
Business Logic
Request Distributor
Data
� �
� �
� �
� �
� �
� �
� �
� �
� �
� �
� �
� �
� �
� �
� �
� �
� �
� �
� �
� �
� �
� �
� �
� �
� �
� �
� �
� �
� �
� �
� �
� �
� �
� �
� �
� �
� �
� �
� �
� �
� �
� �
Cache
Cache Cache
External service requests
Server-side service cache Tier 0
(a)
Load Balancer �
�
�
�
�
�
�
�
�
�
�
�
�
�
�
�
�
�
�
�
�
App Server App Server App Server Business Logic Tier Tier 1
Cache
�
� �
� �
� �
�
� �
� �
� �
�
� �
� �
� �
�
� �
� �
� �
�
� �
� �
� �
�
� �
� �
� �
�
� �
� �
� �
�
� �
� �
� �
�
� �
� �
� �
�
� �
� �
� �
�
� �
� �
� �
�
� �
� �
� �
�
� �
� �
� �
�
� �
� �
� �
�
�
�
�
�
�
�
�
�
�
�
�
�
�
�
External service requests
Cache
Data �
�
�
�
�
�
�
�
�
�
�
�
�
�
�
�
�
�
�
�
�
�
�
�
�
�
�
Cache Cache
Database Caches Tier 2 b
�
� �
� �
� �
�
� �
� �
� �
�
� �
� �
� �
�
� �
� �
� �
�
� �
� �
� �
�
� �
� �
� �
�
� �
� �
� �
�
� �
� �
� �
�
� �
� �
� �
�
� �
� �
� �
�
� �
� �
� �
�
� �
� �
� �
�
� �
� �
� �
�
� �
� �
� �
Data
Data Tier Tier 3
(b)
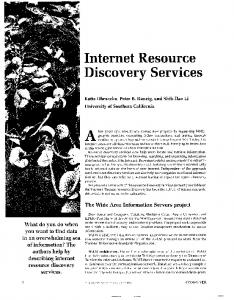
Figure 1: (a) Simplified model of an Internet service and (b) Generalized hosting architecture of a multi-tier service. Business-logic replication (done at tier 1) is a technique used when the computational load forms a bottleneck [20, 21]. Usually, replicating a service’s business logic translates to running multiple instances of the application across multiple machines. Examples of computationally intensive business logic include the page generation logic of an e-commerce site (that combines the responses from multiple services using XSL transformation to generate an HTML page) [27] and Grid services.
relational DBMS-driven services. Services do not share their database but interact with each other only through their service interfaces. The objective of our work is to determine the resource configuration for a service such that it can meet its SLA with the minimum number of resources. To do so, we need to identify the relevant tiers and their interrelationships. Instead of contrasting different caching and replication techniques, we claim that they are in fact complementary as they aim at improving the performance of different tiers. We define a generalized service hosting architecture encompassing several techniques that can be applied to improve the performance of a given service in addition to the functional tiers of business logic and data (see Figure 1(b)). Any resource configuration where each tier of a service is provisioned with one or more servers (zero or more for non-functional tiers) will lead to a workable system. The problem of choosing the best resource configuration can now be translated to choosing one such workable resource configuration that will ensure that the service meets its SLA with minimum number of resources. We briefly explain the techniques used in our generalized service hosting architecture.
Client-side service-response caching (done at tier 2a ) is used to cache the responses of the requests made by the business logic to the external services. As the external services can reside at other data centers, deploying a client-side service-response cache can be beneficial as it alleviates the wide-area network bottleneck. Intuitively, client-side response caches are useful only if there is high network latency between the client and the service or if the external service does not meet its SLA. Database caching (done at tier 2b ) is a technique used to reduce the load on the data tier. Database caching systems store the response of database queries and maintain the consistency of cached query responses. Examples of database caching systems include DBProxy [1], DBCache [6] and GlobeCBC [23]. In our prototype, we use our in-house database caching solution, GlobeCBC. However, the approach and results presented in this paper also apply to any other database caching system.
In Server-side service-response caching (done at tier 0), the system stores the response to each service request (identified by the requested method name and parameters), so that future identical requests are not forwarded to the business logic tier. The cached responses are often formed as XML messages if the service is implemented as a Web service. This technique can improve the throughput of the service as a cache hit in this tier reduces the load on the business logic tier (and other subsequent tiers). However, this technique is beneficial only if the service requests exhibit high temporal locality. Note that this is functionally similar to HTML fragment caching done for Web applications that deliver HTML pages. We discuss the mechanisms used to maintain the consistency of caches below.
Database replication (done at tier 3) is another widely adopted technique to alleviate the database bottleneck. Data are replicated usually to achieve better throughput and/or higher availability [8, 15, 19, 22]. If we restrict ourselves to performance considerations, then data replication is more beneficial than database caching only if the database queries exhibit low temporal locality [23]. On the other hand, if the underlying database receives many updates, then the benefit of database replication reduces due to the overhead of consistency maintenance. 3
2.3
Request Distribution
same template-based invalidation technique for serviceresponse caching. As noted in [23], template-based invalidations help in reducing the number of invalidations to a considerable extent for many classes of Web applications while providing acceptable consistency guarantees.
In our service hosting architecture, each tier of a service can be provisioned with one or more servers (zero or more for caching tiers). This allows for increased service capacity but requires the use of load balancers to route the requests among the servers in a given tier. Usually, this task can be performed by hardware load balancers such as CISCO GSLBs5 , which are designed to uniformly distribute requests across a cluster of servers. However, balancing the request load across a distributed set of cache servers requires more sophisticated algorithms. A simple (weighted) round-robin request distribution technique can lead to a very poor hit rate as the request distribution is not based on where the requested object might be cached. We use consistent hashing to distribute requests across a distributed set of cache servers [14]. This design avoids redundant storage of objects across multiple cache servers. This means that adding cache servers will increase the number of unique cached objects and can potentially improve the hit ratio. Another important feature of consistent hashing is that relatively few objects in the cluster become misplaced after the addition/removal of cache servers.
2.4
3
Modeling End-to-End Latency of a Service
To choose the best resource configuration for a given service and its workload, we must be able to estimate the end-to-end latency of the service for any valid resource configuration. We first present a multi-queue-based analytical model for estimating the end-to-end latency of a multi-tiered Internet service. We then describe how an operational service can be fit to the model for estimating its latency under different resource configurations.
3.1 An Analytical Model In general, multi-tiered systems can be modelled by open Jackson queueing networks [12]. To illustrate this model, consider a system with k tiers. Let us assume that external requests arrive according to a Poisson process with a mean arrival rate γi to tier i. This assumption is usually true for arrivals from a large number of independent sources and has been shown to be realistic for ecommerce Web sites [26]. The requests at tier i receive service with an exponentially distributed duration with mean Ei . When a request completes service at tier i, it is routed to tier j with probability rij (independent of the system state). There is a probability ri0 that the customer will leave the system upon completion of the service. In this model, there is no limit on the queueing capacity at each tier, thus a request is never blocked. Jackson found the solution to the steady-state probabilities of the number of requests at each tier which is popularly known as a product form. Let λi be the total mean flow arrival into tier i (external requests and internally routed requests). Then, we have
Cache Consistency
Caching service responses (at tier 0 and tier 2a ) and database query responses (at tier 2b ) introduces a problem of consistency maintenance. A cached response at any of these tiers might become inconsistent when the underlying database of the service gets updated. To simplify the process of consistency maintenance, we assume that the request workload to the database of a service (and also to other services) consists of a fixed set of query templates. A database query template is a parameterized SQL query whose parameter values are passed to the system at runtime. This scheme is deployed, for example, using Java’s prepared statement. In our system, we expect the developer to specify a priori which query template conflicts with which update template. For example, consider the following template: QT 1: “SELECT price, stock, details FROM book WHERE id=?” and its conflicting update query template U T 1: “UPDATE price=price+1 FROM book WHERE id=?”. In this example, when a server caches a query result that is an instance of QT 1, it subscribes to receive invalidations to QT 1. When the data tier receives an update query that is an instance of U T 1, it sends out a message to invalidate all instances of QT 1. Templatebased invalidations can be extended to include the parameter of the query template (so that a query to update the price of book “XYZ” invalidates only the instance of QT 1 with the same parameter “XYZ”). We use the
λi = γi +
k X
rji λj .
(1)
j=1
We define ρi to be λi .Ei . Let Ni be the random variable for the number of requests at tier i in steady state. Jackson showed that P(N1 = n1 , . . . , Nk = nk ) = (1−ρ1 )ρn1 1 · · · (1−ρk )ρnk k . This result states that the network acts as if each node could be viewed as an independent tier modeled by an M/M/1 queue with parameters λi and Ei . In fact, the network does not decompose into individual queues with Poisson arrivals, prohibiting the derivation of performance measures such as higher moments and variances.
5 http://www.cisco.com/en/US/products/hw/
contnetw/ps813/index.html
4
K0 = {T1 } (as all outgoing requests of T0 are always sent to T1 ). In the business logic tier, p1 = 1, as all services always have to do some business logic computation, and K2 = {T2a , T2b } as the business logic can make requests to the external service tier (T2a ) and data tier (T2b ). We can then perceive a service as a 4-tiered system, whose end-to-end response time can be obtained from equation 2 as follows: R0 = Q0 + p0 ∗ E0 + (1 − p0 ) ∗ (E1 + N1,2a ∗ R2a +N1,2b ∗ R2b ) (3)
However, averages can be easily obtained for individual tiers, since the expected response time Ri of tier i is given by Ri = ρi /[λi (1 − ρi )]. The expected total response time of a customer depends highly on the routing matrix (rij )ij . Let z = (z1 , . . . , zm ) be a path through the network, thenP the expected response time along this m path is given by i=1 Rzi . By taking the expectation over all paths, the overall expected response time can be obtained. Naturally, for specific routing matrices, such as systems aligned in a serial order, this is straightforward. The multi-tier systems considered in this paper differ from the standard Jackson network in two aspects. First, the tiers should be modeled by processor-sharing systems instead of strict waiting queues. Second, the tiers have caches in front of them. However, Baskett et al. [4] tell us that the tiers can also be replaced by processorsharing nodes with general service times. The given formulas and results still hold. Caching tiers also naturally fit into this model. For example, let us consider a scenario where a tier i−1 makes a request to a caching tier i to check if the response is already cached. If the response is found in the cache, then it is returned immediately else the request is forwarded to tier i + 1 which generates the response. If pi denotes the cache hit ratio for tier i, then the routing probabilities between the tiers can be formulated as r(i−1)i = pi and r(i−1)(i+1) = 1 − pi . From the above results, we conclude that the expected end-to-end response time of our system can be obtained by taking the expectation of the response times taken by a request along its path. As shown in Figure 1(b), each incoming request is received by the first tier which in turns serves the request locally or triggers calls to other tiers. Consider a tier Ti that receives a request that can be serviced locally with a probability pi or can trigger multiple requests to more than one tier. Let Ki be the set of tiers that Ti calls for servicing its incoming requests, i.e., Tj ² Ki if Tj is called by Ti . For example, in Figure 1, T1 makes requests to T2a and T2b , so K1 = {T2a , T2b }. Let Ni,j denote the average number of requests sent to Tj by Ti for serving a single incoming request to Ti , i.e., Ni,j = rij ∗λi /γi . For example, if a single request to the business logic tier (T1 ) results in 1.5 queries to the data cache tier (T2b ), then N1,2b = 1.5. The average response time, Ri , to service a request at Ti is given by: X Ri = Qi + pi ∗ Ei + Ni,j ∗ Rj (2)
where R1 , R2a and R2b are the average response time for the business logic tier, client-side service-caching and database-caching, tiers respectively. These response times can be derived in a similar way from equation 2. We will discuss our model to compute variances and percentiles of response times in Section 6.
3.2 Fitting a Service to the Model: Service Characterization In this model, a service is characterized by parameters pi , Ei and Ni,j . To estimate the average response time of a given service, these parameters must be measured. Most of these values can be obtained by instrumenting the cache managers and application servers appropriately. For example, the execution time of caches can be obtained by instrumenting the cache manager so that the average latency to fetch an object from cache is logged. Note that all measurements of execution times should be realized during low loads to avoid measuring the queueing latency in addition to the service times [25]. Also, measuring the execution time of the business logic tier is less straightforward as instrumentation at this tier can obtain only the mean response time to service a request at the application server, i.e., R1 . However, R1 is an aggregated value that encompasses E1 and the response times of the subsequent tiers (see Equation 3). So, we must compute E1 as R1 − R2a − R2b . Note that the above model assumes that the calls made between tiers are synchronous. Modeling asynchronous calls is beyond the scope of this paper. Using this model only to estimate the current average response time of a service would be useless, as this value can also be measured directly. However, the model allows us to estimate the response time that the service would provide if its resource configuration (and therefore the parameters) was changed. In our experiments, we observed that the average response time estimates derived from our model have a high accuracy with an error margin less than 10%. We do not present detailed validation results due to lack of space. However, we briefly mention the accuracy of the model for different applications in Section 5.
j²Ki
where Qi is the average queueing latency experienced by a request at Ti before being serviced and Ei is the average time taken by tier Ti to execute the request (excluding the response times of other tiers). Equation 2 can capture the response times of tiers with different characteristics (e.g., caching or computational). For example, for a server-side caching tier (T0 ), p0 denotes the average cache hit ratio, N0,1 = 1 − p0 (each request to the cache goes to T1 only if it is a cache miss) and 5
4
Resource Provisioning Qdb = λdb ∗w∗Edbwrite +((λdb ∗(1−w)∗Edbreads )/n) (4) where λdb is the arrival rate of requests to the data tier. For estimating this value, we need the value of w, which requires explicit identification of update queries. As noted earlier, in our implementation we assume that each query is explicitly marked and belongs to one of the read/write query templates. This allows us to obtain accurate measurements of w and average execution times.
Once a service is running in our platform, we must monitor its end-to-end performance and, if necessary, decide on the necessary changes in its resource configuration. In the event of an SLA violation, the system may need to adapt the number of servers allocated to one or more tiers to ensure that its response time returns to and remains within its SLA. To this end, the system estimates the response times that would result from different resource configurations using the model described in Section 3, and then choose the valid resource configuration that meets the SLA with the least resources. In a sense, we can perceive the resource provisioning system as a typical continuous feedback system with appropriate sensors and controllers. The system must detect changes in performance using sensors and trigger the controller to change the resource configuration (i.e., the number of servers provisioned for each tier) to bring the average response time back to the acceptable interval. To do so, the controller needs to determine the improvement in response time that would result from adding a machine at each tier, and then choose the tier that gives the greatest improvement in end-to-end response time as the one to provision the resource. Adding an extra server to a tier Ti reduces the queueing latency Qi as the tier has more processing capacity. Moreover, for caching tiers, this can improve the hit ratio (pi ) as the distributed cache has more storage capacity. To make good decisions, the controller therefore needs to determine the expected values of these parameters for each tier if the number of servers provisioned in Ti were changed.
4.1
4.2 Estimating improvement in cache hit ratio For caching tiers, in addition to the execution time and queueing latency, the cache hit ratios have a major influence on the response time. Estimating the improvement in cache hit ratio when a new server is added is not trivial due to the non-linear behavior in hit ratio improvement. However, our approach relies on the ability to precisely estimate the gain in cache hit ratio that can be obtained by adding a new server to each distributed caching layer. We estimate the possible gain in hit ratio due to the addition of a new server by running virtual caches. A virtual cache behaves like a real cache except that it stores only the metadata such as the list of objects in the cache, their sizes, and invalidation parameters. Objects themselves are not stored. By applying the same operations as a real cache, virtual caches can estimate the hit rate that would be offered by a real cache with the same configuration. Since a virtual cache stores only metadata, it requires relatively less memory. For example, to estimate the hit ratio of a cache that can hold millions of data items, the size of a virtual cache will be in the order of only a few megabytes. A virtual cache is usually run next to the real caches. When the resource configuration has no caches, virtual caches are run at the application server and database driver. Let us assume the storage capacity of each cache server is M objects. In addition to running the real cache, each cache server runs a virtual cache with a capacity of M + ∆ and logs its corresponding virtual cache hit ratio, number of cache hits and misses. The hit ratio of the virtual cache is what the server would have obtained if it had been given an extra ∆ storage for caching. Consider a scenario where the caching tier runs N cache servers and ∆ is set to M/N . Let hitsvc denote the total number of cache hits at the virtual caches and numreqs be the total number of requests received by the caching tier. Then, hitsvc /numreqs is the possible hit ratio the distributed cache would obtain when an extra M memory is added to it. This is equivalent to adding another server with memory M to the distributed cache. This estimation relies on the properties of consistent hashing: N servers
Estimating Qi
In general, the queueing latency, Qi for a tier Ti with n servers can be computed using Little’s law [24] as Qi = λi ∗ Ei /n, where λi is the arrival rate of requests to Ti and Ei is their mean execution time. Using this equation, the improvement in queueing latency of adding a new server can be easily estimated (assuming that the servers are homogeneous). The above equation assumes that the request workload is uniformly shared among different servers in a tier. While this assumption is true for caching and business logic tiers, it is not the case for the databases (tier 3). In replicated databases, an update query must be processed by all database replicas, while read queries are processed by only one replica. Let w denote the fraction of update queries and Edbwrites be the average execution time for database updates. Similarly, let Edbreads denote the average read execution time. Then, the average queueing latency at a data tier with n database replicas is given as: 6
each with capacity M + M/N have the same hit ratio as N + 1 servers with capacity M . The hit ratio of the virtual cache is used by the controller to compute the gain in response time due to the addition of another server to the distributed cache (using equation 3). Similarly, the possible increase in response time due to removal of a server from the distributed cache can be estimated by maintaining another virtual cache in each cache server with a M − ∆ storage capacity.
4.3
check if the observed response time is lower than the LowRespT ime threshold. If so, the service is probably overprovisioned. The controller can then use the same technique to release the least useful resources, provided it does not lead to an SLA violation.
4.4 Prototype Implementation We implemented a prototype resource-provisioning system for evaluation purposes. The prototype is targeted for provisioning Java-based Web services that transmit SOAP messages over HTTP. The prototype is based on Apache Jakarta Tomcat 4.1.31 running the Axis 1.5 SOAP engine, and MySQL MaxDB 5.0.19. In addition to these, we implemented our own service caches (server side and client side) and database cache in Java. A service cache is essentially a simple server that receives service requests in XML over HTTP. Each request is assigned a unique identifier, requestID, which is a concatenation of the method name and its parameters. For example, if a service getStockQuote() is invoked to find the quote of a stock id1234 then its requestID value is set to getStockQuote(id1234). Each request carries zero or more invalidationID fields which identify the service requests whose invocation would invalidate the cached response of the request. For instance, in the above example if the service getStockQuote() conflicts with updateStockQuote(), then its invalidationID must be set to updateStockQuote(id1234). We modified the Axis call object to add the fields requestID and invalidationID to each SOAP request. In our prototype, we require the application developer to explicitly set the requestID and invalidationID parameters for each request. This allows the cache servers to maintain the consistency of the cached service responses easily. We believe that such a requirement is not unrealistic, as usually application developers are well aware of the application’s consistency semantics. The implementation of server-side and client-side response caching tiers are similar. The only difference between the implementation of these two tiers is the point of integration into the Axis code base. For instance, the server-side caching logic intercepts the call before the actual service is invoked while the client-side service cache intercepts calls before requests are dispatched to the service. For database caching (T2b ), we used our in-house query caching system, GlobeCBC. GlobeCBC is implemented at the database driver level. For an in-depth overview of GlobeCBC and its performance, we refer interested readers to [23]. Database replication is implemented at the middleware level. We did not use the standard MySQL database cluster solution as it would require us to modify their code base to add the appropriate instrumentations for metric collection. Instead, database updates were serialized and scheduled from a single
Decision process
In general, a change in resource configuration can be triggered by periodic evaluations or when the system observes an increase in end-to-end response time beyond the HighRespT ime threshold set by the SLA. In such scenarios, the controller can use one or more servers from the rescue pool and add them to the service infrastructure to bring the response time back to the SLA interval. To do so, the controller must decide the best tier(s) to add the server(s). The controller obtains values of Ei , pi , and Ni,j for each tier from the metric measurement system. For caching tiers, it also obtains the estimated cache hit ratio for M + ∆ memory. With these values, the controller computes R0 values for the five different resource configurations that would be obtained when a server is added to one of the 5 tiers. Subsequently, it selects the configuration that offers the least end-to-end response time. This process is repeated until the response time falls within the acceptable interval or until the rescue pool is exhausted. In multi-tiered systems, the software components at each tier have limits on the number of concurrent requests they can handle. For example, the Tomcat servlet engine uses a configurable parameter to limit the number of concurrent threads or processes that are spawned to service requests. This limit prevents the resident memory of the software from growing beyond the available RAM and prevents thrashing. Requests beyond this limit are dropped by the server. A provisioning system must therefore ensure that the servers in each tier of a chosen resource configuration will be handling requests well within their concurrency limit. This additional requirement can be handled by a simple refinement to the decision process. For a given resource configuration, in addition to estimating its response time the model can also estimate the request rate at each tier, λi (using Equation 1). Subsequently, while selecting a resource configuration, we must ensure that the following two conditions are met: (i) the selected configuration meets the SLA with minimum number of resources and (ii) λi of each tier is less than its concurrency limit. Continuous addition of servers without appropriate scaling down (over time) can lead to resource overprovisioning, thereby increasing operational costs of the system. To avoid this, the controller must periodically 7
server. An update is applied only if it is successful at all replicas, else it is rolled back. Database reads are scheduled to replicas in a round-robin fashion. In addition to the implementation of caching tiers, we instrumented the Jakarta Tomcat server and the caching tiers to log their execution times. These data are periodically collected by a monitor program and fed to a machine that runs the controller. The controller collects data from different tiers and constantly checks if the service’s SLA is violated. If so, it decides on and triggers a change to the resource configuration based on the most recent data fed from different tiers. As depicted in Figure 1(b), load balancers are responsible for distributing the load among application servers uniformly. In our experiment, we did not use any hardware load balancers but rather built a softwarelevel request dispatcher that dispatches requests among application servers using a randomized round-robin algorithm. This allowed us to plug this component into the caches and service clients. The hash function and the membership table that describes the portion of object space covered by each cache server is essential for routing requests to them. In our experiments, this information was replicated at all cache clients. To notify other tiers regarding the addition/removal of servers in a tier, each tier implements an abstract method changeResCf g(RoutingInf o) and exposes it as a Web service. The controller invokes this method to notify the servers in a tier when the resource configuration of the tiers called by them is changed.
5
Response Time vs. Req. Rates 1 C-2 AS-1 DB
Requests/sec
160
4 AS-1 DB
1 C-2 AS-1 DB Adaptive Strawman
80 3 AS-1 DB
1 AS-1 DB
40
0
50
100
150
Response Time (ms)
Figure 2: Performance of the Page Generator Service
5.1
Page generator service
A single request to an e-commerce Web site (like Amazon.com) often results in hundreds of service calls whose responses are aggregated by a front-end service to deliver the final HTML page to the clients [27]. In this experiment, we compared the two resource-provisioning approaches for such a page generator service. We implemented a page generator service that, upon receipt of one client request, sends out requests to many other services and aggregates their responses. Emulating a page generator service of the scale of a large Web site requires us to run hundreds of other services. To reduce the experimentation complexity, we devised the page generator service as follows: Each request to the service triggers requests to two types of services. The first one is a customer detail service which returns customer information (first name, last name) based on a client identifier contained in the request. The second type of service is called a simple service, which is implemented as a TCP/IP socket server and returns the same XML response to all requests. By returning the same XML response to all requests, the simple service avoids the overhead of XML processing and hence does not become a bottleneck. In our experiments, the page generator service invokes one request to a customer detail service and separate requests to five different instances of the simple service. It then aggregates all the XML responses using XSL transformation, which is a CPU intensive operation. The customer identifiers in the request were generated according to a Zipf distribution with α = 0.4 from a sample of 1 million customer identifiers. Similar values were observed on a measurement study profiling the workload of a shopping Web site [2]. The SLA of the service is arbitrarily set to [50, 300]ms. In our experiments, we studied the response times for the resource configurations recommended by both provisioning systems for different request rates. The resulting configurations and their response times are shown in Figure 2. For all request rates the adaptive resource provisioning yields lower or equal response time than
Performance Evaluation
In this section, we determine the effectiveness of our resource-provisioning approach in identifying the right configuration for different kinds of services and workloads. To this end, we evaluate the performance of our prototype for four different services: a page generator service, a customer personalization service, the TPCApp and RUBBoS benchmarks. These services are chosen to represent applications with different characteristics: a compute-intensive service, a data-intensive service, a business-to-business application encompassing several business interactions and a bulletin-board Web application. All the experiments were performed on dual processor Pentium III 900Mhz machines with 2GB memory running the Linux 2.4 kernel. We compare the performance of our approach (which we call adaptive) against a strawman approach. The strawman approach adds or removes a server to the tier which is observed to have the highest bottleneck (measured in terms of the average CPU utilization of each server). This approach does not examine the temporal locality of request patterns. It is straightforward, and also widely used as it allows to provision resources independently across each tier [20, 21]. 8
to find the list of product identifiers to which a customer has shown prior interest. Second, it queries the item table to generate the list of items related to these products and their information. This service is mostly data intensive. In our experiments, the item table was populated with 20 million randomly generated database records and the customer table was populated with 10 million records. We expect that such volumes of data are representative of a real-world application. The related items field of each record in the item table were populated randomly. The popularity of items among customers follows a Zipf distribution with α = 1 (as shown in the analysis of a major e-commerce site [2]). For each type of query made by the business logic, the appropriate query indices are created, which is a usual performance optimization technique used by enterprise database administrators. The client identifiers for each request were chosen randomly. The SLA of the service is set to [50,200]ms.6 Figure 3 shows the performance of both provisioning approaches for different request rates. For all request rates, the adaptive approach is able to obtain lower or equal latencies using the same number of servers. When the request rate for the service is increased from 90 req/sec to 200, the strawman approach simply looks at the tier with the highest load (which is the application server as it incurs XML parsing overhead) and adds 3 more servers. However, the bottleneck quickly turns out to be the database and hence the service fails to meet its SLA for a load of 300 requests/sec. In contrast, the adaptive approach collects information from different tiers regarding their execution times and hit ratios. In particular, the virtual database cache detected a high temporal locality among database queries and predicted a cache hit ratio of 62.5% with addition of one database cache server. On the other hand, the hit ratio of the virtual cache at tier T0 was under 1% as the generated XML responses are different for each client. Using these values, the adaptive controller derived a configuration that reduces both the bottleneck at the business logic tier (by creating more instances of the application server) and at the database tier (by creating an instance of the database cache server). In this experiment, the error margin in mean response time estimations derived by the model were 3%, 6% and 9.5% for 90, 200 and 300 req/sec load respectively. With these two experiments, we can draw the (preliminary) conclusion that for efficient resource provisioning we must: (i) optimize the end-to-end latency of the complete system and not just alleviate the bottleneck at individual tiers; and (ii) take into account the temporal properties of the request workload to derive accurate estimations of the impact of provisioning additional resources for different caching tiers. Furthermore, we can also see that model has a high accuracy in deriving its response
Response Time vs. Req. Rates 5 AS-1 DBC- 1 DB
Requests/sec
300
6 AS-1 DB
5 AS-1 DBC- 1 DB
Adaptive Strawman
200 6 AS-1 DB
3 AS-1 DB
90
0
100
200
300
400
Response Time (ms)
Figure 3: Performance for the promotional service the strawman approach. In particular, for 160 req/sec, the adaptive provisioning is able to deliver better performance than the strawman approach while using less servers. This is primarily due to the fact that our approach accounts for and analyzes the temporal locality of the request workload. This enables the system to recommend adding a server-side service cache server rather than adding another application server. In our experiments, the hit ratio of the service cache is around 23% which significantly relieves the other tiers. In our experiments, we observed that the difference between the estimated response time derived from the model and the observed values were less than 7% of the latter. It must be pointed out that since the primary differences between different customer responses arise from the customer service, in theory one could also install caches at tier T2a with excellent hit rates. However, as confirmed by the model, running cache servers at tier T0 is better as the benefit of a cache hit is higher. On the other hand, the strawman approach observes that the application servers do the most load intensive task and addresses the bottleneck by adding more instances of the application server. This will only reduce the queueing latency by reducing the load imparted on each server. On the other hand, by introducing caching servers the adaptive provisioning also avoids execution latency (in addition to the queueing latency) incurred at subsequent tiers.
5.2
Promotional service
The second service we experimented with is a promotional service modeled after the “Recommended for you ” service in Amazon.com. This service recommends products based on the user’s previous activity. It maintains two database tables: (i) the item table contains details about each product (title, author, price, stock) and also identifiers of other items related to it; (ii) the customer table contains information regarding customers and the list of previous items bought by each customer. The business logic of this service executes two steps to generate a response. First, it queries the customer table
6 Once again, the SLA values are chosen arbitrarily. The SLA values only impact the decision regarding when to make a change in resource configuration and do not affect the performance of a running service.
9
Average Response Time (ms)
700
600
servlet. The services were not implemented as Web services and the interaction between clients and services were not done using the SOAP protocol. To make this implementation conform to the TPC App benchmark, we ported it to the Jakarta Tomcat and Axis SOAP engine environment. We wrapped each service interaction into a Web service and the client EBs were modified appropriately. In our experiments, we filled the customer database with 288, 000 customer records. The other tables are scaled accordingly in conformance with the benchmark regulations. The EBs issue requests to the application according to the mix workload with an average sleep time of 5 seconds. Contrary to the benchmark requirements, however, we do not guarantee ACID consistency as the database caches and service caches perform asynchronous invalidations.
SLA (HighRespTime)
500
Change in Resource Configuration
400
300
200 1AS-1DBC-2DB 100 1AS-1DB
1AS-1DBC-1DB
0 0
50 100 150 200 250 300 350 400 450 500 Number of EBs
Figure 4: Performance for TPC-App benchmark time estimations thereby allowing us to derive the right resource configuration for different workloads. In our subsequent experiments, we conduct an in-depth study of the performance of our resource provisioning system alone.
5.3
We measured the response time of different resource configurations recommended by our system for different number of EBs. The SLA of the application is arbitrarily set to [50, 300] ms as no standard values are recommended in the benchmark specifications. Changes in resource configuration are triggered whenever the running average of the response time fails to meet the SLA. Again, in this experiment, the model does a reasonable job in predicting the response time and the error margin is less than 10%. We do not discuss them in detail for compact exposition. As can be seen in Figure 4, the resource configuration of the benchmark varies as the load increases. During low loads, a resource configuration with a single application server and one DBMS is sufficient for the system to meet its SLA. However, as expected, the response time increases with increase in client load. When the number of EBs grows beyond 90, the application fails to meet its SLA. Under such loads, the provisioning system diagnoses the underlying DBMS to be the bottleneck. Indeed, offline analysis confirms this observation as each service invocation to TPC-App leads to an average of 5.5 queries to the underlying database. Under this scenario, the virtual cache that is profiling the hit ratio of a database cache predicts a hit ratio of 52% which leads to a recommendation of adding a database cache to the resource configuration. As seen in Figure 4, this configuration keeps the end-to-end latency within its SLA until 300 EBs, beyond which the significant number of database query cache misses make the DBMS the bottleneck again. Under this scenario, the model recommends the addition of a DBMS instance. Note that in contrast to the addition of (service/database) caches or application servers, the dynamic addition of a DBMS instance is harder as it requires copying the entire database on the fly while processing updates without loss of consistency. In our experiments, we did not perform this online but the experiment setup was shutdown and a database replica was created and synchronized offline. We then measured the response time of this configura-
TPC-App: SOA benchmark
TPC-App is the latest Web services benchmark from the Transactions Processing Council.7 It models an online shopping site like Amazon.com and performs business functionalities such as providing product details, order management and tracking, customer management, and shipment tracking and management. In contrast to its predecessor TPC-W8 , the interactions between the application and its clients are done through SOAP-based Web service interactions. The benchmark mandates the application to expose the following service interactions: change item, product detail, order status, new products, change payment method, new customer, and create order. The benchmark requires the clients to be implemented as Emulated Browsers (EBs) and to add some think time between subsequent requests. In our experiments, we used the mix workload recommended by the benchmark under which the workload received by each service interaction is split as follows: New Customer (1%), Change Payment (5%), Create Order (50%), Order Status (5%), New Products (7%), Product Detail (30%), Change Item (2%). The application uses 8 database tables that respectively store information on authors, customers, addresses, country, items, orders, orderlines, and stock. Even though the benchmark defines multiple service interactions they all share the same database, thereby effectively making it a single service (according to our application model definition). We built our experiments upon the open source implementation of TPC-App.9 However, this OSDL implementation implements the business logic as a Java-based 7 http://www.tpc.org/tpc
app/default.asp ex.asp 9 http://www.sourceforge.net/projects/osdldbt
8 http://www.tpc.org/tpcw/tpcw
10
300
drop by almost an order of magnitude, which is consistent with a hit ratio of 90%. This also allows the resource configuration to sustain a much higher load. Interestingly, even though the response time is well within its SLA, the T0 ’s cache concurrency limit is reached when the number of EBs is increased to 1100 EBs. Under this load, the T0 cache starts dropping many incoming requests. At this point, the system recommends addition of another T0 cache to keep the request rate well within the concurrency limits of the cache.
250
Average Response Time (ms)
Change in resource config. due to SLA violation. 200
Change in res. config. due to concurrency limit
HighRespTime 150
100
1AS-1DB 2C-1AS-1DB
50 1C-1AS-1DB
6
0 0
200
400
600
800
Number of EBs
6.1 Performance of Reactive Provisioning
Figure 5: Resource configurations and response times of RUBBoS benchmark for different loads.
A key issue in the design of any dynamic resource provisioning system is how reactive the provisioning system is bringing the system behavior back to its SLA when the workload changes. The time to get the system back to its SLA depends on three factors: (i) the time taken to make a decision on the best resource configuration, (ii) the time taken to make the resource changes, and (iii) the time taken for the new resource configuration to warm up. In our system, the controller is constantly fed with performance metrics so making a decision on the changes in resource configuration is purely a local constant time computation. The time incurred due to the second issue heavily depends on the availability of resources and if the software systems in different tiers are “designed” to be dynamically provisioned. If enough resources are available in the rescue pool, then dynamic provisioning of software systems in each tier is the main issue. By the virtue of virtualization, we believe caching systems and application servers can be installed on a new server instantly. For instance, dynamically creating instances of a Java-based application is now relatively well understood and even industry-standard application servers such as WebSphere allow the dynamic creation of application instances [18]. However, dynamic creation of a replica at the database tier is more difficult, especially for RDBMSs. This is because creating a replica of a relational database while the service is running requires copying the entire database without affecting the database performance and ensuring that all updates made on the original database during the process of copying are executed consistently on the final replica. These issues are beginning to be addressed (see e.g., [8]). However, current techniques are by no means highly reactive. We acknowledge that this remains very much an open research issue. Once the resource configuration has been put in place, the new configuration does incur some “warm-up” overhead. This can be due to the initialization of connection pools, thread pools or cache warmups. While connection and thread pool initialization are not specific to the running service, cache warmup times heavily depend on the
tion. We discuss the issue of dynamic provisioning of servers in Section 6.
5.4
Discussion
1000 1200 1400
RUBBoS Benchmark
Finally, we studied the resource configurations and response times obtained by our provisioning approach for the RUBBoS benchmark, a bulletin board application that models slashdot.org. In contrast to all previous studied applications, the RUBBoS application models a Web site and not a Web service, i.e., it does not use SOAP to interact with its clients. The main reason for studying this benchmark is to demonstrate the applicability of our approach to a wide variety of multi-tiered applications. RUBBoS’s database consists of five tables, storing information regarding users, stories, comments, submissions, and moderator activities. We filled the database with information on 500, 000 users and 200, 000 comments. Our experiments were performed with the browse only workload mix. The average think time between subsequent requests of a client session was set to 6 seconds. For our experiments, we chose the open source implementation of these benchmarks10 . The SLA of the Web site was arbitrarily fixed to [10,150] ms. Figure 5 presents the response times of the benchmark that runs a single application server and a backend database. As expected, the response time increases as the number of client EBs increases and when we reach beyond 700 EBs, the SLA is violated. The virtual cache (corresponding to T0 ) running at the application server predicts a hit ratio of 91%. The high hit ratio can be explained by the fact that for a news Web site like Slashdot, many readers exhibit the same browsing patterns such as viewing the abstracts of the top stories of the day, details of the top stories. This observation leads the controller to recommend the addition of a server at T0 , i.e., an HTML cache. The addition of a HTML cache makes the latency 10 http://jmob.objectweb.org/rubbos.html
11
0.3%. An important point to be noted here is that a history window of 2 hours seems to be reactive enough to capture the “time-of-the-day” effects. As a next step, we wanted to see the effect of flash crowds on a system that runs an optimal virtual cache predictor. To this end, we examined the requests during the flash crowd and plotted the hit ratio prediction error during this period. The size of the history window is set to 2 hours which was determined to be optimal during stable load scenarios. The results of our experiment are given in Figure 6(c). The prediction error turns out to be lower than 0.5% during stable loads and raises to 8% during flash crowds. Needless to say, this implies that predictions made during the flash-crowd event are inaccurate. The reason is that flash crowds for static Web sites are characterized by sudden and huge increase in request rate for a small number of Web objects. This leads to a sudden increase in hit ratio (a similar observation was made in [13]). However, the sudden increase in hit ratio leads to inaccurate predictions. Note that flash crowds need not always lead to improved cache hit ratio. For instance, a flash crowd on a customer service might result in lower locality as the response generated for each customer will be different. As of now, we do not have any precise mechanisms to handle predictions during flash crowds. We speculate that adaptations to be performed during flash crowds might require mechanisms of different nature such as enhanced admission control, and reduced consistency requirements. This means that the system would operate in an “emergency mode” during this period. It is to be expected that the system should not use the measurements collected during this mode to decide on its adaptations during normal operations.
service and workload. Cache warmup time is the time incurred before the hit ratio of a cache stabilizes. It of course heavily influences the time incurred by the system to fall back to its SLA as the virtual cache predicts the hit ratio of a “warmed-up” cache. Cache warmup times heavily depend on the workload’s request rate and temporal locality. To give an example of a typical cache warmup time, we plotted the running average of the response time for the TPC-App benchmark before and after the addition of a database cache (for the first change in resource configuration shown in Figure 4). As shown in Figure 6(a), the response time of the system decreases immediately after adding a database cache server. In our experiment, the time taken for the response time to stabilize was under 2 minutes. We believe that virtualization allows us to dynamically provision different tiers with considerable ease (as observed in [9]). However, dynamically provisioning databases still remains a major obstacle. This leads us to conclude that, for the time being, the best option is to perform a pessimistic provisioning of the database tier.
6.2
Predictability of Cache Hit Rates
A key building block of the provisioning system is the use of a virtual cache for predicting the effectiveness of caching techniques at different tiers. For accurate predictions, the hit ratios must be measured only over a relatively large time window. A small window size will make the prediction mechanism susceptible to errors due to small load bursts and cache warmup effects. On the other hand, a large window size will make the system unreactive to detect changes in temporal locality. To study the impact of window size on prediction accuracy, we examined the access logs of a Web site that experienced flash crowds due to its posting on the Google home page and subsequently on Slashdot the next day.11 The trace contains all requests received by the server over a period of two months. In our first experiment, we measured the impact of the window size on the quality of the hit ratio prediction during the first month when there was no flash crowd. The cache size was set to 0.1% of the total number of unique Web objects. In our experiment, a prediction was made every sampling interval. The frequency of sampling was set to 10% of the window length. Figure 6(b) plots the impact of window sizes on the mean prediction error. The hit ratio prediction error is the absolute difference between the hit ratio predicted for a given time period and the actual value observed for the time period. The lower the value, the higher is the prediction accuracy. As seen, the optimal window length for these traces is around 2 hours, which gives the best prediction accuracy with a prediction error lower than
6.3
Modelling variances and percentiles
In Section 3, we modelled the system as a Jackson queueing network. This model has the appealing feature that the network acts as if each tier can be viewed independently of the other tiers. This makes a mean-value analysis effective so that performance measures that deal with averages can be easily obtained. However, it does not allow us to derive other measures such as variance and percentiles. Under some reasonable assumptions, it is possible to obtain tight bounds for these performance measures. In our other work, we have derived expressions for variances in end-to-end response times and demonstrated that our derivations are reasonably accurate in modelling real world applications. However, these derivations and their validations fall outside the scope of this paper. We refer interested readers to [5].
6.4 Availability-based Provisioning The model so far assumes that servers do not fail. This is of course unrealistic as server failures lead to loss of
11 http://local.wasp.uwa.edu.au/∼pbourke/
fractals/quatjulia/google.html
12
500
1.2
8
7 1
400
200
0.8
Prediction Error (%)
300
Mean Prediction Error (%)
Observed Response Time (ms)
6
Transition Point
0.6
0.4
5
4
3
2 100
0.2 1
(2 minutes) 0 0
0 Timeline
(a)
2
4
6
8
10
12
Window (hours)
(b)
14
16
18
0 Timeline
(c)
Figure 6: (a) Observed response time during a change in the resource configuration: From a single application server and database to a configuration with an application server, database cache and a database. (b) Impact of window size on hit ratio prediction error and (c) Plot of the hit ratio prediction error of the fractals Web site during the flash crowds processing capacity (thereby leading to high response times) and sometimes even system outages. In that case, it is imperative to base provisioning decisions not just on end-to-end response time but also on availability requirements. Note that, availability is a fundamentally different performance measure than the end-to-end latency. When the software system has a tree structure, such as depicted in Figure 1(b), the total system availability is dominated by the tier with the smallest availability measure. Hence, the availability measure turns out to be a local performance measure. Therefore, to achieve endto-end availability of the system it is enough to optimize the availability of each tier independently. This leads us to conclude that to achieve both performance and availability SLAs, one can provision based on end-to-end performance and subsequently add redundancy at each tier to achieve a desired level of availability.
7
Our problem is closely related to capacity provisioning and has been well studied in the context of singletiered applications [10, 17]. A simple transposition of these techniques to our problem is, however, not suitable as database, business logic, and service caches have very different characteristics. Hence, it is imperative to treat each individual tier as a separate entity. In a recent study [25], the problem of provisioning a 3tier web site using multi-queueing models has been addressed. Unfortunately, the study is entirely based on multi-queueing models and therefore cannot take into account any caching techniques (such as client/server-side service caching or database caching). This is a very limiting restriction as caching is one of the widely used techniques used in boosting the performance of a service.
Related Work
8
A vast number of solutions have been proposed for improving the performance of Web applications. Systems such as [7] cache application responses in HTML or XML. These techniques (that correspond to T0 in the generalized hosting architecture given in Figure 1(b)) improve the throughput of the service as a cache hit in this tier offloads the complete application from serving the request. Systems such as ACDN [20] and Autoglobe [21] aim at scalable hosting of Web applications by replicating/migrating the application code across different servers. Database replication middlewares [15, 19, 22] aim at alleviating the database bottleneck by replicating the entire database. Database caching middlewares [1, 6, 23] aim to alleviate the database bottleneck by caching database query responses. All these techniques are studied independently and aim to address bottlenecks at different tiers of a service. As shown in our evaluations, for effective hosting of Internet services one should optimize the end-to-end performance of a tier instead of optimizing individual tiers.
Conclusions and Open Issues
In this paper, we presented a novel approach to resource provisioning of multi-tier Internet services. In contrast to previous works, our approach selects the resource configuration based on its end-to-end performance instead of optimizing each tier individually. Our proposed approach employs a combination of queueing models and on-line cache simulations and is capable of analyzing the impact of temporal properties of the workload on the end-to-end response time. We demonstrated through extensive experimentations the effectiveness of our approach in achieving the best resource configuration for different applications and industry standard benchmarks. Compared to the strawman approach, our approach maintains the SLA of a service with less number of servers. Even though this work primarily focusses on maintaining average latencies in an environment with no server failures, we discussed how our model can be refined to take latency percentiles and server failures into account in the provisioning decision. 13
References
[16] J. Kubiatowicz, D. Bindel, Y. Chen, S. Czerwinski, P. Eaton, D. Geels, R. Gummadi, S. Rhea, H. Weatherspoon, C. Wells, and B. Zhao. Oceanstore: an architecture for global-scale persistent storage. In Proc. 9th Intl. Conf. on Architectural Support for Programming Languages and Operating Systems, pages 190–201, 2000.
[1] K. Amiri, S. Park, R. Tewari, and S. Padmanabhan. DBProxy: a dynamic data cache for web applications. In Proc. Intl. Conf. on Data Engineering, pages 821–831, 2003. [2] M. Arlitt, D. Krishnamurthy, and J. Rolia. Characterizing the scalability of a large web-based shopping system. ACM Transactions on Internet Technology, 1(1):44–69, 2001.
[17] D. A. Menasce. Web server software architectures. IEEE Internet Computing, 7(6):78–81, 2003. [18] V. K. Naik, S. Sivasubramanian, and S. Krishnan. Adaptive resource sharing in a web services environment. In Proc. 5th ACM/IFIP/USENIX Intl. Conf. on Middleware, pages 311–330, 2004.
[3] L. Barroso, J. Dean, and U. Hlzle. Web search for a planet: The Google cluster architecture. IEEE Micro, 23(2):22–28, Mar 2003.
[19] C. Plattner and G. Alonso. Ganymed: Scalable replication for transactional web applications. In Proc. 5th ACM/IFIP/USENIX Intl. Conf. on Middleware, Toronto, Canada, Oct. 2004.
[4] F. Baskett, K. M. Chandy, R. R. Muntz, and F. G. Palacios. Open, closed, and mixed networks of queues with different classes of customers. Journal of the ACM, 22(2):248–260, 1975.
[20] M. Rabinovich, Z. Xiao, and A. Agarwal. Computing on the edge: A platform for replicating internet applications. In Proc. 8th Intl. Workshop on Web Content Caching and Distribution, pages 57–77, Hawthorne, NY, USA, Sept. 2003.
[5] S. Bhulai, S. Sivasubramanian, R. van der Mei, and M. van Steen. Modeling end-to-end response times in multi-tier internet applications. Technical Report WS2006-5, Vrije Universiteit, Amsterdam, The Netherlands, June 2006. http://www.few.vu.nl/ ∼sbhulai/papers/WS2006-5.html.
[21] S. Seltzsam, D. Gmach, S. Krompass, and A. Kemper. Autoglobe: An automatic administration concept for service-oriented database applications. In Proc. 22nd Intl. Conf. on Data Engineering, 2006.
[6] C. Bornhvd, M. Altinel, C. Mohan, H. Pirahesh, and B. Reinwald. Adaptive database caching with DBCache. Data Engineering, 27(2):11–18, June 2004.
[22] S. Sivasubramanian, G. Alonso, G. Pierre, and M. van Steen. GlobeDB: Autonomic data replication for web applications. In Proc. 14th Intl. Conf. on World-Wide Web, pages 33–42, Chiba, Japan, May 2005.
[7] J. Challenger, P. Dantzig, A. Iyengar, and K. Witting. A fragment-based approach for efficiently creating dynamic web content. ACM Transactions on Internet Technologies, 5(2):359–389, 2005.
[23] S. Sivasubramanian, G. Pierre, M. van Steen, and G. Alonso. GlobeCBC: Content-blind result caching for dynamic web applications. Technical Report IR-CS022, Vrije Universiteit, Amsterdam, The Netherlands, June 2006. http://www.globule.org/publi/ GCBRCDWA ircs022.html.
[8] J. Chen, G. Soundararajan, and C. Amza. Autonomic provisioning of backend databases in dynamic content web servers. In Proc. Intl Conf. on Autonomic Computing, 2006. [9] C. Clark, K. Fraser, S. Hand, J. G. Hansen, E. Jul, C. Limpach, I. Pratt, and A. Warfield. Live migration of virtual machines. In Proc. NSDI Symposium, May 2005.
[24] K. S. Trivedi. Probability and statistics with reliability, queuing and computer science applications. John Wiley and Sons Ltd., Chichester, UK, UK, 2002.
[10] R. Doyle, J. Chase, O. Asad, W. Jin, and A. Vahdat. Web server software architectures. In Proc. USENIX Symposium on Internet Technologies and Systems, 2003.
[25] B. Urgaonkar, G. Pacifici, P. Shenoy, M. Spreitzer, and A. Tantawi. An analytical model for multi-tier internet services and its applications. In Proc. SIGMETRICS Intl. Conf., pages 291–302, 2005.
[11] S. Ghemawat, H. Gobioff, and S.-T. Leung. The google file system. In Proc. SOSP, pages 29–43, 2003.
[26] D. Villela, P. Pradhan, and D. Rubenstein. Provisioning servers in the application tier for e-commerce systems. In Proc. 12th IEEE Intl. Workshop on Quality of Service, June 2004.
[12] J. Jackson. Networks of waiting lines. Operations Research, 5:518–521, 1957. [13] J. Jung, B. Krishnamurthy, and M. Rabinovich. Flash crowds and denial of service attacks: characterization and implications for cdns and web sites. In Proc. Intl. Conf. on World Wide Web, pages 293–304, 2002.
[27] W. Vogels. Learning from the amazon technology platform. ACM Queue, 4(4), 2006.
[14] D. Karger, A. Sherman, A. Berkheimer, B. Bogstad, R. Dhanidina, K. Iwamoto, B. Kim, L. Matkins, and Y. Yerushalmi. Web caching with consistent hashing. In Proc. 8th Intl. Conf. on World Wide Web, pages 1203– 1213, 1999. [15] B. Kemme and G. Alonso. A suite of database replication protocols based on group communication primitives. In Proc. ICDCS, Washington, DC, USA, 1998.
14