This paper is concerned with resource allocation strategies that are rele- vant to autonomic resource management. The two-level resource management archi-.
Resource Provisioning for Cloud Computing Ye Hu1, Johnny Wong1, Gabriel Iszlai2 and Marin Litoiu3 1
University of Waterloo, 2IBM Toronto Lab, 3York University
Abstract In resource provisioning for cloud computing, an important issue is how resources may be allocated to an application mix such that the service level agreements (SLAs) of all applications are met. A performance model with two interactive job classes is used to determine the smallest number of servers required to meet the SLAs of both classes. For each class, the SLA is specified by the relationship: Prob [response time ≤ x] ≥ y. Two server allocation strategies are considered: shared allocation (SA) and dedicated allocation (DA). For the case of FCFS scheduling, analytic results for response time distribution are used to develop a heuristic algorithm that determines an allocation strategy (SA or DA) that requires the smallest number of servers. The effectiveness of this algorithm is evaluated over a range of operating conditions. The performance of SA with nonFCFS scheduling is also investigated. Among the scheduling disciplines considered, a new discipline called probability dependent priority is found to have the best performance in terms of requiring the smallest number of servers.
1 Introduction To meet the increasing demand for computing resources, the size and complexity of today’s data centers are growing rapidly. At the same time, cloud computing infrastructures are becoming more popular. An immediate question is how the Copyright © 2009 Ye Hu, Johnny Wong, Marin Litoiu and IBM Canada Ltd. Permission to copy is hereby granted provided the original copyright notice is reproduced in copies made.
resources in a cloud computing infrastructure may be managed in a cost-effective manner. Static resource allocation based on peak demand is not cost-effective because of poor resource utilization during off-peak periods. In contrast, autonomic resource management could lead to efficient resource utilization and fast response in the presence changing workloads. This paper is concerned with resource allocation strategies that are relevant to autonomic resource management. The two-level resource management architecture presented in [1] provides a framework for our investigation. At the lower level, there are multiple application environments (AEs). Each AE consists of a set of computing resources that are shared by one or more applications. At the higher level, a global arbiter performs resource allocation across AEs. In this paper, we consider the processing of interactive jobs only. These jobs generally have small processing requirements and require good response time performance. The SLAs under consideration are based on the probability distribution of response time, namely, Prob [response time ≤ x] ≥ y where x is a threshold value and y is the target probability. Our approach is to use performance models to obtain results that can be used to guide resource allocation decisions. In our investigation, the computing resources at each AE are modeled by servers. When the global arbiter makes resource allocation decisions, information on the number of servers that should be allocated to each AE would be very helpful. This corresponds to the smallest number of servers required to meet the SLAs of all applications that are assigned to the AE. Jobs processed by an AE are classified according to their workloads and SLAs. One or more applications may be included in the same class. The number of servers required is affected
101
by the resource allocation strategy and job scheduling discipline within the AE. The allocation strategies under consideration are shared allocation (SA) and dedicated allocation (DA). In SA, the servers are shared by all job classes. DA, on the other hand, allocates to each job class a fixed number of servers; these servers are not available to the other classes. As to job scheduling, the disciplines considered include first-come first-served (FCFS) and two priority disciplines where job classes with more demanding SLAs are given higher priority. In [2], a multi-server queueing model was used to show that SA is superior to DA with respect to mean response time over all jobs. However, the issue of SLA was not included in the investigation. When SLAs are considered, SA may not be the better strategy under all operating conditions. In general, a cloud computing infrastructure [3, 4] may provide service to a large number of job classes. Results on the performance difference between SA and DA for an arbitrary number of classes are difficult to obtain. This is because of the potentially large number of possible allocation strategies that need to be evaluated. Additional complexity is introduced when the impact of scheduling discipline is included in the investigation. To keep the complexity at a manageable level, we consider the special case of two job classes. In spite of this simplification, our results are directly applicable when the global arbiter, taking into consideration issues such as application isolation, management and security, decides to use a divide-and-conquer approach in which an AE contains at most two job classes. In addition, our results provide valuable insights into the performance of alternative resource allocation strategies and job scheduling disciplines, and can be used to develop heuristic methods for resource allocation when more than two classes are assigned to an AE [5]. Our investigation includes (i) a comparative evaluation of SA and DA under FCFS scheduling; (ii) a heuristic algorithm that determines a resource allocation strategy (SA or DA) that results in the smallest number of servers required to meet the SLA of both classes; and (iii) a comparative evaluation of FCFS, head-of-the-line priority (HOL) [2] and a new scheduling discipline called probability dependent priority (PDP). The remainder of this paper is organized as follows. Our performance model is described in
102
Section 2. Section 3 presents results on the merits of SA and DA under FCFS. A heuristic algorithm to select the preferred resource allocation strategy under FCFS is also developed and evaluated. The impact of priority scheduling on performance is investigated in Section 4. Related work is discussed in Section 5. Finally, Section 6 contains some concluding remarks.
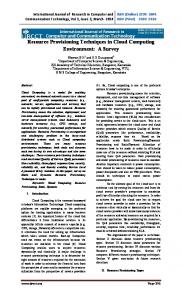
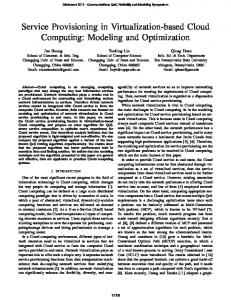
2 Performance Model In our performance model, computing resources at each AE are modeled by servers. There are two job classes; each has its own workload and SLA. With two job classes, the number of AEs is either 1 or 2 and the corresponding resource allocation strategies are SA or DA. Our models for SA and DA are shown in Figures 1 and 2. For SA, job arrivals from the two classes are combined into a single stream and served by a pool of m servers. For DA, each job class has its own dedicated pool of servers, and we use m1 and m2 to denote to number of servers allocated to class 1 and class 2, respectively. We assume that for class i (i = 1, 2), the job arrival process is Poisson with rate and the service time distribution of both classes is exponential with mean 1/μ . As mentioned earlier, the SLA is based on the relationship Prob [response time ≤ x] ≥ y. We use SLA(x, y) to denote such an SLA. We assume that for DA, jobs are processed in FCFS order. A number of scheduling disciplines are considered for SA, namely FCFS, HOL, and PDP.
AE
Figure 1: Shared Allocation
1 and increases m until the target probability y is achieved. Let SLAi be the SLA of class i (i can be obtained by setting the arrival = 1, 2). rate to , the service rate to µ, and SLA , to SLAi. Let be the smallest number of servers required under DA to meet the SLA of both is given by: classes.
AE1
AE2
(2) Algorithm 1 Input: Figure 2: Dedicated Allocation
// Arrival rate // Service rate //Service level agreement // Minimum number of Servers required
SLA , Output:
3 Resource Provisioning 3.1 Analytic Results for FCFS Under DA, the model for each job class can be viewed as an M/M/m model with FCFS scheduling. The same model is also applicable when FCFS is used in SA. For this model, analytic results for the response time distribution are available in [6]. Let F(x) be the cumulative distribution function (CDF) of response time, i.e., F(x) = Prob [response time ≤ x]. In [6], it was shown that: 0 ∑
1
!
1
!
where
0
∑
!
(1)
!
is the probability that the system is empty, ⁄μ is the traffic intensity, and λ and µ are the arrival rate and service rate, respectively. Note that m > , otherwise the system does not have sufficient capacity to handle the load.
3.2 Allocation Strategies Consider first DA. The results in Equation (1) can be used to determine and , the smallest number of servers required to meet the SLA of (i = 1, 2), class 1 and class 2, respectively. For the value of in Equation (1) is given by ⁄μ. An algorithm that determines the smallest number of servers required is included as Algorithm 1 below. This algorithm starts with
1: 2: 3:
⁄μ
1
, m++
while return
Consider next SA. Under FCFS, the CDF of response time can be obtained by extending the work in [7] to the case of multiple servers. The resulting CDF is the same as that for the M/M/m – , FCFS model with arrival rate equal to i.e., the aggregated rate of the two classes. Furthermore, both classes have the same CDF of response time which is given by Equation (1) with ⁄μ. Let be the smallest number of servers 1, 2 . required under SA to meet can be obtained from Algorithm 1 by setting the , the service rate to µ, and arrival rate to , the smallest number of SLA , to SLAi. servers required to meet the SLA of both classes, is then given by: max
,
(3)
3.3 SA and DA Comparison In this section, we use numerical examples to evaluate the performance difference of DA and SA under FCFS scheduling. The input parameters considered are shown in Table 1, where is the arrival rate of class i, and and are parameters , representing the response time threshold of and target probability, respectively. We restrict and such that the values of 40. We feel that this represents a sufficiently wide range of workload. The service rate is set to 1.
103
0.1, 0.2, … , 40.0 2.0, 2.5, 3.0, 3.5, 4.0, 4.5, 5.0 0.8, 0.85, 0.9, 0.96 Table 1: Parameter values Our evaluation is based on the total number of servers required to meet the SLA of both and in Equations (2) classes, as given by and (3), respectively. For each combination of , and (i = 1, 2), SA (or DA) is superior if (or ). Our results show that when both classes have the same SLA, SA always performs better than, or has the same performance and are difas, DA. However, when ferent, neither SA nor DA is superior for all combinations of parameter values. For example, the results for the two cases shown in Table 2 indicate that DA is superior for case 1, but SA is superior for case 2. Case 1 2
0.6 0.6
, 3, 0.8 3, 0.95
3.0 3.6
, 5, 0.95 5, 0.8
5 8
6 7
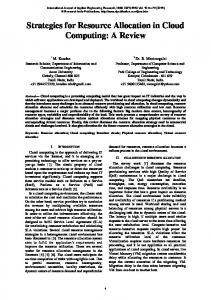
required. In Figure 3, we plot the smallest number of servers required against the arrival rate for a pair of SLAs. We observe that the value of for SLA(3, 0.95) is always larger than or equal to that for SLA(5, 0.8). Through extensive testing involving other SLA pairs, the following pattern is observed. Let , be the smallest number of servers required for the given and SLA. For any pair of SLAs, either , ,
3.4 Heuristic Algorithm To develop our algorithm, we first remove the dependency of the preferred allocation strategy on and by using a metric that represents their difference. We then characterize, for a given value of the difference metric, the dependency of the preferred strategy on the arrival rates and . The results are used to develop a heuristic algorithm that determines the preferred strategy.
3.4.1 SLA Difference We note that for a given SLA, different arrival rates could result in different number of servers
104
or
over the range of values of considered (which is 0 < λ ≤ 40). This pattern led us to use a single metric to describe the difference in for a pair of SLAs. Let be the average number of servers required to meet the given SLA over the range of arrival rates considered. is given by: ,
(4)
where 40. can be computed numerically. We define a metric called “SLA Difference” between and (denoted by D) as follows: |
Table 2: Two Example Cases Our goal is to develop an efficient algorithm that determines the preferred allocation strategy (DA or SA) for given values of , and (i = 1, 2). This would facilitate resource management because the preferred strategy requires the smallest number of servers to meet the SLA of both classes.
, ,
|
(5)
20 15 SLA (3, 0.95)
10 m 5
SLA (5, 0.80)
0 0
1
2
3
4 5 6 Arrival Rate
7
8
9
10
Figure 3: Smallest Number of Servers Required
3.4.2 Dependency on Arrival Rates We now present results that show the impact of , and on the merits of SA and DA. Consider the two scenarios summarized in Table 3. The SLA pair for scenario 1 is not the same as that for scenario 2, but the SLA difference of the two scenarios are almost the same (equal to 22.6). The results for these two scenarios are shown in
Figures 4 and 5, respectively. For each combinaand , the corresponding intersection tion of is grey if DA is the better strategy, and white if SA is better or as good as DA. We observe similar patterns of grey and white for both scenarios 1 and 2. Let be the fraction of intersections that are grey (i.e., DA is better). Our results indicate that for both scenarios, is approximately 5.2%. A similar observation is made in Figures 6 and 7 where we consider two scenarios that have larger SLA differences (see Table 4). For these scenarios, the SLA difference is 83.45 and the resulting is increased to about 64%. Through extensive testing, it was found that the above observation is true for scenarios where the SLA differences are very close to each other. We also observe that tends to increase with D. Based on these results, we conclude that SLA difference is potentially useful in our effort to develop a heuristic algorithm that determines the preferred strategy. Scenario 1 2
SLA(4.5, 0.85) SLA(4, 0.8)
SLA(2.5, 0.9) SLA(2.5, 0.9)
Table 3: SLA pairs where Scenario 3 4
SLA(5, 0.85) SLA(4.5, 0.8)
λ1 Figure 5: Scenario 2
λ2
22.58 22.60
22.6
SLA(3, 0.95) SLA(3, 0.95)
Table 4: SLA pairs where
λ2
83.45 83.48
λ1
83.5
Figure 6: Scenario 3
λ2
λ2
λ1
λ1 Figure 4: Scenario 1
Figure 7: Scenario 4
105
3.4.3 Description of Algorithm We observe from the results in Figures 4 to 7 that there are well-defined regions where DA or SA is likely the preferred strategy. These regions are separated by a straight line, as illustrated in Figure 8. Based on this observation, we define, for a given SLA difference, an angle α such that at least % of the intersections in region 2 indicate that DA is the preferred strategy. In our investigation, we use 90. Using numerical examples, a plot of the angle α against SLA difference is shown in Figure 9.
λ2
erage of the ’s for the SLA differences within the interval. SLA Difference [0, 30) [30, 62) [62, 78) [78, 82) [82, 86.1)
Angle α (degree) 0 22 52 69 77
Table 5: Angle Table Our algorithm is included as Algorithm 2 beand low. We first compute using Equation (4). These values are then used to compute the SLA difference D. The angle corresponding to D is obtained from the angle table. , is below the line deIf the intersection fined by the angle (i.e., in region 2 of Figure 8), DA is the preferred strategy; otherwise SA is the preferred strategy.
λ1
α
Algorithm 2 Input: , , Output: DA or SA 1: 2: 3: 4:
Figure 8: Heuristic method
// Arrival rates // SLAs // Allocation Strategy
Compute and Compute SLA difference Search angle table to obtain ⁄ , return DA, else return SA if tan
100 80
3.5 Performance Evaluation
60
α
40 20 0 10
20
30
40 50 60 SLA Difference
70
80
90
Figure 9: SLA difference vs. Angle Our algorithm uses an “angle table” to capture the relationship between SLA difference and the angle . An example of such a table is shown in Table 5 where the SLA difference is organized into 5 intervals. An angle is pre-determined for each interval; the pre-determined value is the av-
106
In this section, the heuristic algorithm presented in Section 3.4 is evaluated with respect to its ability to come up with a strategy (DA or SA) that results in the smallest number of servers. Our evaluation is based on the following consideration. Each time the global arbiter makes a resource allocation decision, it determines the number of servers required by the two job classes, using , and (i = 1, 2) as input parameters. Since these parameters may have different values at different time instants when resource allocation decisions are made, our approach is to consider a large number , of combinations of , and (i = 1, 2). The performance of the heuristic algorithm for each combination is determined, and the
average performance over the combinations is used for evaluation purposes. For each combination, the values of , and (i = 1, 2) are selected according to their respective probability distributions. These values are generated using random numbers. The probability distributions used in our evaluation are summarized in Table 6. These distributions represent the frequencies at which values of , and (i = 1, 2) are seen by the global arbiter. Note that three different distributions are used for and , and only one distribution is used for each of the other parameters. The notation in Table 6 is explained as follows: • U (a, b) – uniform between and • N (20, ) – normal with mean 20 and vari(values ≤ 0 and > 40 are excluded) ance • E ( ) – exponential with mean (values > 40 are excluded) Parameter
Distribution
,
U (0, 40) N (20, ) E( ) U (a, b) U (0.8, 0.95)
, ,
Table 6: Probability distributions For our heuristic algorithm, its effectiveness is measured by: S = Prob [heuristic algorithm finds a correct strategy]. By correct strategy, we mean a strategy that requires the smallest number of servers to meet the SLA of both classes. In case DA and SA lead to the same smallest number, then both are considered as a correct strategy. The performance metric is obtained as follows. We repeat the steps shown in Procedure 1 times is zero). (the initial value of the variable ⁄ . is then given by: Our results for 10,000 and 6 different settings of the probability distributions are shown in Table 7; for all settings, the distribution used for and is U (0.8, 0.95). These results show that our heuristic algorithm has at least a 96% probability of finding a correct strategy for all the cases considered. They indicate that the heuristic
algorithm is effective in determining a strategy that requires the smallest number of servers. Procedure 1 1: Generate values for and . 40, then goto step 1. 2: if 3: Generate values for , , , and . 4: Apply Algorithm 2 to obtain an allocation strategy (denoted by ). and using Equations (2) and 5: Compute (3). The correct strategy (denoted by ) is or SA if . DA i f is the same as , then ++. 6: if
, U (0, 40) U (0, 40) N (20, 5) N (20, 10) E (10) E (20)
, U (2, 5) U (2, 10) U (2, 5) U(2, 5) U (2, 5) U (2, 5)
0.973 0.979 0.961 0.966 0.982 0.984
Table 7: Probability of correct strategy
4 Priority Disciplines In this section, we consider scenarios where the scheduling discipline is not restricted to FCFS. Obvious choices are disciplines that give priority to the job class that has a more demanding SLA, e.g., a smaller response time threshold and/or a larger target probability . Such disciplines are only applicable under shared allocation (SA). Two priority disciplines are considered: head-ofthe-line priority and a new discipline called probability dependent priority.
4.1 Head-of-the-Line Priority In head-of-the-line priority (HOL), the job class with the larger value has higher priority. Whenever a server becomes available, jobs in the higher priority class are considered first. If the queue of the higher priority class is empty, then jobs in the lower priority class are considered. Within the same class, jobs are processed in FCFS order.
107
4.2 Probability Dependent Priority Probability dependent priority (PDP) is a new scheduling discipline designed to maximize the probability of meeting a given response time goal. This should have a positive effect in terms of minimizing the number of servers required. Let be the measured frequency that the response time of class i ≤ the threshold . The following counters are used in PDP (both are zero initially): •
- number of class jobs completed so far
•
- number of completed class jobs that has response time Each time a class job completes service, the following steps are performed: is incremented by one. • , is • If this job has response time incremented by one. • Compute a new value of using the equa⁄ . tion: • Update , the priority of class , which is . defined as follows: In PDP, the job class with the larger has higher priority. In case both classes have the same priority value, then the next job class to receive service is selected at random. Note that with PDP, a job class has higher priority if it is meeting the SLA with a smaller margin or is falling behind by a larger margin. In addition, the priority of a job class may change over time because is updated each time a class job completes service.
4.3 Performance Evaluation In this section, the performance difference of FCFS, HOL, and PDP is investigated. For FCFS, results are provided by the heuristic algorithm in Section 3.4. As to HOL and PDP, analytic results for the response time distribution are difficult to obtain, so simulation is used. , and be the smallest number Let of servers required by FCFS, HOL, and PDP, respectively, such that the SLA of both classes are met. We say that and • FCFS is a top discipline if , • HOL is a top discipline if and , and
108
• PDP is a top discipline if and . The methodology presented in Section 3.5 is used in our evaluation. The performance metrics are , and , the fractions of time that FCFS, HOL, and PDP are a top discipline, respectively. The steps shown in Procedure 2 are repeated times and are zero). , (the initial values of , ⁄ and are then given by ⁄ , and ⁄ . Procedure 2 1: Generate values for and . 40, then goto step 1. 2: if 3: Generate values for , , , and . 4: Apply Algorithm 2 to obtain a correct strategy for FCFS and use Equations (2) or (3) to . determine 5: Obtain and by simulation. 6: if and , then nF ++. 7: if and , then nH ++. and , then nP ++. 8: if and , then n++, 9: if , and . Our results for 10,000 and 6 different settings of the probability distributions are presented in Table 8. These results show that PDP is superior to HOL and FCFS in terms of the fraction of time that it is a top discipline. Specifically, PDP is a top discipline over 97% of the time, compared to less than 30% for HOL and less than 2% for FCFS. ,
,
U (0, 40) U (0, 40) N (20, 5) N (20, 10) E (10) E (20)
U (2, 5) U (2, 10) U (2, 5) U (2, 5) U (2, 5) U (2, 5)
1.6% 0.9% 1.3% 1.1% 1.4% 1.5%
25.5% 29.4% 24.8% 23.1% 27.5% 24.6%
98.3% 97.1% 98.5% 98.8% 98.4% 98.0%
Table 8: Performance Comparison To provide further insight into the performance advantage of PDP, we compute, for those combinations of , and (i = 1, 2) where PDP and is the top discipline (i.e., ), the average difference between the number of servers required by PDP and that required by each of the other two disciplines. This is done by
step 9 of Procedure 2 where and are used to and accumulate the difference between and ; is used to keep and that between track of the number of combinations where PDP are initially 0). is the top discipline ( , and The average differences are then given by ⁄ and Δ ⁄ . Δ Results for Δ and Δ for the 6 settings of probability distributions are shown in Table 9. These results show that the difference in number of servers required is consistent across probability distributions, with an average of about 1.4 for Δ and about 1.2 for Δ . ,
,
U (0, 40) U (0, 40) N (20, 5) N (20, 10) E (10) E (20)
U (2, 5) U (2, 10) U (2, 5) U (2, 5) U (2, 5) U (2, 5)
Δ 1.41 1.36 1.49 1.43 1.33 1.36
Δ 1.29 1.16 1.29 1.26 1.12 1.17
Table 9: Performance Difference
5 Related Work Related work in autonomic resource management can be organized according to the approach used in the investigation, including queueing theory, control theory, machine learning, and cloud computing. Queueing theory [8-11] is a well established and widely used methodology in performance evaluation of resource management strategies. In [8], the authors present utility models based on a system of N parallel M/M/1 queues and use results for the mean response time and throughput to maximize the total utility. In [9], a predictive multiclass queueing network model is used to compute the mean response time. A layered queueing network is used in [10] to study the effect of workload and system parameters on performance. A regression based approximation of the CPU demand of client transactions is introduced in [11]; the approximation is obtained using a queueing network model with each queue representing an application tier. Control theory [12-15] has been used in the design of dynamic resource management schemes. In [12], a system is developed that can meet ap-
plication-level quality of service while achieving high resource utilization. An analytic foundation of control theory for a self-managing system is described in [13]. In [14], the authors argue that control theory should be used to build and to configure self-managing systems. The 1000 Island solution architecture is presented in [15]; this architecture has multiple resource controllers that are based on control theory and optimization methods. Machine learning has also been used in autonomic resource management [16-18]. A lightweight on-line learning of correlations between system state and response time is described in [16]. In [17], an active learning approach is used to build predictive models to forecast the completion time of batch jobs. A combination of off-line reinforcement learning and queueing theory is used to improve the accuracy of the prediction [18]. Cloud computing [19] is emerging as a new computational model in which computing is offered as a service over the Internet. A cloud can comprise a large number of hardware and software resources shared by a large number of applications. Scheduling and optimization results in clouds have been reported recently [3, 4]. Both papers consider SLAs as mean response time per class and the objective function is the cost and respectively the profit of a cloud.
6 Concluding Remarks The results in this paper provide valuable insights into the performance of alternative resource allocation strategies and job scheduling disciplines for a cloud computing infrastructure. In our investigation, the service level agreement is based on response time distribution, which is more relevant than the mean response time with respect to the performance requirement of interactive applications. We have developed an efficient and effective algorithm to determine the allocation strategy that results in smallest number of servers required. We have also developed a novel scheduling discipline, called probability dependent priority, which is superior to FCFS and head-of-the-line priority in terms of requiring the smallest number of servers. Although our focus is on the case of two job classes, our findings can be used to develop guidelines for resource provisioning for more complex scenarios.
109
Acknowledgements
References
This work was supported by the IBM Toronto Lab Centre for Advanced Studies and the Ontario Centres of Excellence.
[1] W.E. Walsh, G. Tesauro, J.O. Kephart, and R. Das. Utility Functions in Autonomic Systems. Proc. 1st International Conference on Autonomic Computing, New York, 2004.
About the Authors
[2] L. Kleinrock. Queuing Systems Volume 2: Computer Applications. Wiley-Interscience, New York, 1976.
Ye Hu received his MMath degree in Computer Science from the University of Waterloo in 2009. He was an IBM CAS Fellowship student in 2007 and 2008. He is currently a System Design Specialist at Thales Group Toronto Division. Johnny Wong received his Ph.D. degree in Computer Science from the University of California at Los Angeles in 1975. Since 1975, he has been with the University of Waterloo where he is currently a Professor in the David R. Cheriton School of Computer Science. He was Director of the School from 2003 to 2006. His research interests are in the areas of performance evaluation, distributed systems, resource management, and information delivery. Gabriel Iszlai is a Senior Technical Staff Member with the IBM Center for Advanced Studies in Toronto, Canada. He received his B.S. degree in 1992. Prior to joining IBM he worked as Chief Scientist for ThinkDynamics, a company acquired by IBM in May 2003. He was one of the initial designers of the former ThinkControl application, known today as IBM Tivoli Intelligent Orchestrator. Prior to that, he worked for over 8 years in the IT industry for different European telecom companies. Marin Litoiu is a professor at York University. Prior to that he was a Senior Research Staff Member with Centre for Advanced Studies, IBM Toronto Lab, where he led the research programs in Autonomic Computing, System Management and Software Engineering. He was the Chair of the Board of CSER, a Canadian Consortium for Software Engineering Research and Director of Research for Centre of Excellence for Research in Adaptive Systems. Dr. Litoiu holds doctoral degrees from University Polytechnic of Bucharest and from Carleton University. His research interests include autonomic computing; high performance software design; performance modeling, performance evaluation and capacity planning for distributed and real time systems.
[3] A. Lenk, M. Klems, J. Nimis, et al. What’s Inside the Cloud? An Architectural Map of Cloud Landscape. Proc. ACM/IEEE Symposium on Cloud Computing Challenges, 23-31, Vancouver, 2009. [4] J. Li, J. Chinneck, M. Woodside, and M. Litoiu. Fast Scalable Optimization to Configure Service Systems having Cost and Quality of Service Constraints. Proc. IEEE International Conference on Autonomic Systems, Barcelona, 2009. [5] Y. Hu. Resource Allocation for Multiple Job Classes. Master’s Thesis, University of Waterloo, 2009. [6] M. Kwok. Performance Analysis of Distributed Virtual Environments. PhD Thesis, University of Waterloo, 2006. [7] J.W. Wong and S.S. Lam. Queueing Network Models of Packet-Switching Networks, Part I: Open Networks. Performance Evaluation, 921, 1982. [8] G. Tesauro, R. Das, W.E. Walsh, and J.O. Kephart. Utility-function-driven resource allocation in autonomic systems. Proc. 2nd International Conference on Autonomic Computting, Seattle, 2005. [9] M.N. Bennani and D.A. Menasce. Resource Allocation for Autonomic Data Centers using Analytic Performance Models. Proc. 2nd International Conference on Autonomic Computing, Seattle, 2005. [10] M. Woodside, T. Zheng, and M. Litoiu. Service System Resource Management Based on a Tracked Layered Performance Model. Proc. 3rd International Conference on Autonomic Computing, Dublin, 2006. [11] Q. Zhang, L. Cherkasova, and E. Smirni. A Regression-Based Analytic Model for Dy-
110
namic Resource Provisioning of Multi-tier Applications. Proc. 4th International Conference on Autonomic Computing, Jacksonville, Florida, 2007. [12] P. Padala, X. Zhu, M. Uysal, Z. Wang, S. Singhal, A. Merchant, K. Salem, and K. Shin. Adaptive Control of Virtualized Resources in Utility Computing Environments. Proc. European Conference on Computer Systems, Lisbon, 2007. [13] Y. Diao, J.L. Hellerstein, S. Parekh, R. Griffith, G.E. Kaiser, and D. Phung. A Control Theory Foundation for Self-Managing Computing Systems. IEEE Journal on Selected Areas in Communications, 2213-2222, 2005. [14] C. Karamanolis, M. Karlsson, and X. Zhu. Designing Controllable Computer Systems. Proc. USENIX Workshop on Hot Topics in Operating Systems, Santa Fe, New Mexico, 2005. [15] X. Zhu, D. Young, B. J. Watson, Z. Wang, J. Rolia, S. Singhal, B. McKee, C. Hyser, D. Gmach, R. Gardner, T. Christian and L. Cherkasova. 1000 Islands: Integrated Capacity and Workload Management for the Next Generation Data Center. Proc. 5th International Conference on Autonomic Computing, Chicago, 2008. [16] S. Ghanbari, G. Soundararajan, J. Chen, and C. Amza. Adaptive Learning of Metric Correlations for Temperature-Aware Database Provisioning. Proc. 4th International Conference on Autonomic Computing, Jacksonville, Florida, 2007. [17] P. Shivam, S. Babu, and J. Chase. Learning Application Models for Utility Resource Planning. Proc. 3rd International Conference on Autonomic Computing, Dublin, 2006. [18] G. Tesauro, N. K. Jong, R. Das, and M. N. Bennani. A Hybrid Reinforcement Learning Approach to Autonomic Resource Allocation. IEEE Internet Computing, 22-30, 2007. [19] M. Litoiu and G. Iszlai. Performance Model Driven QoS Guarantees and Optimization in Clouds. Proc. ACM/IEEE Symposium on Cloud Computing Challenges, 15-22, Vancouver, 2009.
111