distribution of the test statistic, T, (eqn 3) for a wide variety of simu- .... "multivariate" Student's t-distribution where the number of degrees of free- dom, n, is ...
CGTM No. 153 November 1974
SLAC Computation Group Stanford, California
A NONPARAMETRIC PROCEDURE FOR COMPARING MULTIVARIATE POINT SETS
Jerome H. Friedman and Sam Steppel
ABSTRACT An algorithm that tests the hypothesis that two multivariate point samples were drawn from the same unknown probability density, is described.
The
algorithm provides a measure of the discrepancy between the two point distributions, as well as providing information concerning the regions of the multivariate space where the discrepancies occur.
A procedure for calcu-
lating the significance level of the test in any given situation is presented.
On multivariate normal data, this nonparametric test is found to
be considerably more powerful than the normal theory likelihood ration test when the two samples differ primarily in scale.
Introduction Consider two samples of Nl and N2 observations taken on vector random variables
X! and 'Y with
unknown probability density functions f(;c) and g(y>.
We wish to test the null hypothesis, H , that f(;c) o
g(y> for all
X! and 'Y.
It is often useful in data analysis problems to compare two multivariate point sets to determine to what extent they are similar or different. At the most straightforward level, two experiments can be compared for their compatibility.
Since the test is able to make the comparison in the full
dimensionality of the data measurement space, all of the information contained in the experiments is used. More generally, one usually wishes to determine if changing a property, y, of the data has any effect or consequences on the resulting joint probability density function, p(;c), of the experimental measurements,~. whether these experimental measurables for y.
That is,
can be used in any way as predictors
Although it may be impossible to formulate a specific model for the
dependence (as one does with regression), it may still be important to know -7
if there exists any information in the aggregate of measured variables, x, having a bearing on the response variable, y. This can be accomplished by partitioning the data set on the value of the dependent variable, y, and treating the resulting data sets as independent samples.
These samples can then be compared for compatiblilty in the full
dimensionality of the data space.
If these multivariate point sets are
shown to be compatible, then there exists no relationship between the measurement variables,
X!,
and the response or dependent variable, y.
If, on the contrary, a relationship is shown to exist, then it is often useful to be able to determine those simultaneous values of the measurement variables where the response is strongest. - 1 -
That is, those regions of the
multivariate data space where data samples most disagree in their relative densities.
This information can often give considerable insight as to the ---7
nature of the dependence of y on the measurement variables, x, as well as allCJ'oling the ye-sea'Yche'Y to maximize the predictive power of his observations. As an example, consi.d er discrimination analysis in pattern classification.
Here the dependent variable, y, is an indicator of the correct ---7
classification of a pattern, and the measurement variables, x, are a chosen set of pattern features.
Different patterns can be compared in the feature
space to determine the discrimination ability of the chosen set of features. Those regions of the feature space that yield the lowest error rate for each pattern can be identified.
The relative merits of various different feature
spaces can also be evaluated. For another example, consider medical diagnosis.
Here the data is par-
titioned into two samples on the basis of incidence of a disease.
In this
case, the dependent variable, y, is binary and simply indicates the presence or absence of the disease.
These two samples are then compared in the data
---7
space, x, of all clinical measurements performed on the subjects.
If the
two samples are shown to be compatible, then that particular set of clinical observations cannot be used to diagnose the disease.
If the samples are
different, then the set of simultaneous values of the measurements that are most likely to indicate the presence (or absence) of the disease can be identified.
This information can be used to diagnose future patients.
When f{X) snd g(~ are both mulUvariate normal, the point distributions can differ only in their location vectors and dispersion matrices. normal distributions the data sets can differ in a variety of ,.;ays.
For nonThe
identity of location vectors and of dispersion matrices, while necessary, is not sufficient to guarantee the identity of the two distributions.
- 2 -
For many
applications, the underlying density functions may not be known, requiring more general techniques for comparing distributions. parametric procedures are usually required.
For these cases, non-
Nonparametric procedures do not
work in terms of a set of parameters and require few assumptions about the underlying multivariate distributions.
A desirable property of these pro-
cedures is that they be at least roughly distribution-free in the sense that they perform similarly (at least as far as the probability of falsely finding a significant distinction) for differing underlying multivariate distribu1 " t lons.
In the multivariate case, nonparametric procedures often have been
difficult to implement and have proved to be far from distribution-free. This report describes a nonparametric procedure for comparing two multidimensional point distributions that is straightforward to implement and whose test statistic distribution is reasonably independent of the underlying density function.
In addition, a permutation technique is described
for estimating the significance level of the test in any given application. This procedure not only gives a measure of
the compatibility of the two-
point distributions, but also gives information as to those regions of the multidimensional data space where the correspondence between the point sets is good (in terms of their relative densitiesh and where they are most discrepant. The finite sample statistical properties of this test are studied by applying it to a wide variety of simulated data.
These simulations show
that when applied to multivariate normal data this nonparametric test has comparable power to the normal theory likelihood ratio test for location differences and is considerably more powerful for differences in scale.
- 3 -
Comparison Procedure The algorithm for testing the null hypothesis, H , that two multivariate o point samples (classes) were drawn from the same unknown probability density function (p.d.f.), proceeds as follows.
The two samples of size Nl and N2
respectively, are combined into a single sample of size N = N + N with 1
each pOint tagged as to the class from which i t originates.
2
The closest k
points to each point are examined and the number, k , originating from class l one (or the corresponding number, k2 determined.
= k-k l , originating from class two), is
Thus, associated with each point in this combined sample is a
measure of the composition of the points closest to it.
The observed fre-
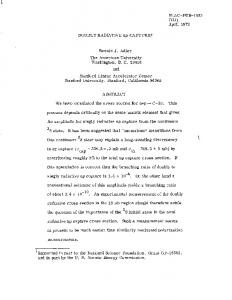
quency distribution of k , n(k ), for all the sample pOints, is recorded. l l This frequency distribution is then compared to that expected under the null hypothesis. There ere a variety of ways of testing whether the observed distribution for kl conforms to that expected under Ho'
One technique involves comparing
the frequency distribution of k , nl(k ), evaluated in the neighborhoods l l centered at class one points to the frequency distribution of k , n (k ), l 2 l evaluated in the neighborhoods centered at class two points. these two distributions are expected to be the same.
Under H o
Asymptotically,
differing multivariate p.d .f.'s for the two classes results in higher concentrations of class one points in near neighborhoods of class one centers and, similarly, higher concentrations of class two points in near neighborhoods of class two centers.
This causes nl(k ) to be shifted towards higher l
values of kl while n (k ) will be shifted toward lower values, from their ex2 l pected distributions, n (k ), under H. ol · 0 of the form
- 4 -
This leads naturally to at-statistic
( 1)
t
where
k
I kl=O
[k -k (1)]2 nl(k ) l l l
k
2
'i'
L kl=O
[k -k (2)] l l
n (kl ) 2
as a candidate for a test statistic comparing the two distributions.
natively, anyone of the many Hell
knOl-Tn
Alter-
statistical techniques for directly
testing the compatibility of two univariate distributions can be used. Although, asymptotically, this procedure
may be
optimal, for finite
sample sizes it works well only when the two classes differ primarily in their locations.
The
test is relatively insensitive to differences in scale
(extent) between the two multivariate point samples.
This is caused by the
tendency of near neighboring to choose points preferentially in regions of higher density.
Even points in the relatively sparse regions of the space
will tend to choose nearest neighbors preferentially in dense regions.
Only
those sparse points that lie very far from a dense region will have mostly sparse points as nearest neighbors.
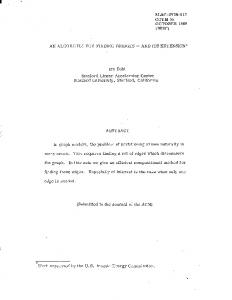
For the case where the two point samples
differ mainly in scale, the class with smaller scale (for example, class one) will populate the space
mainly in regions of high density, while the points
- 5 -
from the other class (class two) will lie principally in regions of lower density. neighbors.
The class one points will clearly have an excess of class one However, due to the tendency of near neighboring to choose points
from regions of high density, the class two points will also have an excess of class one neighbors.
In fact, for small to moderate differences in scale
between the multivariate distributions, there is very little difference between nl(k ) and n (k ) even though they both deviate from the expected l 2 l null distribution, no(k ). l
This deficiency can be overcome by directly
comparing the detailed distributions of nl(k ) and n (k ) to their expected l 2 l distribution, nO(k ), under Ho. l
The problem of comparing two multivariate
point distributions is, in this way, reduced to a univariate goodness-of-fit test. If each of the N k-neighborhoods were mutually exclusive, then the relative frequency of the possible values of kl would (under the null hypothesis) conform to a binomial distribution over 0, 1, 2, ... , k with probability p
= Nl/N;
k-degrees of freedom.
that is, no(k ) would be a binomial distribution with l These neighborhoods cannot be mutually exclusive,
- 6 -
however I since the;re are N neighborhoods - each contain ing k points - with only N total sample points.
Thus, there is no reason to expect the distri-
bution of kl values to be compatible with such oa binomial distribution. The precise distribution in the general case is difficult to derive, but Monte Carlo calculations for a wide variety of cases indicate very little discrepancy between the true distribution and a binomial.
Thus, a differ-
ence between the two multivariate samples can be measured by comparing the distribution observed for the kl values with the corresponding binomial distribution.
Anyone of the many well known univariate goodness-of-fit
test s may be used for this purpose. For the experiments described in this report, the two kl-distributions, nl(k ) and n (k l ) were summed to a single distribution, n(k ) l l 2
=
nl(k ) + n (k ), l 2 l
and the resulting sum compared to that predicted by the null hypothesis, no(k ). l
Counting each sample point itself as one of its k-nearest neighbors
and appl ying bincm1811 s t atistics, one ob tains
with the conventions
k-l
l-l
I
::= 0 and
(
kk- l
==
o.
The mean value of kl for this
distribution is k
as expected for a binomial precess. -~--
- 7 -
The observed number of counts, n(k ), for each value :01' kl is then l
compared to no(k ). l test statistic.
This comparison can be made using any goodness of fit
For the experiments described in this report, a statistic
x2 test statistic
analogous to Pearson's
was used.
2
In order for this algoritbm
til)
be useful, t he Bignifi~ance level (p-
value), a(T), for the experimentally obtained value of the test statistic, T, must be determined.
This can be accomplished by employing a permutation pro-
cedure to estimate the significance level of the test for each application, directly from the' datal
O.
x.1 For the null hypothesis, ~=O and cr=l for Goth samples. log-location
In Table 6a, the
along the first axis of one of the samples is systematically
displaced by a distance ~, while in Table 6b the log-scale, cr, is varied along all axes.
Table 7 canpares the pe r ormance of the test for differing number, k, of near neighbors.
Here the results of Table 4 (k=20) are compared t o
the results of the test for k=5 and k=lO.
It is seen that the performance
of the test tends to be reduced with smaller values of k but the effect is not dramatic. These experiments, while not exhaustive, do indicate that the comparison procedure performs reasonably well in determining whether the
UlO
multi-
variate point distributions were drawn from the same underlying p.d.f.
The
test appears to be sensitive to differences of location, scale, and shape between the two distributionso
The performance of the test seems to have
only a moderate dependence on the choice of the number of near neighbors. To the accuracy of the simulations, the test appears to be unbiased for the cases tested.
The test is also very robust against extreme outliers.
Since
the procedure involves only ordering and counting and does not use the distances directly, it is easy to see that a few extreme outliers will have little effect on the results.
- 13 _.
Measurement Variables Scaling and Metric This procedure leaves to the researcher's discretion the choice of the coordinate variables and metric, as well as the number of nearest neighbors, k.
As shown in Table
7, this procedure is reasonably insensitive to the
choice of k, provided that it is not too small.
In order for the test to be
consistent, k should be a function of the total sample size such that 5
lim
k(N)
0),
and
lim N-7O)
N-7 0)
k(N) N
o.
Experimentation has shown that the choice of k is not important so long as k > 10-20.
Clearly, k should be small compared to the total sample size, N.
This algorithm is somewhat more sensitive to choice of measurement variables and metric. choice.
Unfortunately, there are no good guidelines for their
For very large sample size, the algorithm is clearly invariant to
changes in coordinate variables and metric since these changes simply alter the shape of the volume element containing the evaluation point.
Since these
volumes are infinitesimally small, their shape doesn't matter. For finite sample sizes, however, the shape does matter. Changes in the volume shape that result in changes of the identities of the nearest neighbors can
have an effect on the performance of the algorithm.
Hostetler
6
Fukunaga and
show that for those data distributions that can be made spheri-
cally symmetric by a linear transformation, the optimum metric is the inverse covariance matrix of the underlying distribution,
p(Xj.
If this covariance
matrix is estimated by the data sample covariance matrix, then this is equivalent to scaling each of the coordinates so that they have equal variance along the principal axes of the data (sphericalizing the data). If there is no a priori information concerning the data, then this is probably the best procedure.
Another reasonable procedure is to simply scale
- 14 -
the data to have equal variance along the original measurement coordinates.
On the other hand, different experimental measurement accuracy or different characteristic length of density variation can dictate unequal scales among the various coordinates.
Changing the scale of a coordinate changes its
relative importance in determining the goodness-of-fit.
Thus, if the re-
searcher has information as to which coordinates are most important, they should be given larger scales. The number and specific choice of coordinate variables also affect the performance of this
test.
Increasing the number of coordinates only
improves the performance when those variables contain information concerning the
hypothesis under test.
In fact, coordinates that do not contain such
information (noise coordinates) dilute the power of the test.
This is be-
cause these dimensions add statistical uncertainty to the kl estimates without providing information helpful to the comparison.
Even a coordimte that
does contain some additional information may not help because the increase in statistical variance that it introduces hurts more than the information increase helps.
The precision of this test
can be increased greatly if the
researcher's knowledge and intuition lead him to a judicious choice of coordinate variables. After the specific measurement variables and their scales are chosen, there is still the choice of the metric or multidimensional dissimilarity measure.
That is, given a one-dimensional dissimilarity measure for each
coordinate, how are these combined to define a distance in the multidimensional space.
One-dimensional distance is nearly always defined as the
absolute value of the difference in coordinate values
- 15 -
where the subscripts label the points and the superscripts label the coordinate.
The most commonly used multidimensional distance measures are the
Minkowski p-metrics,
d
p
(~ ,~ ) m n
Of these, the three most popular are the (city block or taxi cab distance)
p == 1
i.e. ,
p
2
(Euclidean distance measure)
p
CD
(maximum axis distance measure)
d
-7 (
CD
-7
x ,x ) m n
The advantage of the p == 1 measure is that it can be calculated rapidly with no multiplications. axis scales.
It is also relatively robust against changes in relative
The advantage of the p
natural extension of the familiar and solid geometry.
than the p
Eu~ l idean
dis,tGlnce mea sure use.d in plane
It is scmewhat less robust to changes in axis scales
1 metric.
=
distance measure is that it is the
== 2
culated rapidly with no
Like the p
=
1 metric, the p
= 00
metric can be cal-
and it has the additional advantage
multiplication~
that the nearest neighbors can be found much more efficiently for this distance measure (especially for high dimensionality) than with the other p-metrics. 7,8
This metric has the greatest sensitivity to the relative co-
orainate scsles. 'The best choice for a distance measure depends upon the problem at hand, and is related to the underlying density distrioution of the multidimensional data.
As for the
guidelines.
choice of variables and scales, there are no good
It can be shown that the p
points are multivariate normal.
==
2 metric is optimal when the data
However, there are no general results for
other types of distributions.
- 16 -
Although the choice of measurement variables, scales and metric is arbitrary, they can have an effect on the performance of the test. usually an optimum choice for each particular problem.
There is
Fortunately, one can
use the algorithm itself to determine the effect of differing choices and even search for the best one.
The test can be applied with various differing
choices to observe the extent to which the significance level, a(T), changes. If there is little change, then the specific choice is probably not important while if there is a great deal of change, then the particular set that minimizes the significance level is a good candidate for the best choice.
In
particular, by choosing various sets of measurement variables, one can search for the best feature space for pattern classification. Computational Requirements Almost the entire computational cost of employing this procedure is in the calculations required for finding the k-nearest neighbors to each sample point.
The most straightforward procedure is to simply calculate the dis-
tance from each point to all of the other points and identify the k-smallest. This is known as the brute force (BF) method and requires computation proportional to the dimensionality, d, and proportional to the square of the sample size,
Recently, several new algorithms for finding nearest neighbors have been reported 7,8 that are faster than the brute force method for sufficiently large N and small d.
The method of Friedman, Baskett, and Shustek (FBS)7 finds
the k-nearest neighbors with computation 1
lkdr2(~)J d N2-~ - 17 -
while the method of Bentley (B)
8 finds them with computation
The advantage of the BF-method is it's low overhead requirements in both computation per distance calculation and additional memory.
The FBS
method introduces a small amount of computational overhead and a substantial increase in memory requirements (depending upon the optimization level used with the algorithm).
The B-algorithm introduces a large computational over-
head per distance calculation and requires an amount of additional memory comparable to the FBS method. The best algorithm to use depends upon the combined sample size, N
= Nl +N 2 , the dimensionality, d, to a smaller extent the number of near
neighbors, k, and on the amount of memory available.
Simulations have shown
(see reference 9) that for dimensionalities less than ten and combined sample sizes less than 3000 to 5000, the FBS algorithm performs the best.
For
the same range of dimensionalities but larger sample sizes, the B algorithm is fastest.
For high dimensionalities and small sample sizes, a brute force
method that is highly tailored to a particular computer is most effective. For very large sample sizes, one might consider an "egg crating" technique.
That is, the multivariate space is partitioned into several cells
and the comparison performed separately on the sample points in each cell. The results of the several comparisons can then be statistically combined to yield a significance level for the test over the entire multivariate space.
Acknowledgment Helpful discussions with William H. Rogers are gratefully acknowledged.
- 18 -
FOOTNOTES AND REFERENCES 1.
The word "nonparametric" is often used to mean "distribution free." It will not be so used here.
2.
Although this procedure may appear somewhat naive, our simulation experiments indicate that this test has similar power and robustness to other more sophisticated approaches.
In particular,
we could measure no significant difference between this approach and one involving separate comparisons of no(k ) to nl(k ) and l l n (k ) individually, or employing more sophisticated test 2 l statistics for the univariate comparison.
Also, this test per-
formed as well as the t-statistic (eqn 1) when the multivariate distributions differed only in location.
(For the reasons des-
cribed above, it, of course, performed much better for differences in scale between the two multivariate distributions.)
3.
All of these simulation results were obtained using the specific comparison procedure described in the preceding
section, namely,
comparing nl(k ) + n (k ) to no(k ) (eqn 2) using the test 2 l l l statistic of eqn 3.
As discussed in the preceding section, this
choice is somewhat arbitrary.
However, additional simulations
with a variety of other procedures indicate very little difference in characteristics or performance, so that the simulation results presented here are characteristic of the general properties of the test and not of the details of its implementation.
4.
Anderson, T.W., An Introduction to Multivariate Statistical Analysis, New York: John Wiley and Sons, Inc., 1958. pp 250-251.
- 19 -
5.
Loftsgaarden, DO., and Quesenberry, C.P., "A Nonparametric Estimate of a Multivariate Density Function," Ann. Math. Statist., Vol. 36, pp. 2049-1 0 51, 1965·
6.
Fukanaga, K. and Hostetler, L.D., "Optimization of k-Nearest Neighbor Density Estimates," IEEE Trans. Info. Theory, Vol. IT-19, pp. 320326, May 1973.
7·
Friedman, J.H., Baskett, F., and Shustek, L.J., "A Relatively Efficient Algorithm for Finding Nearest Neighbors," Stanford Linear Accelerator Center, Report No. SLAC-PUB-1488, June 1974.
Also, Com-
pute:r Repository R74-234, pp. 61, No¥ember 1974.
8.
Bentleyl. J.L"
.,tMu1t :1.dlmensiopel
Binary SesTch Trees used for Associ-
ative Searching," Stanford University, Dept. of Computer Science preprint (1974). 9.
Friedman, JH., "COMPAR - A Program for Comparing Multidimensional Point Sets," Stanford Linear Accelerator Center, Computation Research Group Technical Memo No. 162, October 1974.
- 20 -
APPENDIX This section details the calculational procedure used to obtain the results presented in Tables 4 - 7. For Table 4, three hundred normally distributed samples of size 200 were generated and each sample equally divided into two 100-point samples. The comparison procedure was applied to each pair yielding 300 values for the test statistic (eqn 3).
These values were ordered and the median estimate
was taken to be the average of the 150th and 151st values.
For the alternate
hypotheses, the first 100 points of each sample were either translated along the first axis a distance, ~, (Table 4a) or were scaled in all axes by a factor,
G,
(Table 4b).
The second 100 points of each sample remained un-
translated and unscaled.
The median T-value, med(T), was estimated, as
above, from these 300 two-sample comparisons.
Next, the second 100 points
of each sample were similarly translated or scaled while the first 100 points remained untranslated and unscaled.
Another med(T) was estimated from these
300 comparisons and averaged with the previous estimate.
The identical set
of three hundred 200-point samples was used for all hypotheses.
This mini-
mizes the statistical uncertainty in relative values of med(T) due to sampling fluctuations.
The significance levels were estimated by the fraction of T-
values in the 300 null comparisons that were larger than med(T) for each alternate hypotheses.
The notation