10th International Society for Music Information Retrieval Conference (ISMIR 2009)
SMERS: MUSIC EMOTION RECOGNITION USING SUPPORT VECTOR REGRESSION Byeong-jun Han, Seungmin Rho School of Electrical Engineering Korea University {hbj1147, smrho}@korea.ac.kr
Roger B. Dannenberg School of Computer Science Carnegie Mellon University
[email protected]
Eenjun Hwang School of Electrical Engr. Korea University
[email protected]
el [5] offers a simple but quite effective model for placing emotion in a two-dimensional space. In the model, the amount of arousal and valence is measured along the vertical and horizontal axis, respectively. The goal of this paper is to develop a music emotion recognition system for predicting the arousal and valence of a song based on audio content. First, we analyzed seven different musical features (such as pitch, tempo, loudness, tonality, key, rhythm and harmonics) and mapped them into eleven categories of emotion: angry, bored, calm, excited, happy, nervous, peaceful, pleased, relaxed, sad and sleepy. This categorization is based on Juslin’s theory [3] along with Thayer’s emotion model [5]. Secondly, we adopt support vector regression (SVR) [6] as a classifier to train two regression functions for predicting arousal and valence values based on the low-level features, such as pitch, rhythm and tempo, extracted from music. In addition, we compared our SVR-based method with other classification algorithms such as GMM (Gaussian Mixture Model) and SVM (Support Vector Machine) to evaluate the performance. In the following section, we present a brief overview on the current state-of-the-art music recognition systems, and emotion models. In Section 3, we illustrate a musical feature extraction scheme and give an overview of our proposed system. Section 4 describes our proposed SVRbased music emotion recognition method. Experimental results are given in Section 5. In the last section, we conclude the paper with some observations and future work.
ABSTRACT Music emotion plays an important role in music retrieval, mood detection and other music-related applications. Many issues for music emotion recognition have been addressed by different disciplines such as physiology, psychology, cognitive science and musicology. We present a support vector regression (SVR) based music emotion recognition system. The recognition process consists of three steps: (i) seven distinct features are extracted from music; (ii) those features are mapped into eleven emotion categories on Thayer’s two-dimensional emotion model; (iii) two regression functions are trained using SVR and then arousal and valence values are predicted. We have tested our SVR-based emotion classifier in both Cartesian and polar coordinate system empirically. The result indicates the SVR classifier in the polar representation produces satisfactory result which reaches 94.55% accuracy superior to the SVR (in Cartesian) and other machine learning classification algorithms such as SVM and GMM. 1. INTRODUCTION With the recent advances in the field of music information retrieval, there is an emerging interest in (automatically) analyzing and understanding the emotional content of music. Due to the diversity and richness of music content, many researchers have been pursuing a multitude of research topics in this field, ranging from computer science, digital signal processing, mathematics, and statistics applied to musicology and psychology. Many computer scientists [1][2] have focused on music retrieval by using musical meta-data (such as title, genre or mood) as well as low-level feature analysis (such as pitch, tempo or rhythm), while music psychologists [3][4] have been interested in studying how music communicates emotion. Currently, there is no standard method to measure and analyze emotion in music. However, a psychological model of emotion has found increasing use in computational studies. Thayer’s two-dimensional emotion mod-
2. RELATED WORK Many researchers have explored models of emotions and factors that give rise to the perception of emotion in music. Many other researchers investigate the problem of automatically recognizing emotion in music. 2.1 Music and Emotion Traditional mood and emotion research in music has focused on finding psychological and physiological factors that influence emotion recognition and classification. During the 1980s, several emotion models were proposed, which were largely based on the dimensional approach for emotion rating.
Permission to make digital or hard copies of all or part of this work for personal or classroom use is granted without fee provided that copies are not made or distributed for profit or commercial advantage and that copies bear this notice and the full citation on the first page. © 2009 International Society for Music Information Retrieval
651
Poster Session 4
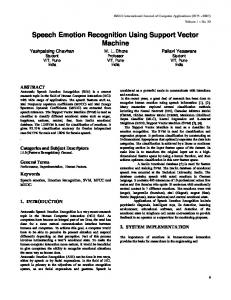
Figure 1. Modified Thayer’s 2-dimensional emotion model
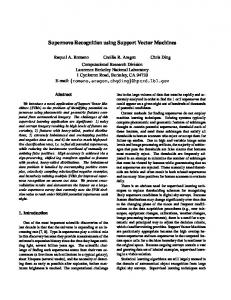
Figure 2. System diagram of the SMERS Computational Media Aesthetics (CMA), analyzes two dimensions of tempo and articulation which are mapped into four categories of moods: happiness, anger, sadness and fear. Lie et al. [4] developed a hierarchical framework for extracting music emotion automatically from acoustic music data. They used music intensity to represent the energy dimension of Thayer model, and timbre and rhythm for the stress dimension. FEELTRACE [9] is software that is designed to let observers track the emotional content of stimuli (such as words, faces, music, and video) as they perceive it and taking full account of gradation and variation over time. Yang et al. [10] developed a music emotion recognition (MER) system from a continuous perspective and represented each song as a point in the emotion plane. They also proposed a novel arousal/valence computation method based on regression theory.
The dimensional approach focuses on identifying emotions based on their location on a small number of dimensions such as valence and activity. Russell’s [7] circumflex model has had a significant effect on emotion research. This model defines a two-dimensional, circular structure involving the dimensions of activation and valence. Within this structure, emotions that are across the circle from one another, such as sadness and happiness, correlate inversely. Thayer [5] suggested a twodimensional emotion model that is simple but powerful in organizing different emotion responses: stress and energy. The dimension of stress is called valence while the dimension of energy is called arousal. As shown in Figure 1, the two-dimensional emotion plane can be divided into four quadrants with eleven emotion adjectives placed over them. We use eleven types based on Juslin’s theory and Thayer’s emotion model. During the last decade, many researchers have investigated the influence of music factors like loudness and tonality on the perceived emotional expression [3][5]. They analyzed those factors using diverse techniques, some of which are involved in measuring psychological and physiological correlation between the state of particular musical factor and emotion evocation. According to the [3], Juslin and Sloboda investigated the utilization of acoustic cues in the communication of music emotions by performers and listeners and measured the correlation between emotional expressions (such as anger, sadness and happiness) and acoustic cues (such as tempo, spectrum and articulation).
3. IMPLEMENTATION In this paper, we implemented a music recognition system, called SMERS (SVR-based Music Emotion Recognition System). The system diagram is shown in Figure 2 and the details are described as follows. 3.1 System Description The SMERS mainly consists of three steps: (i) Feature extraction: Seven distinct musical features are extracted and analyzed (Details are described in the Section 3.3); (ii) Mapping: Extracted features are mapped into eleven emotion categories on Thayer’s two-dimensional emotion model; (iii) Training: The system uses extracted features as input vectors to train the SVR. We use two distinct SVR functions in a polar coordinate system: one is for distance from origin (0, 0) to the emotion in a Thayer-like coordinate system, and the other is for angle. Using these two trained SVRs, the system predicts each song’s emotion. Based on empirical test results, the polar coordinate system is a better representation than the obvious Cartesian coordinates. (More details about training procedure in both Cartesian and polar coordinate systems are presented in Section 4.1).
2.2 Music Emotion Recognition Automatic emotion detection and recognition in speech and music is growing rapidly with the technological advances of digital signal processing and various effective feature extraction methods. Emotion recognition can play an important role in many other potential applications such as music entertainment and human-computer interaction systems. One of the first studies of emotion detection in music is presented by Feng et al. [8]. Their work, based on
652
10th International Society for Music Information Retrieval Conference (ISMIR 2009) 3.2 Dataset
feature of music. Tempo and regularity of beats can be measured in various ways. For beat tracking and tempo analysis, we used the algorithm by Ellis et al. [14]. The features we use are overall tempo (in beats per minute) and the standard deviation of beat intervals, which indicates tempo regularity.
The music dataset for training the SMERS is made up of 165 western pop songs. We collected the 15 songs in each of eleven categories of emotion from the large music database, All Music Guide [11], which provides 180 emotional categories for classifying entire songs. To build classifiers we used Support Vector Regression (SVR) and our implementation is based on the LIBSVM library [12], which gives almost full functionalities for SVR training.
3.3.4 Harmonics Harmonics can be observed in musical tones. In monophonic music, harmonics are easily observed in the spectrogram. However, it is hard to find harmonics in polyphony, because many instruments and voices are performed at once. To solve this problem, a method to compute harmonic distribution yields
3.3 Musical Features In this paper, we consider various musical features including scale, intensity, rhythm, and harmonics and use them as an input vector in the emotion recognition system.
M
HS# f $ " % min # X # f $ , X #kf $ $ k "1
Here, M denotes the maximum number of harmonics considered, f is the fundamental frequency, and X is the short-time Fourier transform (STFT) of the source signal. In the equation, the min function is used in such a way that only the strong fundamental and strong harmonics result in a large value for HS. In our implementation, we measured average of each frequency using (4) and then computed their standard deviation to define the harmonic feature.
3.3.1 Scale Scale is an overall rule of tonic formation of music. In our study, we defined scale as a set of key, mode, and tonality. For accurate scale features, we first analyzed the chromagram for representing the frequencies in musical scales. After that, we applied the key profile matrix by Krumhansl [13]. The following equations show the process of combining chromagram and key characterization: Tonality " C ! KeyProfile Matrix (1) Key " max #Tonality ( Idx ) $ (2) KeyIndex , where vector C has 12 elements and represents the summed chromagram analyzed for each acoustic frame. KeyProfileMatrix is a key profile matrix, which is composed of 12-by-24 elements. KeyIndex indexes KeyProfileMatrix, where KeyIndex=1,2,…,24. After the inner product of C and KeyProfileMatrix in Equation (1), we obtain a tonality score for each key. Finally, we can obtain the most appropriate key by picking the key having maximum tonality in Equation (2).
4. EMOTION RECOGNITION 4.1 Training Process There are some essential conditions needed for effective emotion recognition. Firstly, the regression function should be trained as perfectly close to ground-truth as it can. If the trained regression function cannot generate proper Arousal/Valence (AV) values for a music emotion adjective, the separation policy also cannot act in a proper way. Secondly, a proper music emotion separation policy on the AV plane should be presented. It acts like a decoder or quantizer of AV values. If the separation policy does not reflect the natural mapping between emotion adjectives and AV values, system might have to learn more complex mapping from features to the AV values. Our music emotion separation policy in the AV plane is shown in Figure 3. In case of Cartesian representation, the emotion of a song can be represented by (a, v), where a denoting arousal and v denoting valence and their
3.3.2 Average Energy (AE) Average energy (AE) of the overall wave sequence is widely adopted to measure the loudness of music. Also, standard deviation (!) of AE measures the regularity of loudness. Those are defined as: AE # x $ "
1 N
N
% x#t $ , t "0
2
' #AE # x $$ "
1 N
N
% #AE#x $ & x#t $$ t "0
2
(4)
(3)
, where x is an input discrete signal, t is the time in samples, and N is the length of x in samples.
ranges are aù[-1,1] and vù[-1,1], respectively. There are also 5 separating lines: v=v(+), v=v(-), v=0, a=a(+), and a=a(-). These lines separate the AV plane in 11 areas. As shown in Figure 3, each area has a center point, which is drawn as a black dot. These dots are used as the groundtruth data for training SVRs. On the other hand, the blank dots are outputs of the SVR-based on feature vectors extracted from songs.
3.3.3 Rhythm Rhythm, which is composed of rhythmic features such as tempo and beat, is one of the most important elements in music. Beat is a fundamental rhythmic element of music. Tempo is usually defined as the beats per a minute (BPM) which is used to represent the global rhythmic
653
Poster Session 4 solves the limitations of !-SVR by limiting the task of finding ! to the quadratic optimization problem. For the training sets {(x1, y1), (x2, y2), …, (xn, yn)} with xiùRn, yiùR, and i=1, 2, …, n. The relation between the input xi and output yi can be mapped by an optimal regression function f(x) by SVR training. As the result of training, the difference between trained function output from input and ground-truth of input should be lower than the error !. Assuming linearity, f can be represented as the following hyperplane: f(x) = "·"(x) + b, where "ùRn, bùR, and " denotes a nonlinear transformation from Rn to a high-dimensional space. Our goal is to find the value " and b. The values of x can be determined by solving following quadratic optimization problem:
Figure 3. Music emotion separation policy in AV plane (in both Cartesian and polar representation) For training our emotion classifier, we need two distinct SVR functions. One is for training an arousal value and the other is for a valence value. The training is performed by the musical features of songs as input and the center values of each music emotion as the desired output. Our test verifies whether or not the outputs (arousal and valence values) of trained regression functions are within the range of the proper music emotion in AV plane. Using Cartesian coordinates, we found that some emotions such as “Peaceful” and “Bored” are misclassified into the “Calm” emotion category in the center of the AV plane. We decided to train using polar coordinates as the desired output to see if that would produce better results. Assume that Emotionc and Emotionp represent an emotion in Cartesian and polar coordinate systems, respectively. We can calculate the distance and angle values of each emotion and transfer the coordinate system from Cartesian to polar using the following equations:
min s.t.
can be rewritten as:
"
1 2
"
(7)
n
!
"
i -1
n
!
"
f ! x " - 5 : i* 4 : i 3 !xi " / 3 ! x " . b - 5 : i* 4 : i k ! xi , x " . b i -1
i -1
(8)
, where k is known as the kernel function. On the other hand, (7) can be solved by transforming to the Lagrange function and getting its multipliers, #i and #i*, as indicated in [16]. These are called support vectors and meaningful when they are nonzero values. Also we can get optimal b and ! by the Kuhn-Tucker condition. In our system, we employed Radial Basis Function (RBF) as a kernel function instead of using linear or polynomial functions due to its flexibility.
EmotionP - !Distance, Angle"
!
!
, where C is a constant value. With some data points #i and #i*, we can write " to 8 - 5n !: i* 4 : i "3!xi " , so that f
EmotionC - ! Arousal ,Valence"
& 2 2 ## Distance - ArousalC . ValenceC s.t. % , ArousalC ) '' # Angle - arctan** #$ + ValenceC ( & Arousal P - Distance / cos! Angle " % $ValenceP - Distance / sin ! Angle "
n 1 2 8 . C 5 6 i . 6 i* .97 2 i -1 &4 !7 . 6 i " 2 yi 4 !8 / 3 ! xi " . b " 2 7 . 6 i % $e 1 0, n 0 (0,1]
4.2.2 Support Vector Machine (SVM)-based Training
(5)
For emotion classification, we used multi-class SVM. Since SVM classifies only one class at a time, we trained 11 SVMs to classify each emotion separately. This set of classifiers receives input feature vectors extracted from music. Each classifier generates a probability that the music has a specific emotion. The highest probability value determines the final selection of a single emotion label for the music.
(6)
4.2 Classification Methods 4.2.1 Support Vector Regression (SVR)-based Training The basic idea of regression is to determine a function that accurately approximates target values using input values. SVR [6] is an application of SVM to find the mapping function between input and output. There are two major training strategies of SVR. One is !-SVR, which employs !-insensitive loss function to solve the quadratic optimization problem. However, !-SVR has the following limitations: ! should be set before training the SVR model. Also, it is hard to anticipate the range of ! in most problems. The other strategy, named !-SVR [15],
4.2.3 Gaussian Mixture Model (GMM)-based Training All musical features are modeled using Gaussian Mixture Models (GMMs). We use 7 Gaussian models for arousal and valence sets. Each GMM is trained using the Expectation Maximization (EM) algorithm. The step of GMMbased classification is as follows: first of all, 3 and 4 GMMs were trained for labeling arousal and valence, respectively. Next, the two GMMs sets produce two classifications for arousal and valence, respectively. For example, the GMMs set for arousal labeling could classify A is
654
10th International Society for Music Information Retrieval Conference (ISMIR 2009) Table 1. SVR training parameters and obtained optimums in Cartesian representation
lower than -1/3, between -1/3 and 1/3, or higher than 1/3. In final step, music emotion is determined by combining the results from two GMMs sets.
Name of parameters Nu (!) Gamma of RBF (g) Cost (C)
5. EXPERIMENTS AND RESULTS In this section, we evaluate the effectiveness of our emotion recognition system in terms of accuracy. Coefficients for SVR, SVM and GMM and kernels are very critical to performance. In our experiment, we tried to find the optimal classification parameters empirically. We also considered the !-fold cross-validation method in order to prevent the over-fitting problem. We tested !-fold crossvalidations using different ! values. The best SVR training parameters and optimum values in both Cartesian and polar representation are shown in Table 1 and 2, respectively. We searched for optimal values of all parameters (except “# of folds in cross validation”) in steps of about 7%. Moreover, cross validations were carried out 54 times for each step. In order to evaluate Cartesian coordinate system-based classification methods, we employed three types of classifiers: SVMs with one-to-one training policy, SVR, and GMM. First of all, in SVMs-based classification, one-toone training policy was employed, since SVM does not support multi-classification basically. In SVR-based classification, we trained two regression functions to represent arousal and valence respectively. Finally, GMM was trained following the procedure in Section
(a)
Range 2-5 ~ 2-0.1 2-20 ~ 2-0.1 1 ~ 215
Optimum 2-1.7 2-8.3 27.4
Table 2. SVR training parameters and obtained optimums in polar representation Name of parameters Nu (!) Gamma of RBF (g) Cost (C) mean squared error
Distance 2-8 2-10 28 0.02498
Angle 2-8 2-4 26 0.09834
4.2.3. On the other hand, in polar coordinate systembased classification, two SVRs, which represent distance and angle respectively, were trained. 5.1 Confusion Matrix Confusion matrices of each coordinate system combined with each classifier are presented in Figure 4. As shown in Figure 4, the errors of both SVMs and SVR in Cartesian coordinate system were comparably higher than both GMM in Cartesian coordinate system and SVR in the polar coordinate system. The result of SVMs in the Cartesian coordinate system, presented in Figure 4(a), was good on specific music emotions such as angry, bored, and peaceful. However, most other diagonal elements had poor results. The change from multi SVMs to SVR increased the performance as shown in Figure 4(b). On average, 9.5
(b)
(c)
Table 3. Classification result Classifiers
(d)
(e)
Figure 4. Confusion matrices: Cartesian coordinate system with (a) SVMs (b) SVR (c) GMM, and polar coordinate system with (d) GMM and (e) SVR.
655
SVMs SVR GMM SVR GMM
Coordinate System Cartesian Cartesian Cartesian polar polar
Accuracy 32.73% 63.03% 91.52% 94.55% 92.73%
Poster Session 4 songs were correctly classified, but still some emotions had errors. It can be seen that 12.73% of songs (21 songs) were misclassified into calm in Figure 4(b). This indicates that the calm problem should be solved first. The result in Figure 4(c) and (d) is better than Figure 4(a) and (b). Most diagonal elements were well classified. In the case of GMM in the Cartesian coordinate system, 12.8 songs on average were classified correctly. However, there is still a concentration of misclassification in some emotions such as angry (4 songs), sad (5 songs), and sleepy (2 songs). However, SVR in the polar coordinate system showed that the imbalanced classifications were significantly reduced: the average number of correct classification was 14.2 songs, and also, misclassification was concentrated only in relaxed (2 songs) and sleepy (3 songs).
[4] L. Lie, D. Liu and Hong-Jiang Zhang: “Automatic Mood Detection and Tracking of Music Audio Signals,” IEEE Trans. on ASLP, Vol. 14(1), 2006. [5] R. E. Thayer: “The Biopsychology of Mood and Arousal,” New York: Oxford University Press, 1989. [6] Smola, Alex J., et al.: “A tutorial on support vector regression,” Statistics and Computing, Vol.14, pp.199-222, 2004. [7] J. A. Russell: “A Circumplex Model of Affect,” Journal of Personality and Social Psychology, Vol. 39, 1980. [8] Y. Feng, Y. Zhuang, Y. Pan : “Music information retrieval by detecting mood via computational media aesthetics,” Proc. of IEEE/WIC Intl. Conf., Web Intelligence, pp. 235-241, 2003.
5.2 Accuracy The results are shown in Table 3. In the experiments based on Cartesian coordinate systems, maximum accuracy was 91.52% (151 of 165 samples). By changing coordinate system into polar, the accuracy was increased to 94.55% (156 of 165 samples) using SVR and 92.73% (153 of 165 samples) using GMM.
[9] E. Cowie, et al.: “’FEELTRACE’: An instrument for recording perceived emotion in real time,” Proc. of Speech Emotion, pp. 19–24, 2000. [10] Y.H. Yang, et al.: “A regression approach to music emotion recognition,” IEEE Trans. on ASLP, Vol. 16 (2), pp. 448–457, 2008.
6. CONCLUSIONS AND FUTURE WORK
[11] “The All Music http://www.allmusic.com.
In this paper, automatic emotion recognition of music has been evaluated using various machine learning classification algorithms such as SVM, SVR and GMM. In our experiment, it is shown that the SVR-based classification in the polar coordinate system remarkably improved the accuracy of the emotion recognition from 63.03% to 94.55%. However, the GMM classification with polar coordinates only improved from 91.52% to 92.73%. For further research, more perceptual features should be considered and other classification algorithms such as fuzzy and kNN (k-Nearest Neighbor). We also plan to compare the result of machine learning (ML)-based emotion recognition with human performed arousal/valence data.
Guide,”
Available:
[12] Chih-Chung. Chang, and Lin, Chih-Jen: “LIBSVM: a library for support vector machines,” 2001. Available: http://www.csie.ntu.edu.tw/ ~cjlin/libsvm. [13] C. Krumhansl: “Cognitive foundations of musical pitch,” Oxford University Press, 1990. [14] D. Ellis, P.W. Poliner, E. Graham: “Identifying ‘Cover Songs’ with chroma features and dynamic programming beat tracking,” IEEE Conf. on ICASSP, Vol. 4, 1429-1432, 2007. [15] B. Schölkopf, et. al.: “New support vector algorithms,” Neural Computation, Vol.12, 2000. [16] A. Smola, T. Freiß, B. Schölkopf: “Semiparametric support vector and linear programming machines,” Nuero COLT TR, NC2-TR-1998-024, 1998.
7. REFERENCES [1] W. Birmingham, R. Dannenberg and B. Pardo: “An Introduction to Query by Humming with the Vocal Search System,” Communications of the ACM, Vol. 49 (8), pp. 49-52, 2006.
[17] Hsu, Chih-Wei., and Lin, Chih-Jen: “A comparison of methods for multiclass support vector machines,” IEEE Trans. on Neural Networks, Vol.13(2), pp.415-425, 2002.
[2] S. Rho, B. Han, E. Hwang and M. Kim: “MUSEMBLE: A Novel Music Retrieval System with Automatic Voice Query Transcription and Reformulation,” Journal of Systems and Software (Elsevier), Vol. 81(7), pp. 1065-1080, 2008. [3] P.N. Juslin and J.A. Sloboda: “Music and Emotion: Theory and research,” Oxford Univ. Press, 2001.
656