A Regression Approach to Music Emotion Recognition Yi-Hsuan Yang, Yu-Ching Lin, Ya-Fan Su, and Homer H. Chen, Fellow, IEEE
Abstract—Content-based retrieval has emerged in the face of content explosion as a promising approach to information access. In this paper, we focus on the challenging issue of recognizing the emotion content of music signals, or music emotion recognition (MER). Specifically, we formulate MER as a regression problem to predict the arousal and valence values (AV values) of each music sample directly. Associated with the AV values, each music sample becomes a point in the arousal-valence plane, so the users can efficiently retrieve the music sample by specifying a desired point in the emotion plane. Because no categorical taxonomy is used, the regression approach is free of the ambiguity inherent to conventional categorical approaches. To improve the performance, we apply principal component analysis to reduce the correlation between arousal and valence, and RReliefF to select important features. An extensive performance study is conducted to evaluate the accuracy of the regression approach for predicting AV values. The best performance evaluated in terms of the R2 statistics reaches 58.3% for arousal and 28.1% for valence by employing support vector machine as the regressor. We also apply the regression approach to detect the emotion variation within a music selection and find the prediction accuracy superior to existing works. A group-wise MER scheme is also developed to address the subjectivity issue of emotion perception. Index Terms— Music emotion recognition (MER), arousal, valence, regression, support vector machine.
M
I. INTRODUCTION
USIC plays an important role in human’s history, even more so in the digital age. Never before has such a large collection of music been created and accessed daily by people. As the amount of content continues to explode, the way music information is organized has to evolve in order to meet the ever increasing demand for easy and effective information access. Music classification and retrieval by emotion is a plausible approach, for it is content-centric and functionally powerful. Emotion recognition from music signal is a challenging task due to the following reasons. First, emotion perception is Manuscript received December 15, 2006; revised May 25, 2007. This work was supported in part by grants from Intel and the National Science Council of Taiwan under contracts NSC 94-2219-E-002-016 and NSC 94-2725-E-002-006-PAE. Y.-H. Yang, Y.-C. Lin, and Y.-F. Su are with the Graduate Institute of Communication Engineering, National Taiwan University, Taipei, Taiwan (email:
[email protected],
[email protected],
[email protected]). H.-H. Chen is with the Graduate Institute of Communication Engineering, the Graduate Institute of Networking and Multimedia, and the Department of Electrical Engineering, National Taiwan University, Taipei, Taiwan 10617, R.O.C. (email:
[email protected]).
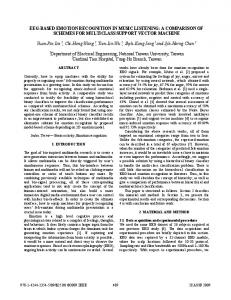
Fig. 1. Thayer’s arousal-valence emotion plane.
intrinsically subjective and people can perceive different emotions for the same song. This subjectivity issue makes the performance evaluation of an MER system fundamentally difficult because a common agreement on the classification result is hard to obtain. Second, it is not easy to describe emotion in a universal way because the adjectives used to describe emotions may be ambiguous, and the use of adjectives for the same emotion can vary from person to person. Third, it is still inexplicable how music evokes emotion. What intrinsic element of music, if any, creates a specific emotional response in the listener is still far from well-understood. To uncover the relationship between music and emotion, many previous works [1]–[8] have categorized emotions into a number of emotion classes and applied the standard pattern recognition procedure to train a classifier. The methods described in [1], [2] adopt the basic emotions such as happy, angry, sad and fear as the emotion classes, whereas the methods described in [3]–[8] recognize the ambiguity of adjectives and define the emotion classes in terms of arousal (how exciting or calming) and valence (how positive or negative). For example, the emotion classes can be divided into the four quadrants in Thayer’s arousal-valence emotion plane [12], Fig. 1. However, even with the emotion plane, the categorical taxonomy of emotion classes is still inherently ambiguous. Each emotion class represents an area in the emotion plane, and the emotion states within each area may vary a lot. For example, the first quadrant of the emotion plan contains emotions such as excited, happy, and pleased, which are different in nature. This ambiguity confuses the subjects in the subjective test and confuses the users when retrieving a music piece according to their emotion states.
An alternative is to view the emotion plane as a continuous space and recognize each point of the plane as an emotion state. In this way, the ambiguity associated with emotion classes or adjectives can be successfully avoided since no categorical classes are needed. This continuous perspective has been adopted by psychologists to model the emotional response of the subjects [13], [14]. In [15], the software ‘FEELTRACE’ is developed to let subjects track the emotion content of a stimulus (such as speech, music, or video) as they perceive it over time. However, a major issue of the continuous perspective is that arousal and valence are not necessarily independent and can in fact impact each other. Whether the emotion states should be modeled as categories or continua has been a debate in psychology, and either perspective has its pros and cons. For MER, the continuous perspective is considered more appropriate since it resolves the ambiguity issue. Specifically, with the continuous approach, we first compute the arousal and valence values (AV values) of each music sample and view the music sample as a point in the emotion plane. Then the user can retrieve music by specifying a point in the emotion plane according to his/her emotion state, and the system would return the music pieces whose locations are closest to the specified point. In this way, apparently, the efficiency and accuracy of music retrieval is much improved. The viability of the continuous approach heavily lies in the prediction accuracy of the AV values. Since automatic calculation of the AV values (AV computation) is still at its early stage, and the performance of existing approaches [8]–[11] is unsatisfactory in many aspects (see Section II), a primary task of this paper is to develop an effective method for AV computation. We propose to formulate MER as a regression problem and use regression techniques to directly predict the AV values of music samples from the extracted features. This computational algorithm has sound theoretical basis, allows thorough performance study, and generally exhibits reliable prediction performance. The other main issue, the dependency between arousal and valence, is addressed by reducing the data correlation by principal component analysis [16]. An extensive performance study is conducted to evaluate the prediction accuracy of the proposed regression approach by using different combination of data spaces, feature spaces, and regression algorithms. Support vector regression [18] is found to produce better prediction accuracy than linear regression [17] and AdaBoost.RT [20]. The R2 statistics [17] reaches 58.3% for arousal and 28.1% for valence. Because there are no other existing systems viewing MER from a continuous perspective, we apply the regression approach to detect the emotion variation within music selections and find it is superior to the one proposed in [10]. In summary, the primary contributions of the paper include: z To our best knowledge, this work represents one of the first attempts that develop an MER system from a continuous perspective and represent each song as a point in the emotion plane. This approach is free of the ambiguity issue of MER.
TABLE I COMPARISON OF WORKS ON MUSIC EMOTION Field MER [1]–[8]
Perspective categorical
MEVD [8]–[11]
continuous
MER (this work)
continuous
z
z
z
Description Classifying music selections into several classes based on emotion. Detecting the emotion variation within a music selection. Representing each music selection as a point in the emotion plane.
A novel AV computation method based on the regression theory is proposed. Principal component analysis [16] is employed to reduce the data correlation, and RReliefF [22] is utilized for feature selection (Sections III and IV). An extensive performance study is conducted to demonstrate the accuracy and effectiveness of the regression approach for both music emotion recognition and music emotion variation detection (Section V). A group-wise MER scheme is proposed to solve the subjectivity issue of MER (Section VI). II. RELATED WORKS
Despite a great deal of effort has been made for MER in recent years [1]–[8], little attention has been paid to view the emotion plane from a continuous perspective. Some exceptions can be found in the music emotion variation detection (MEVD) field [8]–[11], where the emotion content of music is quantified as a time-varying continuous variable, and some statistical methods are developed to predict the emotion variation. However, detecting the emotion variation is different from representing each song individually as a point in the emotion plane. Our work represents one of the first attempts pioneering this novel perspective. See Table I for a comparison. In the following we give brief review of existing AV computation methods and illuminate the rational of adopting the regression approach rather than these methods. A. Arousal and Valence Modeling (AV modeling) To detect the emotion variation in video sequences, AV modeling is proposed in [9] to compute the AV values. The arousal and valence models are weighted combinations of some component functions that are computed along the timeline. The resulting arousal and valence curves are combined to form an affective curve, making it easy to trace the emotion variation of video content and to identify the segments with high emotional content. The component functions used for arousal are the motion vectors between consecutive video frames, the changes in shot lengths, and the energy of sound. Valence is modeled by the pitch of sound. Although AV modeling is based on some psychological understandings and the adopted features are intuitively related to emotion perception, it is difficult to evaluate the performance quantitatively due to lack of theoretical foundation. A rigorous approach that allows performance study is more favorable. Furthermore, unlike video, there are fewer salient music features that have strong link to emotion perception.
B. The Fuzzy Approach In [8], emotion classes are divided into four quadrants in the emotion plane (see Fig. 1), and each input sample is assigned a fuzzy vector indicating the relative strength of each class by fuzzy classifiers [24], [25]. For example, a fuzzy vector μ of four emotion classes is expressed as:
μ = {μ1 , μ2 , μ3 , μ 4 } ,
∑ i=1 μi = 1 4
TABLE II COMPARISON OF THE EXISTING METHODS FOR AV COMPUTATION
AV modeling [9]
Video
N/A
Temporal information No need
Fuzzy [8]
Music
N/A
No need
Need
System ID [10]
Music
78.4% (a) 21.9% (v)
Need
No need
Name
Field
(1)
where μi ≥ 0 is the relative strength of class i. The final decision of classification is the class with the maximal strength. Given a fuzzy vector, the fuzzy approach exploits the geometric relationship of the four emotion classes and computes the AV values by the following transformation:
a = μ1 + μ2 − μ3 − μ 4 ,
(2)
v = μ1 + μ 4 − μ 2 − μ3 ,
(3)
where a denotes arousal and v denotes valence. However, the transformation involves emotion classes that are not necessarily independent of, and orthogonal to, each other. Since the geometric relationship between arousal and valence is inexact, it is improper to perform arithmetic operations on the AV values. Besides, similar to AV modeling, the fuzzy approach is short of a quantitative performance evaluation mechanism for lack of ground truth. C. The System Identification Approach (System ID) A systematic approach for MEVD is proposed in [10], where the system identification technique is utilized to model the music emotion as a function of 18 musical features. The ground truth data are collected every second, so the music selections are also segmented every second before feature extraction is performed. Six western classical music selections of various moods form the dataset. Results demonstrate that system identification provides a means to the generalization of the emotional content for a genre of music (western classical music), and the reported average R2 statistics [17] is 78.4% for arousal and 21.9% for valence. However, the system ID approach, as well as the time series analysis approach proposed earlier by Schubert [11], computes the AV values by exploiting the temporal relationship between music segments, which is absent for MER. A comparison of the reviewed methods in terms of the ability to compute the AV values is summarized in Table II. To sum up, a robust AV computation algorithm should have a sound theoretical foundation and allows quantitative performance study. Among the reviewed methods, only the system ID approach embeds a theoretical structure, yet it utilizes the temporal information which is not available for MER. In addition, the computation of AV values should be made without applying any geometric operation between arousal and valence due to their inexact relationship. It is also favorable to have the computation algorithm directly predict real values (i.e., arousal or valence) from extracted features.
Accuracy
Geometric operation No need
III. THE REGRESSION APPROACH Regression theory is a well-studied theory aiming at predicting a real value from observed variables (or features). It has a sound theoretical foundation, allows easy performance analysis and optimization, and generally provides reliable prediction performance [17]. Besides, no temporal information or geometric operation is needed. Therefore, formulating MER as a regression problem seems to be a promising approach. Below we first describe how the formulation is made, then present the system description in detail. The performance study of the regression approach is reported in Section V. Given N inputs (xi, yi), 1≤ i ≤N, where xi is a feature vector for the ith input sample, and yi ∈ \ ( \ denotes a set of real values) is the real value to be predicted for the ith sample, the regression system trains a regression algorithm (regressor) R( ⋅ ) such that the mean squared error ε is minimized [17]:
ε=
1 N
∑
N i =1
( yi − R ( xi )) 2 ,
(4)
where R(xi) is the prediction result for the ith sample. Since the AV values are viewed upon as real values from the continuous perspective, the regression theory can be well applied to directly predict arousal and valence. To formulate MER as a regression problem, the following considerations are taken into account: 1) Domain of \ : The Thayer’s emotion plane is viewed as a coordinate space spanned by arousal and valence, where each value is confined within [–1, 1]. 2) Ground truth: The ground truth is set via a subjective test by averaging the subjects’ opinions about the AV values of each music sample (see Section IV.C). 3) Feature extraction: The extracted features need to be relevant to emotion perception for the regressor to be accurate (see Sections IV.B and V.C). 4) Regression algorithm: Although regression theory has been well studied and many good regressors are readily available [17], the performance of a regressor is case dependent. A number of regressors should be adopted and compared to find the best one (see Section IV.D). 5) Number of regressors: Since we want to predict both arousal and valence, two regressors are required and are referred to as RA and RV . 6) Training fashion: As mentioned in Section I, there is a certain degree of dependency between arousal and valence. Therefore, apart from training RA and RV solely
independently, we need to study whether the prediction accuracy is improved if the dependency of the AV values is considered (see Section V.B). IV. SYSTEM DESCRIPTION Our MER system represents each music selection as a point in the emotion plane and provides a friendly user interface for music retrieval and management. The system diagram is shown in Fig. 2, and the details are described below. A. Data Collection and Preprocessing The music database is made up of 195 popular songs selected from a number of Western, Chinese, and Japanese albums [8]. Two criteria are used in the selection: 1) These songs should be distributed uniformly in each quadrant of the emotion plane. 2) Each music sample should express a certain dominant emotion. Note the genre of our database is popular music of different countries rather than the western classical music, which is commonly adopted in previous works [2]–[5], [10], [11]. Western classical music is often chosen because it is much easier to gain agreement on perceived emotion and thus has less subjectivity issue [3]. However, since the purpose of MER is to facilitate music retrieval and management in everyday music listening, and since it is the popular music that dominates the everyday music-listening, we should not shy away from the subjectivity issue by using only western classical music. More discussions on the subjectivity issue are provided in Section VI. To compare the segments fairly, the music samples are converted to a uniform format (22,050 Hz, 16 bits, and mono channel PCM WAV) and normalized to the same volume level. Besides, since the emotion within a music selection can vary over time [8]–[11], for each song we manually select a 25-second segment (mostly the chorus part) that is representative of the song and expresses a certain dominant emotion. Accordingly, we predict the emotion of a music segment, and regard the prediction result as the emotion of the entire song. Note we choose to trim music manually since the performance of existing music thumbnailing algorithms [26] are considered not robust enough. B. Feature Extraction After preprocessing, we use the spectral contrast algorithm [3], DWCH algorithm [2], and two computer programs PsySound [27] and Marsyas [29] to extract musical features and construct a 114-dimension feature space, which is referred to as ALL hereafter. The extracted features, which are described in detail below, have been used for MER in pervious works. See Table III for denotations and brief descriptions. As the name indicates, PsySound aims to model parameters of auditory sensation based on some psychoacoustic models [27], [28]. Four types of measures are output by PsySound: loudness, level, dissonance, and pitch. Loudness measures include loudness, sharpness (sound brightness), and timbral width (sound flatness). Level measures include sound pressure level, background noise level etc. Dissonance measures are related to the perception of short irregularities in a sound; any note in music that does not fall within the prevailing harmony is considered dissonant. Pitch measures are related to the perceived fundamental frequency of a sound. Because of this
Fig. 2. System diagram of the proposed regression approach. Left: training phase; right: testing phase. RA denotes the regressor for arousal, and RV denotes the regressor for valence.
psychoacoustical foundation, the features extracted by PsySound have been found much related to emotion perception, especially 15 of them [8]. Therefore, we utilize these 15 features to form a second feature space called Psy15. See Table IV for the description of Psy15. Marsyas is a free software framework for rapid development and evaluation of computer audition applications [29]. It generates 19 timbral texture features (spectral centroid, spectral rolloff, spectral flux, time domain zero-crossing and MFCC), 6 rhythmic content features (by beat and tempo detection) and 5 pitch content features (by multi-pitch detection). Spectral centroid, spectral rolloff, and spectral flux describe spectral shape properties, zero-crossing measures the noisiness of the signal, and MFCC (Mel-frequency cepstral coefficient) is a non-musical pitch scale commonly used in speech and audio signal processing. Spectral contrast features capture the relative spectral information in each subband and utilize the spectral peak, spectral valley, and their dynamics as features [3]. The spectral contrast features also roughly reflect the relative distribution of the harmonic and non-harmonic components in the spectrum. The DWCH (Daubechies wavelets coefficient histogram) features are computed from histograms of Daubechies wavelet coefficients at different frequency subbands with different resolutions. As [2] states, due to the use of wavelet technique, DWCH features have better ability in representing both local and global information than traditional features. PsySound and Marsyas are available on-line [27], [29], whereas spectral contrast and DWCH can be easily implemented in Matlab. Default values of the parameters as described in the original papers are adopted. Specifically, the analysis window for frame-level features is 23 ms (512 samples at 22,050 Hz sampling rate), and the frame-level features are integrated to clip-level features by the MeanVar model [30], which models each frame-level feature as a Gaussian distribution and represents the feature by mean and variance. All features are linearly normalized to [0, 1].
C. Subjective Test The subjective test sets the ground truth of the AV values. 253 volunteers are recruited from the campus. Each of them is asked to listen to 10 music samples randomly drawn from the aforementioned music database and to label the AV values from –1.0 to 1.0 in 11 ordinal levels. The ground truth is set by averaging the opinions of all subjects. On the average, each music sample is labeled by more than 10 subjects. Note the subjects are asked to label the emotion based on their feelings of what the music sample is trying to evoke, rather than the emotion the subjects perceive at the test. We must make this distinction clear because perceived emotion and evoking emotion are not always the same. For example, a person who enjoys sorrowful tone might feel pleased when listening to sorrowful songs. Since MER is developed to help people retrieve music samples through a coordinate in the emotion plane, it is more natural and adequate that the AV values of a song are correspondent with the evoking emotion. No limitations on the background (e.g. psychology expertise, musicianship, etc) are imposed when recruiting subjects since the MER system is expected to be applicable to every common people. However, because music emotion recognition is still new to all subjects, we need to inform them the essence of the emotion model, the purpose of the experiment, and the following rules of the subjective test: 1) Label the evoking emotion rather than the perceived one. 2) Express the general feelings in response to melody, lyrics, and singing (vocal) of the song. We do not attempt to ignore the influences of the lyrics and singing even though the related features are not considered so far. 3) No limitation is given to the total duration of the labeling process. The subjects are allowed to listen to the music samples more than once to ensure the labels can truly reflect their feelings (typically the total duration of the labeling process is less than 15 minutes). 4) Music emotion perception is in nature subjective. The subjects are free to annotate personal feeling. The quality of the ground truth is central to the system performance. An evaluation of the consistency of the ground truth data is described in Section V.A. D. Regressor Training The 195 (xi, yi) inputs from feature extraction and subjective test are then used to train the following three regression algorithms: multiple linear regression (MLR) [17], support vector regression (SVR) [18], and AdaBoost.RT (BoostR) [20]. MLR is a standard regression algorithm which assumes a linear relationship between variables and estimates the linear relationship by a least squares estimator. We treat MLR as the baseline approach for its simplicity. Comparatively, SVR nonlinearly maps input feature vectors to a higher dimensional feature space by the kernel trick, and yields prediction functions that are expanded on a subset of support vectors [18]. As its name indicates, SVR is an extension of the famous support vector classification, which has been found in many cases superior to existing machine
TABLE III THE ADOPTED FEATURE EXTRACTION ALGORITHMS Method
Number of feature
Description
PsySound [27] (P)
44
Extracts features including loudness, level, pitch multiplicity, and dissonance based on psychoacoustic models.
Marsyas [29] (M)
30
Extracts timbral texture, rhythmic content and pitch content features. It has been shown useful in music genre classification.
Spectral contrast [3] (SC)
12
Represents the relative characteristics of each spectral subband, and reflects the distribution of harmonic components.
DWCH [2] (D)
28
Daubechies wavelets coefficient histogram, which has better ability in representing both local and global information.
Total (ALL)
114
TABLE IV THE 15 PSYSOUND FEATURES (PSY15) RECOMMENDED IN [8] Feature
Description
1
Spectral Centroid
The centroid of spectral density function.
2
Loudness
Human perception of sound intensity.
3, 41
Sharpness
A pitch-like (low-high) aspect of timbre.
5
Timbral Width
The flatness of a loudness function.
6
Volume
Human perception of the size of sound.
7, 81
Spectral Dissonance
Roughness of all spectrum components.
9,101
Tonal Dissonance
Roughness of just the tonal components.
11
Pure Tonal
The audibility of the spectral pitches.
12
Complex Tonal
The audibility of the virtual pitches.
13
Multiplicity
The number of pitches heard.
14
Tonality
Major-minor tonality, e.g., A major.
15
Chord
Musical pitches sounded simultaneously. 1
Two algorithms are used to extract the feature.
learning methods. A number of previous works have adopted support vector classification for MER and reported excellent classification performance [2], [4], [6]. BoostR is another nonlinear regression algorithm in which a number of regression trees are trained iteratively and weighted according to the prediction accuracy. After the iterative process, the prediction result of each regression tree is combined (weighted mean) to form the final hypothesis. The basic underlining concept of the boosting process is based on the observation that finding a number of weak predicting rules is much easier than finding a single, highly accurate one [20]. Boosting algorithms, which are the state-of-the-art methods for face detection [21], have been successfully applied in many machine learning problems. E. Emotion Visualization Associated with the AV values, each music sample is visualized as a point in the emotion plane, and the similarity between music samples can be estimated by computing the Euclidean distance in the emotion plane. A user interface that supports music retrieval/recommendation by specifying a point in the emotion plane can be realized without further labeling the
unseen music samples (different from that of Musicovery [31]). Such a user interface can be of great use in managing large scale music databases.
150
150 arousal valence
100
arousal 100
valence
V. PERFORMANCE STUDY We run a series of experiments to evaluate the performance of the regression approach. Different ground truth data spaces, feature spaces, and regression algorithms are compared in terms of the R2 statistics, which is a standard way for measuring the goodness of fit for regression models [17], R2 = 1 −
Nε
∑ i=1 ( yi − y )2 N
,
(5)
where y is the mean of the ground truth, and the normalization of the total squared error (N ε ) by the energy of the ground truth makes R2 comparable between experiments. R2 is often interpreted as the proportion of underlying data variation that is explained by the fitted regression model [32]. An R2 of 1.0 means the model perfectly fits the data, while a negative R2 means the model is even worse than simply taking the sample mean. However, the kind of the R2 statistics that is satisfactory is case-dependent. We evaluate the performance of regression by the 10–fold cross validation technique [16], in which the whole dataset is randomly divided into 10 parts, 9 of them for training and the remaining one for testing. The above process is repeated 20 times before we compute the average result. R2 for each data dimension (say, arousal and valence) is computed separately. A. Consistency Evaluation of the Ground Truth We evaluate the consistency of the ground truth in two ways. First, the consistency of annotations given by different subjects for the same song is evaluated by the standard deviation of annotations. Since the ground truth is obtained by averaging subjects’ annotations, the larger the standard deviation is, the less representative the ground truth can be. Fig. 3(a) shows the histogram of standard deviations for arousal and valence in the first course of the subjective test. We can see that most standard deviations of music samples are about 0.3, which give rise to a 95% confidence interval [32] of roughly ±0.2 (sample size is 10 since each music sample is labeled by more than 10 subjects). On a range of –1.0 to 1.0, a range of 0.4 is not that big, yet it reflects the subjectivity issue mentioned in Section I. Second, we evaluate whether the annotations given by the same subject are similar after a span of time by conducting a test-retest reliability study [33] and computing the absolute difference between corresponding annotations for the same song. The larger the absolute difference is, the less repeatable the subjective test could be. We conduct a second course of subjective test two months after the first one, and invite 22 subjects to label the music samples they labeled in the first course again. Fig. 3(b) shows the histogram of absolute difference for arousal and valence of 220 (22 × 10) data pairs in the test-retest stability study. We can see that more than one half of the
50
50
0
0 0.1
0.2
0.3
0.4
0.5
0.6
Standard deviation
(a)
0.1
0.2
0.3
0.4
0.5
0.6
Absolute difference
(b)
Fig. 3. (a) Histogram of standard deviations for arousal and valence of 195 songs in the first course of subjective test. (b) Histogram of absolute difference for arousal and valence of 220 data pairs in the test-retest stability study.
absolute differences fall below 0.1, showing the annotations given by the same person are quite similar. In summary, while Fig. 3(b) shows that the subjective test by the same person is repeatable, Fig. 3(a) shows a certain degree of inconsistency in the ground truth data. The inconsistency is reasonable because music perception is subjective in nature. However, it should be noted that the consistency can be improved if we personalize the MER system, or, in a similar sense, reduce the individual differences of the subjects by grouping them according to individual factors. See Section VI for more discussions. Using the absolute difference of test-retest reliability, we can compute an upper bound of R2 for the regression approach: 80.5% for arousal and 58.6% for valence. This approximated upper bound defines both the viability of the regression approach and the kind of R2 that is reasonable for the regression approach. The low upper bound for valence is not surprising since, as [11] and many previous works on MER have pointed out, generally arousal is much easier to model than valence. There are two main reasons, which are actually related to each other, for this phenomenon. First, while there are a number of features relevant to arousal such as loudness (loud/soft), tempo (fast/slow), and pitch (high/low), there are few salient features for valence. Second, the perception of valence is more subjective than that of arousal; there is a good chance that people perceive opposite valence for the same song. B. Data Space As mentioned in Section I, a major issue of the continuous perspective is the dependency between the two dimensions arousal (a) and valence (v) in the arousal-valence (denoted as AV) data space. The Pearson's linear correlation coefficient between a and v in our dataset can reach 0.3368; therefore, it is interesting to see whether the performance of regression can be improved by reducing the data correlation first. A common method for reducing the correlation between variables is the principal component analysis (PCA) [16], which entails the computation of a loading matrix L to transform original data Y to principal components U such that
U = L(Y − mean(Y )) , Y = L−1U + mean(Y ) ,
(6) (7)
where U is the representation of Y in the principal component
C. Feature Space From the machine learning point of view, features are not necessarily of equal importance or quality, and irrelevant or redundant features may lead to inaccurate conclusion. Although domain knowledge helps identify good features, there is only limited understanding of how music evokes emotion. One solution for addressing this problem is to extract a number of musical features and then use a feature selection algorithm (FSA) to identify good features [23]. The purpose of FSA is to find the optimal feature subset that gives the maximal prediction accuracy and keeps the feature dimension minimal. For its simplicity and effectiveness, RReliefF [22] is adopted in our work. It evaluates the features one by one and assigns a real number to each feature to indicate its importance. Because RReliefF takes feature interrelationship into account, it is better than other statistical measures such as correlation coefficient, information gain, and signal to noise ratio [22]. We run RReliefF for each data space and rank the features by importance. Then we run SVR with the top–m and top–n selected features for the two dimensions in each data space to decide the best combination of m and n that lead to minimal ε . The top–m and top–n selected features form the third feature space RRFm,n. The best feature dimensions m and n of RRF, along with the adopted feature spaces, are summarized in Table V. We show the comparison of ε using different feature dimensions for AV and PC in Fig. 4, and list the top five RRF features for AV in Table VI. From Table VI, we can see that the top features for arousal are related to spectral shape and pitch, and the top features for valence are more related to rhythmic (beat and tempo) and pitch properties of sound. Note for valence, the combination of the first three features gives rise to the minimal mean squared error. Among them, spectral dissonance (computed using Sethares’ algorithm [27]) is related to the noisiness of the spectrum, tonality is related to pitch, whereas the overall sum of beat histogram is related to tempo. It is also observed that energy-related features are not much relevant to arousal, a phenomenon that may result from the normalization of sound volume. D. Performance Evaluation of Regressor We first evaluate the prediction accuracy of different regression algorithms in terms of R2. The implementation of SVR is based on the library LIBSVM [19], along with a grid parameter search to find the best parameters. BoostR is implemented in Java language. The threshold φ for demarcating correct and incorrect predictions are empirically determined as 0.1, and the number of iterations is 30. MLR can be easily
TABLE V THE FEATURE SPACES USED IN THE PERFORMANCE STUDY Name
Dimension
Description
ALL
114 / 114
Use the features in Table III.
Psy15
15 / 15
Use the features in Table IV.
RRFm,n
AV: 8 / 3 PC: 18 / 15
Root mean squared error
space. By PCA, we are able to transform the original data space AV to the principal component space (denoted as PC) where the correlation between the two resulting dimensions is reduced to nearly zero. Therefore, besides training RV and RA, we train another two regressors Rp and Rq in the PC space (where p and q denote the two dimensions of PC), and then transform the data space of the prediction results back to AV by (7). Though Rp and Rq are also trained independently as RV and RA, the underlying dimensions p and q are nearly uncorrelated.
Features selected from ALL by RReliefF, the dimension is selected to minimize ε.
0.4
AV-v AV-a
0.35
PCA-p PCA-q
0.3 0.25 0.2 0.15
1 2 3 4 5 6 7 8 9 10 11 Feature dimension Fig. 4. Comparison of the root mean squared error using different feature dimensions for AV and PC. The features are the top ones selected by RReliefF. TABLE VI TOP FIVE SELECTED FEATURES BY RRELIEFF FOR AV AND PC DATA SPACES Arousal Name
Extractor
Valence Weight
Name
Extractor
Weight
stdFlux
M
0.0123
spectral diss(S)
P*
0.0223
tonality
P*
0.0115
tonality
P*
0.0210
multiplicity
P*
0.0095
sum of beat hist
M
0.0167
meanFlux
M
0.0093
chord
P*
0.0129
meanRolloff
M
0.0092
sum of pitch hist
M
0.0108 *
Psy15 features.
implemented in Matlab. We run each of the regressor with the same configuration: the data space is AV and the feature space is Psy15. Result shown in the first three rows of Table VII indicates that the R2 of SVR reaches 57.0% for arousal and 22.2% for valence, representing the most prominent prediction accuracy among the three, and BoostR exhibits prediction accuracy similar to the baseline method MLR. Consequently, we employ SVR as the regressor in the following experiments. E. Performance Evaluation of Data Space and Feature Space Next, we compare the R2 of various combinations of data spaces and feature spaces using SVR as the regressor. Result shown in Table VIII indicates: 1) The best combination of data and feature space by summing the R2 of arousal and valence directly is PC+RRF18,15, and the resulting R2 reaches 58.3% for arousal and 28.1% for valence. 2) Transforming the data to PC does not make significant difference to the prediction accuracy. This is interesting, since reducing the correlation between arousal and valence seems to have little influence. One possible reason to this phenomenon is that subjects can independently
annotate arousal and valence to a certain extent, but it remains to validate this argument more rigorously. 3) Selecting features by RRF greatly improves the accuracy (especially for valence), which shows the importance of feature selection. Generally the performance of adopted feature spaces is: RRF > Psy15 > ALL. 4) Using Psy15 as the feature space rather than ALL does not exhibit evident accuracy improvement for PC, which may be reasonable because the psychoacoustic meaning of the Psy15 features might be lost in the principal space. 5) Recall when we use AV+RRF, only 3 features are used to predict valence (see Table V); however, the reported R2 25.4% is high enough compared to the best one 28.1%. This finding implies most of the 114 extracted features may not be so relevant to valence. We also show the distributions of ground truth and prediction result for PC+RRF18,15+SVR in Fig. 5. It can be observed that the aggregated distributions are quite similar. Fig. 6 is obtained from in Fig. 5 by connecting predicted values to the corresponding ground truth values with lines. In summary, the best performance of the regression approach reaches 58.3% for arousal and 28.1% for valence by using PC+ RRF18,15+SVR. This performance is considered satisfactory since it meets over half the upper bound estimated from the test-retest reliability study with less than 20 features for both arousal and valence (see the last two rows of Table VII). To our best knowledge, there has been little previous work viewing MER from a continuous perspective. Therefore, in the next section we apply the regression approach to MEVD and compare our performance against the system ID approach [10], which has reported quantitative performance analysis and made dataset publicly available. F. Performance Evaluation for MEVD To have a fair comparison, we apply the regression approach to MEVD by using the same ground truth data and feature data described in [10], where 6 classical music selections are segmented every second, and 18 musical features are extracted (17 of them are extracted by PsySound and Marsyas). The R2 reported in [10] is 78.4% for arousal and 21.9% for valence. We use SVR to predict the AV values for each one-second segment and compute the average R2 statistics. Result (64.8% for arousal and 52.9% for valence) shown in Table IX indicates the regression approach outperforms the system ID approach in a great extent for valence prediction and achieves comparable result for arousal prediction. This performance is remarkably good since the regression approach does not exploit any temporal information embedded in the time sequence. This experiment demonstrates the effectiveness of the regression approach for AV computation and shows the regression approach can be applied on MEVD as well. VI. DISCUSSION ON THE SUBJECTIVITY ISSUE The paper has focused on solving the ambiguity issue. In this section, we discuss the ability of the regression approach to deal with the subjectivity issue.
Fig. 5. Distributions of ground truth (blue point) and prediction result (red circle) for PC+RRF18,15+SVR. It can be observed that the distributions are similar. For a closer look, see Fig. 6. TABLE VII THE R2 STATISTICS FOR DIFFERENT COMBINATION OF DIFFERENT METHODS, DATA SPACES, AND FEATURE SPACES Method
Data Space
Feature Space
R2 statistics a v 56.8% 10.9%
MLR
AV
Psy15
BoostR
AV
Psy15
55.3% 11.7%
SVR
AV
Psy15
57.0% 22.2%
PC
RRF18,15
58.3% 28.1%
N/A
80.5% 58.6%
SVR Test-retest
1
N/A 1
The upper bound estimated in Section V.A.
TABLE VIII THE R2 STATISTICS OF SVR WITH DIFFERENT DATA AND FEATURE SPACES ALL a
v
Psy15 a v
RRF a
v
AV
58.6% 14.6%
57.0% 22.2%
60.9% 25.4%
PC
60.2% 16.2%
58.5% 18.1%
58.3% 28.1%
TABLE IX THE R2 STATISTICS FOR MEVD USING THE SAME DATA AS [10] Method System ID SVR
Data 6 classical music annotated in the AV space As above
Feature 11 PsySound features + 6 Marsyas features + beats per minute As above
R2 statistics a v 78.4% 21.9% 64.8% 52.9%
The subjectivity issue stems from the fact that music perception is intrinsically subjective and is under the influence of many factors such as cultural background, generation, sex, and personality. Therefore, as pointed out in [8], typical categorical approaches that simply assigning one emotion class to each song in a deterministic manner does not perform well in practice. Since the regression approach represents each song as a point in the emotion plane and thus offers more freedom in describing emotion, the prediction result is less deterministic. Besides the quadrant to which the song belongs, one can further know the emotion intensity by inspecting the AV values. This result is obviously more reasonable and informative. Despite that it has more freedom in describing a song, the regression approach may fail to exactly resolve the subjectivity
Subjective test
User information collection
Regressor training Regressors choosing Collection of Regressors
GWMER
Fig. 7. The GWMER scheme. A number of group-wise regressors are trained based on the user opinions of different homogeneous user groups. Because the individual difference is reduced by grouping users, the subjectivity problem is believed to be alleviated. When a new user comes to use the MER system, his/her user information is first collected, and then the appropriate RA and RV are chosen to respond to the user. Fig. 6. Distributions of ground truth values (blue stars) with lines connecting to the corresponding predicted values (red circles) by PC+RRF18,15+SVR For space limitation, only 100 songs are shown.
issue since personal difference in the perception of popular music is too high, and since the regressors are trained based upon the average opinions of the subjects. It remains needed to address the subjectivity issue more effectively. We develop a group-wise MER scheme (GWMER) to resolve this issue. The main idea is to divide the users into a variety of user groups and train regressors for each group. The groups can be defined according to user information [34], [35] such as generation, sex, occupation, personality, etc, to reduce the individual differences for each group. The training process is similar to what we describe in Section IV except that the subjects are specified according to the target user group. The number of necessary subjects grows proportionally with the number of defined groups. After a collection of regressors have been trained, we can choose the most suitable RA and RV to respond to each user according to his/her personal information. In this way, the effect of a great number of individual factors is eliminated. See Fig. 7 for the system diagram. Personalization offers an alternative way to resolve the subjectivity issue. However, building a personalized MER system is difficult because emotion perception may be too subtle to be understood and described quantitatively. Another issue for the personalization is the extra user burden. GWMER represents a compromise between the general MER system presented in this paper and a personalized one. It can alleviate the subjectivity issue without resorting to too much user burden. Further investigation is worthwhile.
The accuracy of the AV computation determines the viability of the MER system. We formulate MER as a regression problem and adopt the support vector regression for direct estimation of the AV values. Comparing to existing AV computation algorithms, the regression approach has a sound theoretical foundation, exhibits promising prediction accuracy, and needs no temporal information or geometric operations. Through an extensive performance study on the selection of data space, feature space, and regressor, we have demonstrated the effectiveness of the regression approach. The R2 statistics reaches 58.3% for arousal and 28.1% for valence. We have also shown that the regression approach can be applied to MEVD and that it outperforms the approach proposed in [10]. Since arousal and valence may be dependent, we apply principal component analysis on the ground truth data to reduce the data correlation. The resulting little accuracy improvement implies the subjects can label arousal and valence quite independently. We also employ RReliefF to select features and find the accuracy greatly improved. Future work will focus on exploiting features about lyrics and singing of a song, evaluating the regression approach on a large-scale database, and realizing the GWMER scheme to further address the subjectivity issue. ACKNOWLEDGMENT The authors would like to thank the reviewers for valuable comments that greatly improve the quality of this paper. REFERENCES
VII. CONCLUSION
[1]
In this paper, a music selection is quantified as a point in the arousal-valence emotion plane. This continuous view of music emotion makes the proposed MER system free of the inherent ambiguity issue from which conventional categorical approaches suffer. In addition, because there is more freedom in describing a song, the subjectivity issue is alleviated to some extent.
[2] [3] [4] [5]
Y. Feng, Y. Zhuang, and Y. Pan, “Popular music retrieval by detecting mood,” Proc. ACM SIGIR, pp. 375–376, 2003 T. Li and M. Ogihara, “Content-based music similarity search and emotion detection,” Proc. Int. Conf. Acoustic, Speech, and Signal Processing, Toulouse, France, pp. 17–21, 2006. L. Lu, D. Liu, and H.-J. Zhang, “Automatic mood detection and tracking of music audio signals,” IEEE Trans. Audio, Speech, and Language Processing, vol. 14, no. 1, pp. 5–18, 2006. M.-Y. Wang, N.-Y. Zhang, and H.-C. Zhu, “User-adaptive music emotion recognition,” Proc. Int. Conf. Sig. Processing, pp. 1352–1355, 2004. T.-L. Wu and S.-K. Jeng, “Extraction of segments of significant emotional expressions in music,” Proc. Int. Workshop on Computer Music and Audio Technology, pp. 76–80, 2006.
[6] [7] [8] [9] [10]
[11] [12] [13] [14] [15]
[16] [17] [18] [19] [20] [21] [22] [23] [24] [25] [26] [27] [28] [29] [30]
D. Yang and W. Lee, “Disambiguating music emotion using software agents,” Proc. Int. Conf. Music Information Retrieval, pp. 52–58, 2004. V. Carvalho and C. Chao, “Sentiment retrieval in popular music based on sequential learning,” Proc. ACM SIGIR, 2005. Y.-H. Yang, C.-C Liu, and H. H. Chen, “Music emotion classification: A fuzzy approach,” Proc. ACM Multimedia, Santa Barbara, USA, pp. 81–84, 2006. A. Hanjalic and L.-Q. Xu, “Affective video content representation and modeling,” IEEE Trans. Multimedia, vol. 7, no. 1, pp. 143–154, 2005. M. D. Korhonen, D. A.Clausi, and M. E. Jernigan, “Modeling emotional content of music using system identification,” IEEE Trans. Systems, Man., and Cybernetics, vol. 36, no. 3, pp. 588–599, 2006. Data available at: http://www.sauna.org/kiulu/emotion.html. E. Schubert, “Measurement and time series analysis of emotion in music,” Ph.D. dissertation, School of Music & Music Education, Univ. New South Wales, Sydney, Australia, 1999. R. E. Thayer, The Biopsychology of Mood and Arousal, New York, Oxford University Press, 1989. P. J. Lang, “The emotion probe, ” American Psychologist, vol. 50, no. 5, pp. 372–385, 1995. J. A. Russell, A. Weiss, and G. A, Mendelsohn, “Affect grid: A single-item scale of pleasure and arousal,” Journal of Personality and Social Psychology, vol. 57, no. 3, pp. 493–502, 1989. R. Cowie, E. Douglas-Cowie, S. Savvidou, E. McMahon, M. Sawey, and M. Schröder, “‘FEELTRACE’: An instrument for recording perceived emotion in real time,” Proc. Speech and Emotion, ISCA Tutorial and Research Workshop, Newcastle, U.K., pp. 19–24, 2000. R. O. Duda, P. E. Hart, and D. G. Stork, Pattern Recognition, New York, John Wiley & Sons, Inc., 2000. A. Sen and M. Srivastava, Regression Analysis: Theory, Methods, and Applications, New York, Springer, 1990. A. J. Smola and B. Schölkopf, “A tutorial on support vector regression,” Statistics and Computing, 2004. C.-C. Chang and C.-J. Lin, “LIBSVM: a library for support vector machines,” 2001. Available at: http://www.csie.ntu.edu.tw/~cjlin/libsvm. D.P. Solomatine and D.L. Shrestha, “AdaBoost.RT: A boosting algorithm for regression problems,” Proc. IEEE Int. Joint Conf. Neural Networks, pp. 1163–1168, 2004. P. Viola and M. J. Jones, “Robust real-time face detection,” Int. Journal of Computer Vision, vol. 57, no. 2, pp. 137–154, 2004. M. R. Šikonja and I. Kononenko, “Theoretical and empirical analysis of ReliefF and RReliefF,” Machine Learning Journal, vol. 53, pp. 23–69, 2003. L. C. Molina, L. Belanche, and A. Nebot, “Feature selection algorithms: A survey and experimental evaluation,” Proc. IEEE Int. Conf. Data Mining, pp. 306–313, 2002. J. M. Keller, M. R. Gray, and J. A. Givens, “Fuzzy k-nearest neighbor algorithm,” IEEE Trans. Systems, Man, and. Cybernetics, vol. 15, no.4, pp. 580–584, 1985. D. Tran, M. Wagner, and T. Zheng, “Fuzzy nearest prototype classifier applied to speaker identification,” Proc. ESIT, 1999. N. C. Maddage, C. Xu, M. S. Kankanhalli, and X. Shao, “Content-based music structure analysis with applications to music semantics understanding,” Proc. ACM Multimedia, NY, USA, pp. 112–119, 2004. D. Cabrera, “PSYSOUND: A computer program for psychoacoustical analysis,” Proc. Australian Acoustic Society Conf., pp. 47–54, 1999. Available at: http://www.psysound.org. J. Ricard, “Towards computational morphological description of sound,” Ph. D dissertation, Univ. Pompeu Fabra, Barcelona, 2004. G. Tzanetakis and P. Cook, “Musical genre classification of audio signals,” IEEE Trans. Speech and Audio Processing, vol. 10, no.5, pp. 293–302, 2002. Available at: http://marsyas.sness.net/. A. Meng, P. Ahrendt, J. Larsen, and L. K. Hansen, “Temporal feature integration for music genre classification,” IEEE Trans. Audio, Speech, and Language Processing, vol. 15, no. 5, pp. 1654–1663, 2007.
[31] Musicovery: interactive webRadio, http://www.musicovery.com/ [32] D. C. Montgomery, G. C. Runger, and N. F. Hubele, Engineering Statistics, Wiley, 1998. [33] R. J. Cohen and M. Swerdlik, Psychological Testing and Measurement: An Introduction to Tests and Measurement, Mountain View, CA, Mayfield Publishing Company, 1996. [34] W. Chai and B. Vercoe, “Using user models in music information retrieval systems”, Proc. Int. Symp. Music Information Retrieval, 2000. [35] M. Lesaffre, M. Leman, and J.-P. Martens, “A user-oriented approach to music information retrieval,” Content-Based Retrieval, Dagstuhl Seminar Proceedings, 2006.
Yi-Hsuan Yang received the B.S degree in Electrical Engineering from National Taiwan University, Taiwan, in 2006. He is currently working toward the Ph.D. degree in the Graduate Institute of Communication Engineering, National Taiwan University. His research interests include multimedia information retrieval and analysis, human-centered computing, and affective computing. Yu-Ching Lin received the B.S degree in Electrical Engineering from National Taiwan University, Taiwan, in 2007. He is currently working toward the M.S. degree in the Graduate Institute of Communication Engineering, National Taiwan University. His research interests include music signal processing, machine learning, and affective computing. Ya-Fan Su received the B.S degree in Electrical Engineering from National Taiwan University, Taiwan, in 2007. He is currently working toward the M.S. degree in the Graduate Institute of Communication Engineering, National Taiwan University. His research interests include video content analysis, human-centered computing, and affective computing. Homer H. Chen (S’83-M’86-SM’01-F’03) received the Ph.D. degree from University of Illinois at UrbanaChampaign in Electrical and Computer Engineering. Since August 2003, he has been with the College of Electrical Engineering and Computer Science, National Taiwan University, where he is the Irving T. Ho Chair Professor. Prior to that, he had held various R&D management and engineering positions in US companies including AT&T Bell Labs, Rockwell Science Center, iVast, and Digital Island over a period of 17 years. He was a US delegate for ISO and ITU standards committees and contributed to the development of many new interactive multimedia technologies that are now part of the MPEG-4 and JPEG-2000 standards. His professional interests lie in the broad area of multimedia signal processing and communications. Dr. Chen is an IEEE Fellow. He is an Associate Editor of IEEE Transactions on Circuits and Systems for Video Technology. He served as Associate Editor for IEEE Transactions on Image Processing from 1992 to 1994, Guest Editor for IEEE Transactions on Circuits and Systems for Video Technology in 1999, and Editorial Board Member for Pattern Recognition from 1989 to 1999.