SMILE DETECTION USING LOCAL BINARY PATTERNS AND SUPPORT VECTOR MACHINES D. Freire, M. Castrill´on SIANI, Universidad de Las Palmas de Gran Canaria, Spain
[email protected],
[email protected]
O. D´eniz SIANI, Universidad de Las Palmas de Gran Canaria, Spain
[email protected]
Keywords:
Facial analysis, SVM, K-NN, PCA, LBP
Abstract:
Facial expression recognition has been the subject of much research in the last years within the Computer Vision community. The detection of smiles, however, has received less attention. Its distinctive configuration may pose less problem than other, at times subtle, expressions. On the other hand, smiles can still be very useful as a measure of happiness, enjoyment or even approval. Geometrical or local-based detection approaches like the use of lip edges may not be robust enough and thus researchers have focused on applying machine learning to appearance-based descriptors. This work makes an extensive experimental study of smile detection testing the Local Binary Patterns (LBP) as main descriptors of the image, along with the powerful Support Vector Machines classifier. The results show that error rates can be acceptable, although there is still room for improvement.
1
INTRODUCTION
It is now known that emotions play a significant role in human decision making processes. Some facial expressions can be very difficult to recognize even between humans. Besides, in human-computer interaction the range of expressions displayed is typically reduced. In front of a computer, for example, the subjects rarely display accentuated surprise or anger expressions as he/she could display when interacting with another human subject. The human smile is a distinct facial configuration that could be recognized by a computer with greater precision and robustness. Besides, it is a significantly useful facial expression, as it allows to sense happiness or enjoyment and even approval (and also the lack of them) (Ekman et al., 1990). As opposed to facial expression recognition, smile detection research has produced less literature. The lip zone is obviously the most important, since human smiles involve mainly the Zygomatic muscle pair, which raises the mouth ends. Edge features alone, however, may be insufficient. This paper makes an extensive experimental study of the smile detection problem, being organized as
follows. Section 2 describes the codification algorithms. The different classification approaches are briefly presented in Section 3. The experimental results and conclusions are described in Sections 4 and 5 respectively.
2
REPRESENTATION
The Local Binary Pattern (LBP) is an image descriptor commonly used for classification and retrieval. Introduced by Ojala et al. (Ojala et al., 2002) for texture classification, they are characterized by invariance to monotonic changes in illumination and low processing cost. Given a pixel, the LBP operator thresholds the circular neighborhood within a distance by the pixel gray value, and labels the center pixel considering the result as a binary pattern. Rotation invariance is achieved in the LBP based representation considering the local binary pattern as circular. The experience achieved by Ojala et al. (Ojala et al., 2002) suggested that just a particular subset of local binary patterns is typically present in most of the pixels contained in real images. They re-
3
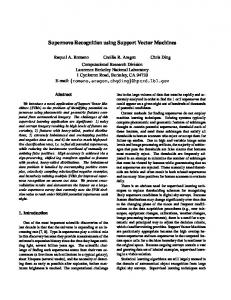
Figure 1: The basic version of the Local Binary Pattern computation (c) and the Simplified LBP codification (d).
fer to these patterns as uniform. Uniform patterns are characterized by the fact that they contain, at most, two bitwise transitions from 0 to 1 or viceversa. In the experiments carried out by Ojala et al. (Ojala et al., 2002) with texture images, uniform patterns account for a bit less than 90% of all patterns when using the 3x3 neighborhood. Using LBP as a preprocessing method has the effect of emphasizing edges and noise. To reduce the noise influence, Qian Tao et al. (Tao and Veldhuis, 2007) recently proposed a modification of the LBP approach. Instead of weighting the neighbors differently, their weights are all the same, obtaining the so called Simplified LBPs, see Figure 1-d. Their approach has shown some benefits applied to facial verification, due to the fact that by simplifying the weights, the image becomes more robust to illumination changes, having a maximum of nine different values per pixel. The total number of local patterns are largely reduced so the image has a more constrained value domain. In the experiments described at Section 4, both approaches will be adopted, i.e. using the histogram based approach, but also using Uniform LBP and Simplified LBP as a preprocessing step. On the other hand, another problem to solve is that raw face images are highly dimensional. A classical technique applied for face representation to avoid the consequent processing overload problem is Principal Components Analysis (PCA) decomposition (Kirby and Sirovich, 1990). PCA decomposition is a method that reduces data dimensionality, without a significant loss of information, by performing a covariance analysis between factors. As such, it is suitable for highly dimensional data sets, such as face images. A normalized image of the target object, i.e. a face, is projected in the PCA space. The appearance of the different individuals is then represented in a space of lower dimensionality by means of a number of those resulting coefficients, vi .
CLASSIFICATION
As mentioned above, LBP histograms have been used as features to characterize images. For facial analysis, the face image is typically divided into blocks, describing the whole face by means of the histogram collection extracted from those rectangular blocks. The L1 norm is often used as a simple and fast approach to compute the similarity between two histograms with n bins. In the experiments reported in Section 4, the block size has been ajusted to the size of the image part to study depending on the kind of test. Support vector machines (SVM) are a set of related supervised learning methods used for classification and regression. They belong to a family of generalized linear classifiers. A property of SVMs is that they simultaneously minimize the empirical classification error and maximize the geometric margin; hence they are also known as maximum margin classifiers. LIBSVM (Chang and Lin, 2001) has been the library employed in the experiment described below. Another supervised learning method used in this paper is the k-nearest neighbor (k-NN). It is a method for classifying objects based on closest training examples in the feature space. k-NN is a type of instancebased learning, or lazy learning where the function is only approximated locally and all computation is deferred until classification.
4
EXPERIMENTS
The dataset of images used for the experimental setup is separated into two classes: smiling and not smiling. The previous classification has been performed by humans who labeled each normalized image of 59 × 65 pixels. The first set contains 2421 images of different smiling faces, while the second set contains 3360 non smiling faces. As briefly mentioned above, the experimental setup considers two different possibilities as input: 1) the whole normalized face image, and 2) the image parts extracted from the face image corresponding to both eyes and the mouth, which are the most important facial regions to detect the human smile in psychology (Ekman et al., 1990). On this second possibility, there are two different kinds of test depending of how the ocular area is extracted. The eyes can be considered separately or not. This fact is important because the amount of information that can be considered for each test is different depending on the eye extraction. The input image will be a grayscale image, and for
KNN Test GRAY M 1NN ULBP M 1NN SLBP M 1NN GRAY M 5NN ULBP M 5NN SLBP M 5NN GRAY ET+M 1NN ULBP ET+M 1NN SLBP ET+M 1NN GRAY ET+M 5NN ULBP ET+M 5NN SLBP ET+M 5NN GRAY SE+M 1NN ULBP SE+M 1NN SLBP SE+M 1NN GRAY SE+M 5NN ULBP SE+M 5NN SLBP SE+M 5NN
Image Values
Histogram
20.3% 41.0% 35.0% 18.7% 43.0% 38.5% 26.0% 44.0% 42.0% 23.5% 43.0% 38.0% 24.0% 46.0% 42.0% 21.0% 42.0% 39.0%
37.5% 32.0% 36.5% 34.5% 28.5% 32.0% 31.0% 32.5% 34.5% 30.0% 27.5% 33.0% 33.0% 33.5% 34.0% 30.0% 30.0% 33.5%
Table 1: Error rate with k-NN based approaches considering image parts. There is an entry for each experiment. For each slot the name is composed by the abbreviated name of the approach, of the parts involved in the experiment and a kNN classification method. For the preprocessed input data, there are three possibilites: LBPU, SLBP and GRAY, which stands for Uniform LBP, Simplified LBP and Grayscale Image respectively. For the image part, there are also three possibilities: M, SE and ET, which stands for a Mouth, Separated Eyes and Eyes Together respectively. And for the classification methods there are two possibilities: 1NN and 5NN which stands for 1-NN and 5-NN respectively.
representation purposes we have used the following approaches for the whole image and the image parts tests: • A PCA space obtained from the original gray images or obtained after preprocessing the original images using LBP. Two different approaches, i.e. Simplified LBP (SLBP) and Uniform LBP (ULBP), have been used. • A concatenation of histograms based on the gray image or the resulting LBP image (both approaches simplified and uniform were used). • A concatenation of the image values based on the gray images or the resulting LBP image (again both LBP approaches were used). Similar experimental conditions have been used for every approach considered in this setup. The test sets are built randomly, having an identical number of images for both classes. The results presented correspond to the percentage of wrong classified samples of all test samples. The average results presented on this paper are achieved for each configuration after ten random selections with the 50% of the samples for training and the 50% for testing. Therefore, for the experiment we have used for training 2000 images, 1000 of each class, and 2000 images for test, 1000 of each class. Using the different input sources mentioned above, for the k-NN image parts experiments, each
SVM Test GRAY M GRAY ET+M GRAY SE+M ULBP M ULBP ET+M ULBP SE+M SLBP M SLBP ET+M SLBP SE+M
Image Val.
Hist.
PCA 40
PCA 90
PCA 130
13.3% 12.5% 13.2% 23.5% 32.1% 31.2% 16.4% 22.2% 21.5%
37.8% 30.8% 30.7% 25.3% 22.3% 22.1% 27.7% 25.3% 25.0%
10.3% 09.7% 10.6% 27.2% 29.9% 29.0% 20.8% 21.5% 21.4%
11.4% 10.2% 10.9% 26.3% 36.6% 32.2% 18.0% 19.9% 21.5%
11.6% 10.3% 11.2% 25.1% 36.0% 30.1% 18.3% 19.8% 24.3%
Table 2: Error rate with SVM based approach considering the image parts. There is an entry for each experiment. For each slot the name is composed by the abbreviated name of the approach and of the parts involved in the experiment. k-NN Test GRAY 1-NN ULBP 1-NN SLBP 1-NN GRAY 5-NN ULBP 5-NN SLBP 5-NN
Image Values
Histogram
27.0% 45.0% 43.0% 29.5% 46.3% 38.4%
43.0% 43.5% 43.0% 41.5% 41.0% 46.0%
Table 3: Error rate with k-NN considering the Whole Image. For each slot the name is composed by the abbreviated name of the approach and a k-NN classification method.
image part (grayscale or LBP preprocessed) is transformed to a collection of normalized features. These features can be the bins of a normalized histogram or the image values, depending on the approach used. Table 1 shows the error rates for each approach varying the image parts considered to represent the face. As it was expected, for the image values test, the grayscale image based approach results are clearly better. In this case the test is performed directly using the normalized graylevels vector of the image parts. The test for both LBP preprocessed images report similar rates, and too far from the grayscale images rates. This fact is due to the data compression that both LBP approaches introduce. For the normalized histogram test with image parts, the results achieved for the grayscale images are worse than those rates achieved for the image values test, although the test for both LBP preprocessed images achieved better rates, especially the Simplified LBP. Again, both LBP results seem quite similar. Another important aspect to take care in this section is the variation of behavior between 1-NN and 5-NN tests. 5-NN reported better results than the 1NN, because 5-NN works with more information than 1-NN does, and this fact affects the error rate. Table 3 shows the results obtained by analyzing the whole image. It is observable that the rates achieved with the image values test are much better than those obtained for the normalized histogram test. This fact is justified by the presence of more information in the image values based representation to take the best decision. Another point to consider in this
SVM Test Grayscale image Uniform LBP Simplified LBP
Image Val.
Hist.
PCA 40
PCA 90
PCA 130
10.6% 27.2% 26.2%
42.9% 35.7% 38.2%
11.3% 25.9% 27.5%
10.4% 27.6% 27.7%
10.1% 27.0% 28.8%
Table 4: Error rate with SVM considering the Whole Image
case, is that the rates are worse than those achieved for the image parts results. These results suggest that just analyzing eyes and mouth, there is an increase of the amount of useful information to take the most suitable decision. For the next part of the experiments we have used SVM as classification criteria. It must be specified that, for the SVM test, there are five possible representation approaches: image values, normalized histograms, PCA 40, PCA 90 and PCA 130. The number next to PCA refers to the dimension of the representation space, i.e. it indicates the number of eigenvectors used for projecting the face image. As it can be seen on Tables 2 and 4 the error rates achieved using the grayscale images are the best rates in almost every situation. None of the LBP based representations outperforms that approach. However, the Uniform LBP approach evidences a larger improvement when normalized histograms are used. Simplified LBP approach reported better results than Uniform LBP except for the normalized histograms. Restricting the input data to the most expressive facial areas, again the Grayscale approach presents the best performance with a clear improvement above the k-NN tests rates. This effect suggests that focusing on those areas, some noise is removed in the representation information, situation not observed with k-NN, and this allows the use of powerful classifiers. When the normalized image values vector based representation is used, the grayscale image test achieved the lowest error rate. For the PCA rates, the behaviour of those error rates is quite similar to the behaviour obtained previously with the rates of the image values test. Again grayscale image test achieved the lowest error rates. When the histogram based representation is used, the Uniform LBP error rate is the lowest. This approach seems to model properly the smile texture even when the histogram is losing the relative location information. However, this feature is quite similar for the Simplified LBP approach, its histogram loses information but the rates achieved are similar. The grayscale image test achieved its highest error rate in this case, higher than the Uniform LBP and Simplified LBP approaches, which means that the Grayscale approach is very sensitive to the relative location of the information. For the SVM setting already explained, strategical
blocks of eyes and mouth for image parts are translated into a reduction of the number of dimensions. The improvement of image parts is due to this fact. Of course, it should be mentioned that PCA reduces dimensions too, that is the reason why the grayscale image test with PCA achieved better results than the image values test.
5
CONCLUSIONS
This paper described a smile detection using different LBP approaches, as well as grayscale image representation, combined with two different classification methods: k-NN and SVM. It has been shown the potentiality of Simplified LBP as a preprocessing method for smile verification, specially in SVM test. Observing in detail the differences achieved between the Uniform LBP and the Simplified LBP. The distribution of Simplified LBP can be used as a good representation for images with more or less uniform textures, but for the face image it is not enough. Therefore, if the area is restricted to just the mouth, the performance increases, due to the fact that other textures are removed, even if it loses connection between patterns and their relative position in face. In this paper we have developed a static smile clasiffier achieving, in some cases, a 90% of success rate. Smile detection in video streams, where temporal coherence is implicit, will be studied, as a cue to get the ability to recognize the dynamics of the smile expression.
REFERENCES Chang, C.-C. and Lin, C.-J. (2001). LIBSVM: a library for support vector machines. Software available at http://www.csie.ntu.edu.tw/ cjlin/ libsvm. Ekman, P., Davidson, R., and Friesen, W. (1990). The. duchenne smile: emotional expression and brain physiology. ii. Journal of Personality and Social Psychology. Kirby, Y. and Sirovich, L. (1990). Application of the Karhunen-Lo´eve procedure for the characterization of human faces. IEEE Trans. on Pattern Analysis and Machine Intelligence, 12(1). Ojala, T., Pietikinen, M., and Menp, T. (2002). Multiresolution gray-scale and rotation invariant texture classification with local binary patterns. IEEE Trans. on Pattern Analysis and Machine Intelligence, 24(7):971– 987. Tao, Q. and Veldhuis, R. (2007). Illumination normalization based on simplified local binary patterns for a face verification system. In Proc. of the Biometrics Symposium, pages 1–6.