anomalies and/or incorrect usage. To address this problem, we present SocketWatch - an autonomous appliance monitoring system. SocketWatch is positioned ...
2014 IEEE International Conference on Pervasive Computing and Communications (PerCom)
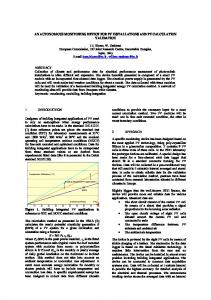
SocketWatch: An Autonomous Appliance Monitoring System Tanuja Ganu∗ , Dwi Rahayu† , Deva P. Seetharam∗ , Rajesh Kunnath‡ , Ashok Pon Kumar∗ , Vijay Arya∗ , Saiful A. Husain§ and Shivkumar Kalyanaraman¶ ∗ IBM
Research, India University, Australia ‡ Radio Studio, India § Universiti Brunei Darussalam, Brunei ¶ IBM Research, Australia † Monash
Abstract—A significant amount of energy is wasted by electrical appliances when they operate inefficiently either due to anomalies and/or incorrect usage. To address this problem, we present SocketWatch - an autonomous appliance monitoring system. SocketWatch is positioned between a wall socket and an appliance. SocketWatch learns the behavioral model of the appliance by analyzing its active and reactive power consumption patterns. It detects appliance malfunctions by observing any marked deviations from these patterns. SocketWatch is inexpensive and is easy to use: it neither requires any enhancement to the appliances nor to the power sockets nor any communication infrastructure. Moreover, the decentralized approach avoids communication latency and costs, and preserves data privacy. Real world experiments with multiple appliances indicate that SocketWatch can be an effective and inexpensive solution for reducing electricity wastage.
I. I NTRODUCTION Electrical appliances such as clothes dryers, refrigerators and dishwashers, especially those that have sub-components of heating/cooling or use heated water constitute a significant percentage of the electricity consumed by residential and commercial sectors [1]. Moreover, these appliances waste energy due to inefficient usage and malfunctioning. For instance, Heating Ventilation and Air Conditioning (HVAC) systems operate 30 - 45 percent below their efficiency rating, wasting hundreds of Gigawatt hours of energy in the United States [2]. It is important that wastage is minimized because the appliance usage is projected to sharply increase in the coming years [3]. To address this issue, governments are mandating strict energy efficiency standards. For instance, the European Commission (EC) has mandated that the standby power shall not exceed 0.5W and the standby plus power shall not exceed 1W [4]. However, government mandates cannot be applied retroactively to millions of existing appliances that leak a significant amount of energy in the standby state [5]. A few commercial products such as Energenie [6] and MeterPlug [7] that can eliminate such standby mode consumption of certain classes of appliances (such as TV) have been released. However, these products do not detect appliances that are operating anomalously and/or inefficiently (known to be precursors to degradation, lifetime reduction and outright appliance breakdown) [8]. In an attempt to overcome these shortcomings, we explore a decentralized (all aspects of operation - sensing, analytics, actuation and notification - are performed at the device) design through SocketWatch. SocketWatch has a single-phase power
978-1-4799-3445-4/14/$31.00 ©2014 IEEE
38
socket into which any appliance (that draws less than 15 Amperes of current) can be plugged in and the SocketWatch in turn gets plugged into a wall socket. SocketWatch has a learning phase and a monitoring phase. During the learning phase, SocketWatch senses the electrical parameters (voltage, current, frequency and phase angle) to measure the power consumption patterns of the attached appliance. It analyzes these measurements using resource-efficient machine learning algorithms to build a behavioral model (states i.e. different unique power levels of operation, durations/frequencies of those states, state transitions from one state to another, etc) of the appliances. During the monitoring phase, it compares the appliance consumption patterns against the learnt model, and the deviations are used to spot malfunctioning and energy leakage. SocketWatch, if possible, would take appropriate corrective actions (such as turning off idling appliances) or alert the users. Real world experiments with multiple appliances (refrigerators, washing machines and water heaters, air conditioners etc.) indicate that SocketWatch} can be an effective and inexpensive solution for reducing electricity wastage. The key contributions of this paper are: • Design of a novel approach for characterizing appliances in terms of their electricity consumption patterns. • Design and experimental evaluation of resourceefficient unsupervised machine learning algorithms that use these patterns for characterizing appliances and for detecting anomalies. • Design of a standalone smart plug that embodies those algorithms. It neither requires any communication infrastructure nor any changes to the appliance or grid. It can work with many common appliances such as refrigerators, TVs, washing machines, etc. Moreover, since it analyzes the data locally, it avoids communication costs and preserves the privacy of appliance owners. II. BACKGROUND Electrical appliances are built from active (elements such as transistors that supply voltage or current to the circuit) and passive (elements such as resistors and capacitors that absorb energy) circuit elements. They perform their functions by activating a set of one or more of these circuit elements [9], [10]. As a result, power consumption of an appliance at any instant is the aggregate consumption of all those elements that were activated at that point in time.
2014 IEEE International Conference on Pervasive Computing and Communications (PerCom)
To study the energy consumed by appliances while performing their various tasks (such as tumbling and spinning operations of a washing machine), we collected consumption data (active and reactive power) for a wide variety of common electrical loads in use at 10 homes and 1 research facility using plug-level monitors called jPlugs [11] for more than a year. All the observed appliances, irrespective of usage and ambient conditions that could affect their operations, exhibit marked regularities in their electricity consumption patterns, and, on the basis of these regularities, we hypothesize that electrical appliances can be characterized using the four parameters listed below. For explaining the characterization, we classify the appliances into three categories : 1. intermittentforeground (appliances such as TVs and hair driers that are used for a few hours per day only in the presence of users) 2. intermittent background (appliances such as washing machines and AC that work for short durations with minimal user interactions) and 3. continuous background (appliances such as refrigerator and battery charger that run continuously with minimal user interactions). It is important to note that these classes are relevant only for the explanation for the system itself; SocketWatch would still work even if an appliance does not function as per this classification. States - we define states as distinct levels of power1 (active and reactive power) consumed by an appliance. Since the set of activated circuit elements and the appliances themselves are bound by their corresponding minimum and maximum (voltage and current) ratings, power consumed by appliances at all times fall within certain well-defined ranges. For instance, as shown in Figure 1a, the power consumed by an observed fridge falls between certain minimum and maximum levels in its operating phases (for example, in compressor running and defroster running). Further more, consumption levels can be divided into well-separated clusters, as depicted in Figure 1b, corresponding to those phases. Substates - we define substates as the time spent in each of the aforementioned states. Appliances complete their tasks within a well-defined range of durations. As illustrated in Figure 1c and Figure 1d, a fridge stays in the idling state for different range of time durations during the normal idling cycle (less than 20 minutes) versus the manual defrost cycle (more than 80 minutes); though the power consumption levels are similar in these two cases. Hence, these two operations are considered as two different substates based on their durations. State transitions - appliances execute the tasks associated with their functions in one or more of a small number of pre-programmed sequences. In this sense, appliances can be considered as probabilistic finite state machines since the sequence of tasks could vary based on user inputs and/or due to ambient conditions. For instance, as illustrated in Figure 1e, a washing machine completes a single wash cycle by going through one of the possible sequences of water heating (would be skipped if the cold water cycle is chosen), tumbling and spinning operations in order. Figure 1f illustrates the state transition diagram for this washing machine. Periodicity of States - many background appliances execute their tasks at regular intervals and for regular durations. For example, as illustrated in Figure1a, a refrigerator runs its compressor every 60 minutes for approximately 27 minutes. 1 In rest of the paper, the term power consumption means both the active and reactive power consumed by an appliance. The terms reactive power and power factor are used interchangeably.
39
We believe these four parameters can accurately characterize electrical appliances since they capture the fundamental consumption characteristics - tasks, durations of those tasks, task sequence and task periodicity [12]. Moreover, this characterization approach is suitable for implementing on embedded computing platforms since it requires measuring only three basic electrical quantities (voltage, current and phase angle) and the model is built using resource-efficient machine learning algorithms described in the next section. III. P ERVASIVE A NALYTICS As described in Section II, SocketWatch utilizes the regularities in power consumption patterns of appliances to spot energy wasted by them. The functioning of SocketWatch can be divided into learning and monitoring phases. A. Learning Phase In the learning phase, SocketWatch analyzes the power (active and reactive power) consumed by the attached appliance to build a model (we assume that the appliance is functioning correctly during the learning phase) of it. For building this model, SocketWatch first divides the initially measured data D (henceforth called as training data), into multiple k chunks, D1 , ..., Dk . Then it builds the consumption model for each training chunk. The characteristics which are consistent across those k consumption models are retained as the reference or benchmark consumption model of the attached appliance. Next, we elaborate our approach for building a model of appliance using the four parameters explained in Section II. 1) Modeling States: SocketWatch by analyzing the training data, identifies the unique states in terms of power consumed by an appliance. The number of such states depends upon appliance types and models. Hence, we apply a clustering approach that can implicitly identify the number of states as well as the statistical characteristics of those states such as minimum, maximum, mean and the standard deviation of power consumption. HyCARCE [13], a low-computational complexity clustering algorithm designed for embedded systems, is used for clustering the data. The output of this algorithm is a set of clusters with their centroids, ellipse boundaries and standard deviations. The clustered points are de-normalized and the remaining 90% of un-sampled time series measurements are assigned to one of the clusters based on their euclidian distance from the centroid of the clusters and the cluster boundaries. Each cluster is then regarded as an state in the appliance consumption model and its properties such as the mean, range and standard deviation are recorded. To further reduce computational complexity, only a subset (p%) of training dataset Di is used as input to this algorithm. The performance of algorithms was compared using datasets of various sizes. For this comparison, the statistical measure of Adjusted Rand Index (ARI) [14] that has a value between −1 (clusters produced by the two runs are entirely different) and 1 (clusters produced by the two runs are exactly same) is used. Experimental results (obtained from analyzing consumption datasets of four different appliances) show that 10% random samples yield clustering performances comparable to the ones provided by complete datasets. Additionally, the optimal value of p can be identified depending upon the trade-off between computational complexity versus modeling sensitivity, as discussed in Section V. 2) Modeling Substates: The states are divided into substates based on the duration for which an appliance remains in
2014 IEEE International Conference on Pervasive Computing and Communications (PerCom)
Fig. 1: (a) Active power and power factor of a fridge in different states, (b) Clusters of power consumption levels of a fridge, (c) Active power and power factor of a fridge during manual defrost and subsequent longer run of compressor ON cycle, (d) Histograms of time spent by the fridge during idling (normal and manual defrost) and compressor ON (normal cycle and after manual defrost) states, (e) A sequence of states executed by a washing machine, (f) State transition diagram for the washing machine a particular state. For instance, as shown in Figure 1c, a fridge’s compressor cycle (state) can run for different durations (substates) based on the situation, but consume the same amount of power. The set of discrete operational durations spent in each of those states are processed using an efficient local density maxima algorithm, to find the list of valid substates, ˆ The algorithm builds a histogram of durations with the S. specified number of bins and the highest (above a certain minimum threshold) bin in an immediate neighborhood of bins is considered to be the local density maxima. Further, each such peak (along with its neighborhood bins) is considered as a separate substate. Empirically, we found that 10, 0.5% and 4 to be suitable numbers for the number of bins, the minimum frequency threshold and the neighborhood size, for extracting the correct distinct substates for the data observed so far. 3) Modeling Periodicity of States: SocketWatch tracks the time intervals between recurrence of states to learn the periodicity of those states. Since the intervals can vary due to ambient conditions and usage, statistical measures (mean, minimum, maximum and standard deviation) of the intervals are learnt rather than single interval values representing strict periodicity. 4) Modeling Predictable State Transitions: SocketWatch builds a first-order Markov model as a matrix whose rows and columns are states that the appliance goes through. The element Ai,j of this matrix A represents the number of times the state represented by the row i was immediately followed by the state represented by the column j. The probability of Ai,j transitioning, pij , from state Si to Sj is pij = P . n Ai,j
j=1
B. Monitoring Phase Currently, SocketWatch attempts to spot energy wasted in standby states and/or due to appliance malfunctioning. 1) Standby Detection: As confirmed by the empirical data, the standby states of foreground appliances have certain distinguishing characteristics: the power consumption levels and variations in those levels are lowest during these states. Furthermore, the standby durations are much longer than
40
intermediate low power states. Since SocketWatch considers these multiple aspects, it can identify standby states more accurately than other approaches that consider only the power levels.
2) Detecting malfunctions and inefficiencies: To spot any malfunctioning of appliances, SocketWatch collects a set (similar to the number of measurements used in learning phase) of measurements (active power and power factor) and conducts the following tests: State variations - SocketWatch would attempt to assign the observed measurements to one of the clusters (corresponding to the states from the learning phase). If they are assigned, the centroids of these measurements would be compared against the known states to check whether there is a shift. Such a shift could be exhibited by aging appliances. If the measurements cannot be assigned to any of the clusters, these measurements indicate the occurrence of an anomalous state. Substate variations - differences between the operational duration bounds of the states observed in the previous step and the substates from the learning phase indicate anomalies in the appliance. Changes in state/substate frequency - the time intervals between two consecutive occurrences of states and subsets would be compared with the corresponding intervals observed during the learning phase. If the difference is more than two standard deviations of known periodicity, these measurements indicate issues in periodicity of those parameters. Changes in transition probabilities - the appliance would be tested for going through different substates in the right order as per the consistent transitional probabilities observed during the learning phase. Using these tests, various types of appliance malfunctions can be captured by SocketWatch. The variations observed in the latter three tests would be an issue only for the background appliances.
2014 IEEE International Conference on Pervasive Computing and Communications (PerCom)
Fig. 2: (a) and (b): changes in refrigerator consumption when malfunctioning ( where the compressor is ON continuously). When not functioning properly, this refrigerator is found to be consuming 50% extra energy (3KWh per day), compared to its normal consumption (2KWh per day). IV. E VALUATION In this section, we present the evaluation results of various algorithms employed in SocketWatch. A. Identifying standby state We evaluate the SocketWatch approach for standby detection using the ground truth annotated data for appliances like an air-conditioner(AC), washing machine etc. Table I presents the power consumed by an air-conditioner(AC) in different states. This particular AC has three non-zero consumption states that are well-separated from each other in terms of power consumption, and in this case, the state 2 with the least mean non-zero power consumption and the least standard deviation is classified as the standby. Figures 3a and 3b represent State Power off Standby Compressor off Compressor on
Active Power µ σ 0 0 13.05 0.37 144.09 23.49 1162.45 78.17
Reactive µ 0 15.19 107.21 459.29
Power σ 0 0.61 21.31 61.06
TABLE I: Average (µ) and Standard Deviation (σ) of active and reactive power consumed by an AC.
Fig. 3: Histograms of active and reactive power consumed during the standby and other operating states of a washing machine. Standby state is the lowest non-zero consumption state and has the lowest spread among all operating states. the histograms of active and reactive power consumption during various states of operation. As shown in figure, the standby state is correctly identified with least mean non-zero consumption and standard deviation. Additionally, all the other states of a washing machine are much briefer in duration than its standby state.
41
B. Detecting malfunctions 1) Malfunctioning of a fridge: Figure 1 shows the consumption patterns of a refrigerator when it is functioning properly and Figure 2 when it is malfunctioning. As shown in Figure 1a, the fridge turns the compressor ON and OFF periodically. The condition of compressor OFF also appears as a distinct state (6 watts active power and a power factor of 1), as depicted in Figure 1b. Whereas when there is an issue, the compressor never gets turned OFF, as seen in Figure 2a, and as a result, the compressor OFF state is missing in Figure 2b. When the SocketWatch spotted this malfunction, we found that refrigerator’s door gasket was dry and cracked. The ambient hot air entered through this leaky gasket preventing the fridge from reaching the cutoff temperature so that it can cut the compressor OFF. When not functioning properly, this refrigerator is found to be consuming 50% extra energy (3KWh per day), compared to its normal consumption (2KWh per day). 2) Malfunctioning of an air conditioner: We further evaluated SocketWatch approach in a controlled setup by inducing anomalies in a room air-conditioner. We first built the reference model for that AC unit under normal operating conditions as shown in Figure 4a and Figure 4b. We then induced two commonly observed malfunctions to test whether SocketWatch can spot them: Blocked air filter - when the filter was blocked with a piece of cloth, the airflow was constricted. We observed that power consumption levels (states) remained similar to the normal conditions as shown in Figure 4b and 4d. But, the compressor was running for much longer duration leading to doubled (8.6KWh per day, compared to 4.5KWh in normal condition) energy consumption. Due to this extended compressor cycles, their periodicity reduced as depicted in Figure 4a and 4c, and the SocketWatch correctly flagged that as a malfunction. Condenser fan disconnected - when the condenser fan that exchanges heat with environment was disconnected, the condenser coils got extremely hot. To protect the unit, a thermal safety switch turned the compressor OFF. When the compressor was switched OFF, the condenser coils cooled down and when they reached a safe temperature, the compressor was switched ON again. However, due to these extreme operating conditions, the operational states changed significantly as shown in Figure 4e. Thus, SocketWatch was able to identify this malfunction. Blower disconnected - the blower provides a continuous supply of fresh, cool air by exchanging heat between the room
2014 IEEE International Conference on Pervasive Computing and Communications (PerCom)
Fig. 4: (a) and (b): Air Conditioner normal behavior, (c) and (d): air filter blocked (states remain same but the periodicity of states changes), (e): fan not working (change in states) (f): blower not working (change in states) and the cooling coils. When the blower was disconnected, the cold air was not blown into the room. Subsequently, the cooling coils became very cold. As a result, the thermal sensing bulb turned the compressor off to prevent further cooling. But, since the room was hot, the thermostat turned the compressor back ON with in a few minutes. Due to this frequent switching of the compressor, the periodicity of compression cycles and power consumption levels changed as illustrated in Figure 4f,. Thus, SocketWatch was able to correctly identify the anomaly. V. H ARDWARE D ESIGN As shown in Figure 5, the hardware modules of SocketWatch are a configuration interface, a LCD module, a power monitor, a computing device and a debug interface. Configuration Interface - there are four configuration options: enabling standby power management, setting anomaly tolerance (1-100%), setting minimum number of anomalies that must be observed before alerting the user and monitoring frequency (continuous, daily, weekly, etc.) Display module - SocketWatch is equipped with a 32character (16x2) LCD module. This display is used to present the alert messages to the users. Power monitor - Active and reactive power consumed by appliances are measured using Maxim’s 78M6612 energy measurement and monitoring system-on-chip (SoC) [15]. Computing engine - BeagleBone Black, an embedded linux platform [16], is the computing platform that runs aforementioned machine learning algorithms. The entire hardware design is based on the consideration of cost-performance trade-offs. In small volumes, SocketWatch costs about $100. But, 50% of the cost can be attributed to the Beagle Bone board. We are attempting to replace it with a lower cost microcontroller based board. The hardware is also designed to be power-efficient: SocketWatch consumes about 10w when both the computing engine and the power monitor are running at the same time. However, the power consumption reduces to 0.15w when only the sensor is running. We are adding mechanisms to enable the sensing circuitry to run independent of the computing engine so the processor can
42
be in sleep mode until the data must be analyzed. VI. R ELATED W ORK Analyzing power consumption patterns of appliances have been an active area of research. The existing body of work can be classified into two main areas: Electrical signature analysis and characterization of electric loads. Electrical Signature Analysis (ESA) - ESA describes a set of non-intrusive techniques for monitoring the health of electro-mechanical equipment. These techniques identify faults (electrical and mechanical) through a frequency-domain analysis of voltage and current signals in the motor or generator circuits of the tested equipment [17]. Since there are a number of appliances (water heaters, TVs, etc) that do not include any electromechanical components, SocketWatch uses only regularities in power consumption patterns to build models of appliances. Moreover, SocketWatch can identify energy leakage that happens not only due to malfunctions but also due to incorrect usage. For instance, an AC would consume more energy when a nearby door is open but a signature analysis would not find any anomaly. Characterization and Modeling of Electrical Loads Several researchers have attempted to characterize electrical appliances using fine-grained power consumption data. Barker et al have derived accurate models of appliances by distilling a small number of usage attributes in data gathered about dozens of loads across multiple homes [18]. Reinhardt et al have developed an automated approach for identifying devices based on the data collected by distributed plug-level power measurement units [19]. Since these frameworks are tailored for the simple integration of feature processors, they have employed a supervised learning approach. Whereas SocketWatch is based on unsupervised learning since it is a stand alone device that is designed to work with a wide variety of appliances whose performances could be dependent on ambient conditions and usage. VII. D ISCUSSIONS AND F UTURE W ORK Due to the recent issues with energy shortage and climate change concerns, there has been an increasing interest in re-
2014 IEEE International Conference on Pervasive Computing and Communications (PerCom)
Fig. 5: SocketWatch: (a) Hardware Block Diagram, (b) Hardware Design ducing energy wastage. In this work, we present SocketWatch, a smart plug that monitors power consumption characteristics to spot energy leaked by malfunctioning and/or idling electrical appliances. It does not require any communication infrastructure nor any changes to the appliance or grid. SocketWatch is more beneficial for high consuming appliances like HVAC or industrial loads etc. and large scale appliances like refrigerators in large grocery stores, hotels etc. We give the high level architecture and the hardware design details of SocketWatch. Using data collected about 40 appliances used at 10 households, we showed that power consumption patterns can be used to accurately model appliance performance characteristics. We presented novel unsupervised learning algorithms for characterizing electrical appliances and for spotting electricity wastage. Our experimental results show that both these algorithms could be used by SocketWatch to avoid energy wasted by malfunctioning and idling appliances. We are considering several future extensions to our work. On the hardware side, first, we are including additional cheap sensors such as temperature sensors to gather context information to further improve characterization accuracy. Second, we are replacing single-phase energy monitor chip with a threephase one so appliances that use a three phase power supply can be monitored. Third, we are planning to include power quality sensors to study the impact of voltage levels, transients and harmonics on the power consumption characteristics of appliances. Fourth, we are substituting the linux single-board computer with a microcontroller board to further reduce costs and energy consumed by the computing engine. On the algorithms side, first, we are planning to evaluate and calibrate the algorithm parameters using ground truth data from a large classes of appliances. Second, we are planning to model appliance functions as compositions of atomic states/ substates, and state transitions using variable order Markov models. Third, we are developing unsupervised learning techniques for identifying appliance classes so SocketWatch can customize its analysis to appliance-specific characteristics. We are also conducting evaluation and user studies to further refine SocketWatch’s approach for capturing inefficiencies and alerting users. VIII. ACKNOWLEDGMENTS We are grateful to Prof. Shonali Krishnaswamy and Dr. Zainul Charbiwala for providing valuable feedback that helped us improve this paper. We would like to thank Dr. Masud Moshtaghi and co-authors for providing implementation of
43
their HyCARCE[13] clustering algorithm. [1]
R EFERENCES U.S. Department of Energy (DOE), “Estimating Appliance and Home Electronic Energy Use,” http://energy.gov/energysaver/articles/ estimating-appliance-and-home-electronic-energy-use, August 2012.
[2]
W. Bigelow, “Wasted thinking, how faulty paradigms waste billions in nations heating-a/c,” http://www.evercleangreen.com/images/ FlawedParadigmReprt0808.pdf, 2008.
[3]
GIA, “Estimating Appliance and Home Electronic Energy Use,” http://www.electronics.ca/ publications/products/Electric-Household-Appliances-\ %252d-A-Global-Strategic-Business-Report.html, October 2012.
[4]
European Commission (EC), “Ec regulation no 1275/2008,” http://ec.europa.eu/energy/efficiency/ecodesign/doc/legislation/ guidelines for smes 1275 2008 okt 09.pdf, 2009.
[5]
LBL, “Standby Power,” http://standby.lbl.gov/.
[6]
“Energenie,” https://energenie4u.co.uk/, 2013.
[7]
MeterPlug, “MeterPlug,” http://meterplug.com, 2013.
[8]
D. Fay, “Home Energy Monitoring: Surprises, Malfunctions, and Fixes,” http://www.energycircle.com/blog/2009/12/15/ home-energy-monitoring-surprises-malfunctions-and-fixes.
[9]
A. Von Meier, Electric Power Systems: A Conceptual Introduction. Wiley-IEEE Press, 2006.
[10]
E. Kleinert, Troubleshooting and Repairing Major Appliances. Graw Hill, 2013.
Mc-
[11]
RadioStudio, “jplug datasheet,” http://www.radiostudio.co.in/datasheet/ jplug.pdf.
[12]
R. Stamminger, “Synergy potential of smart appliances,” http://www.smart-a.org/WP2 D 2 3 Synergy Potential of Smart Appliances.pdf, November 2008.
[13]
M. Moshtaghi et al., “An efficient hyperellipsoidal clustering algorithm for resource-constrained environments,” Pattern Recogn., vol. 44, no. 9, pp. 2197–2209, Sep. 2011.
[14]
L. Hubert and P. Arabie, “Comparing partitions,” Journal of classification, vol. 2, no. 1, pp. 193–218, 1985.
[15]
Maxim, “78m6612 datasheet,” http://datasheets.maximintegrated.com/ en/ds/78M6612.pdf, January 2012.
[16]
BeagleBoard.org, “Beaglebone black,” http://beagleboard.org/Products/ BeagleBone\%20Black, 2013.
[17]
H. Haynes, “Electrical Signature Analysis,” http://web.ornl.gov/sci/ees/ mssed/ds/ESA Overview (HDH 3-24-2010).pdf, March 2010.
[18]
S. Barker et al., “Empirical Characterization and Modeling of Electrical Loads in Smart Homes,” in IEEE International Green Computing Conference (IGCC), June 2013.
[19]
A. Reinhardt et al., “On the accuracy of appliance identification based on distributed load metering data,” in Sustainable Internet and ICT for Sustainability (SustainIT), 2012, 2012, pp. 1–9.