Accepted at 2017 International Conference on Advances in ICT for Emerging Regions (ICTer):
Real-Time Non-Intrusive Appliance Load Monitoring Under Supply Voltage Fluctuations Yasitha S. Liyanage1, Shirantha Welikala2, Chinthaka Dinesh3, Mervyn Parakrama B. Ekanayake4, Roshan Indika Godaliyadda5 and Janaka Ekanayake6 Department of Electrical and Electronic Engineering, Faculty of Engineering, University of Peradeniya, Peradeniya, Sri Lanka
[email protected],
[email protected],
[email protected],4mpb
[email protected],
[email protected],
[email protected] 3 Simon Fraser University, Canada, 6Cardiff University, UK
[email protected],
[email protected] Abstract— This paper presents a complete real-time implementation of a Non-Intrusive Appliance Load Monitoring (NIALM) system that, is robust under residential voltage level fluctuations. Existing NIALM techniques rely on multiple measurements taken at high sampling rates, but, only have been proven in simulated environments without even considering the effect of residential voltage level fluctuations - which is a severe problem in power systems of most developing countries like Sri Lanka. In contrast, through the NIALM method proposed in this paper, accurate load monitoring results were obtained in real-time using only smart meter measurements taken at a low sampling rate from a real appliance setup under residential voltage level fluctuations. In the proposed NIALM method, initially in the learning phase, a properly constructed MATLAB TM Graphical User Interface (GUI) was used to acquire signals of each appliance active power consumption and voltage levels. Then, obtained active power measurements were separated into subspace components (SCs) via the Karhunen Loeve´ Expansion (KLE) while also taking the voltage variations into account. Using those SCs, a unique information rich appliance level signature database was constructed and it was then used to obtain the signatures for all possible device combinations. Next, a separate GUI was designed to identify the turned ON appliance combination in the current time window using the pre-constructed signature databases, after reading the total residential active power consumption and the supply voltage. To validate the proposed real-time NIALM implementation, data from a laboratory arrangement consisting of ten household appliances was used. From the results, it was found that the proposed method is capable of accurately identifying the turned on appliances even under severe residential supply voltage level fluctuations. Keywords—Non-Intrusive Appliance Load Monitoring (NIALM), Real-time load monitoring, Voltage Fluctuations, Realtime NIALM, Smart meters, Subspace technique, Smart Grid, Demand Side Management(DSM).
I. INTRODUCTION The non-intrusive appliance load monitoring (NIALM) is the process of analyzing the aggregated active power signal going into a household or workplace and deducing what appliances are turned ON. Proper real-time solution to this problem can play a critical role in a variety of smart grid related applications such as intelligent appliance monitoring and control, smart billing, demand side management and also in supply and
07th – 08th September 2017
demand side power control [1]. Due to the high application potential, this NIALM has in smart grids, the necessity for effective and efficient Real-time NIALM methods for residential appliance identification has recently escalated [2], [3]. A wide variety of NIALM techniques are proposed in the literature. Those techniques have been based on, steady state measurements [4], harmonic content [5], voltage current (VI) trajectory [6], power spectral components [1], [7], [8] and transient measurements [9]. But, most of those methods are less implementable even in a simulated environment due to their various algorithmic and practical limitations such as their requirements of high-frequency measurements, multiple parameter measurements, and high computational power [3], [10]. In addition to that, when computing the NIALM solution, any of those techniques have not even address the problem of voltage fluctuations in the power system. This supply voltage level instability is a critical factor which should be considered when practically implementing a real-time NIALM system. Due to these reasons, almost all of these proposed NIALM strategies have only been implemented in simulated environments, using real data taken under stable supply voltage level, without the ability of real-time operation [2]. In contrast to those methodologies, the real-time NIALM algorithm proposed by our research group in [2] outperforms most of the existing algorithms for voltage controlled power systems. But, since there is a severe problem of voltage fluctuations in the power systems of developing countries such as in Sri Lanka, it has not been taken into account when implementing any of those algorithms. Furthermore, none of those methods have generated their signatures under voltage varying conditions with the voltage variability taken into account. Therefore the accuracy matrices of those existing NIALM methods fall drastically with variations of the supply voltage. As a remedy to this practical issue, a novel real-time NIALM algorithm is formulated in this paper where signatures were learned under voltage varying conditions such that voltage variability is also taken into account. The most important
International Conference on Advances in ICT for Emerging Regions ICTer2017
Real-Time Non-Intrusive Appliance Load Monitoring Under Supply Voltage Fluctuations
contribution of this paper is a complete real-time NIALM system, which can identify the turned on appliances even under voltage varying environments by only measuring the total active power and the voltage at a sampling frequency of 1 Hz. The complete real-time NIALM system proposed in this paper is comprised of a universal smart meter and two graphical user interfaces running in an NIALM-Processor Unit. This novel NIALM system was implemented on actual real-time residential set-up and showed a marked improvement in the performance even under supply voltage varying conditions.
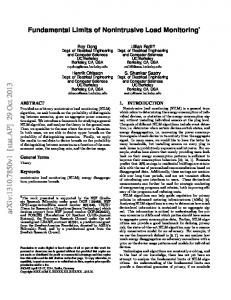
Fig. 1 Basic Hardware Architecture
This paper consists of six sections including the introduction. Section II presents the implemented basic hardware setup used for the proposed NIALM method. In Section III, individual appliance signature learning procedure is described. Then, the real-time active appliance combination identification algorithm is described in Section IV. In Section V, solution for the supply voltage level fluctuations is introduced. Then this paper is concluded in Section VI. II. BASIC HARDWARE SETUP The hardware setup basically consisted of a universal smart meter and a NIALM processor unit. The, aggregated power and voltage levels drawn into a house were measured at a 1 Hz sampling frequency using the universal smart meter. Then, using these voltage and power measurements, the proposed NIALM algorithm which was implemented on the NIALM processor unit determined the turned ON appliance combination in real-time. The hardware architecture used is shown in Fig.1. A. Universal Smart Meter The universal smart meter plays a pivotal role in the complete system as all other systems depend on the measurements taken by this unit. The smart meter which was used in the complete
07th -08th September 2017
hardware setup is EKM-Omnimeter I v.3 and it has following specifications. 1) Nominal voltage range configurations: • 120V-480V, 2-wire, single-phase, one line and one neutral (This configuration was used in this study). • 120V-480V, 3-wire, single-phase, 2 lines, 1 neutral. • 120V-415V, 3-wire, 3-phase, 3 lines, no neutral. • 120V-480V, 4-wire, 3-phase, 3 lines, 1 neutral. 2) Range of allowable environmental conditions: • Pollution Degree: 2. • Measurement Category: III. • Altitude Rating: 2000 meters (maximum). 0 0 • Temperature Range: -30 C to 70 C. • Tamper Detection Class: 1. 3) General specifications: • Insulation Protection: Complete double insulation. • Accuracy Class: 0.5. • Rated Frequency: 50 Hz/60Hz. • Pulse Counting: 800 pulses/kWh (1.25 Wh/pulse). • Certification: Received ”California Type” approval for revenue grade metering. • Current Transformer: Mini Solid-Core, 7mm hole Dia., 100A:26.6mA, BCT-007-100. • Power Measurement Resolution: 0.2 W. • Sampling Frequency: 1 Hz. This meter is shown in Fig.2 and was used in the complete system with appropriate current sensor to measure the active power signal and the voltage (both at 1 Hz sampling frequency) and transferred to the NIALM processor unit using its RS485 interface via a RS485 to USB converter. B. Non-Intrusive Appliance Load Monitoring Processor Unit When deciding the specs of this NILAM processor unit to be used, NIALM algorithm execution time requirement played a key role. For this NILAM approach, execution time can be defined as the time required to decode one sliding window of active power data of length 10 seconds (10 samples). The execution time achieved when the original non real-time version of the NIALM algorithm was used on a workstation with Intel Core i5 processor and 8.00 GB RAM running at 2.53 GHz, was around 6 seconds [10]. Since the measurement data arrives at a rate of 1 Hz, it is evident that this execution time should be reduced to a value below 1 s. Previous work of this research proposed in [2] tackles this problem to achieve improved execution times which enables real-time operation. In this research, a real-time version of the NIALM algorithm proposed in [1] have been implemented to have an execution time less than 1 s. To implement the real-time NILAM algorithm on a processing unit, it should be able to use both in learning and disaggregation stages. So, in the processor unit, two separate applications were developed to carry out the individual
International Conference on Advances in ICT for Emerging Regions ICTer2017
Yasitha S. Liyanage1, Shirantha Welikala2, Chinthaka Dinesh3
profiles were used to formulate KE based appliance level signature database. Since individual appliance power and voltage monitoring should be done in 1 Hz sampling frequency, in order to utilize the processor idle time in-between two sampling points, realtime signal acquisition and feature extracting method was developed. This method completes the extraction of features and creation of signatures while simultaneously collecting the individual appliance active power and voltage level data. Also, this real-time feature extraction methodology proposed in this paper formulates the foundation to the real-time turned ON appliance combination identification in step three. A. Real-time Feature Extraction Algorithm Outline
Fig. 2 Universal Smart Meter EKM-Omnimeter V.3
appliance learning as well as to calculate the NIALM solution (i.e. to find the turned ON appliance combination) in real-time. These two applications were developed in a user-friendly and separately installable manner. Once the NIALM processor takes active power and voltage measurements as inputs from the universal smart meter through a USB communication, developed learning and appliance disaggregating applications operate on the collected measurements. Due to this unique architecture which depends on independent hardware and software units, a user can easily upgrade NIALM algorithm or the NIALM processor. In this research, a workstation with Intel Core i5 processor and 8.00 GB RAM running at 2.53 GHz was used to run the developed two applications. These two applications were designed with user-friendly Graphical User Interfaces (GUIs) to guide any user to carry out appliance signature learning and load disaggregating phases in real-time by themselves. In the forthcoming sections, development of these two applications and their theoretical background will be discussed. C. Overview of the Complete Implemented NILM Solution The proposed NILM strategy has three main steps: namely, 1) Creating individual appliance level signature database under voltage fluctuations. 2) Creating appliance combination level signature database. 3) Identifying turned on appliances while receiving realtime active power and voltage measurements. Here, the first two steps are described in Section III and those tasks were carried out using the created signature learning GUI. Then the last step is outlined in the Section IV and that operation is run in a specifically designed Load Monitoring GUI. In the final stage, generated databases in the first two stages were utilized to find the currently turned ON appliance combination in real-time. III. SIGNATURE LEARNING PROCEDURE This initial step has to be carried out as a learning phase before running the real-time NIALM algorithm. In the first step, individual appliance power consumption patterns and its corresponding voltage profile was collected. Then these power 07th-08th September 2017
1) Theoretical Background of KLE based feature extraction: If X = [X(1) X(2)...X(i)...X(N)] is a sliding window (SW) of active power signal collected, then, its Kurhunen Loeve´ Expansion (KLE) is given by [11],
𝑇 X = 𝑄𝑥 = ∑𝑁 𝑖=1 𝑞𝑖 𝑋𝑞𝑖 ,
(1)
where, Q and 𝑞1 , 𝑞2 , … , 𝑞𝑁 are the eigenvector matrix and the eigenvectors of the autocorrelation matrix (ACM) of SW𝑋 . According to the (1), active power signal SW 𝑋 can be decomposed into 𝑁 number of mutually uncorrelated spectral components. These spectral components are also known as subspace components (SCs) of the SW 𝑋 , named as, 𝑥1 , 𝑥2 , … , 𝑥𝑁 where 𝑥𝑖 = 𝑞𝑖𝑇 𝑋𝑞𝑖 Further, according to (1), each eigenvector qi can be thought of as coefficients of a Finite Impulse Response (FIR) digital filter (Eigen-Filter). If the input to that Eigen-filter is SW X then, the corresponding output would be the SC denoted by xi. Here, the most important point is, each of these Eigen filters tends to show a very narrow bandwidth (with center frequency - fci) which results approximately sinusoidal SC with a frequency of fci and a phase angle of θi. Also, the average absolute amplitude value of that SC will be equal to the corresponding eigenvalue λi [1]. Consequently, the obtained features, phase (θi) and amplitude value (λi) for each SC were transformed into rectangular form in the complex domain via relations, Rei = λicos(θi) and Imi = λisin(θi). With that, now for each SW of length N there are N¯ number of SCs denoted by xi and each of these SCs have three features, namely fci,Rei and Imi. Using these feature data coming from each SW of training data of an appliance, 2D histograms were formulated for each center frequency fc. For instance, once these histograms are normalized, it yields the probability of having a feature Re = Re1,Im = Im1 at fc = fc1 for the learned appliance (say app = app1). This can be denoted simply as an appliance level probability density function (AL-PDF) P(app1,fc1)(Re1,Im1). Utilizing each of these AL-PDFs, similar PDF for an appliance combination (CL-PDF) can be constructed through mathematical convolution of corresponding AL-PDFs. These
International Conference on Advances in ICT for Emerging Regions ICTer2017
Real-Time Non-Intrusive Appliance Load Monitoring Under Supply Voltage Fluctuations
formulated CL-PDF gives the probability of getting a feature when that appliance combination is turned ON. 2) Practical aspects of real-time feature extraction: The proposed feature extraction strategy described in Section III-A1 was implemented in real-time so that it can be incorporated as the first step of the real-time turned ON appliance combination identification. This is because, for realtime load identification (i.e. the step 3 of the proposed NIALM method), first features corresponding to the total power consumption signal should be extracted. In the developed real-time feature extraction technique, an optimized method was used to calculate the ACM avoiding traditional and computationally inefficient methods of finding ACM. This novel and efficient way of finding the ACM was vital to the real-time operation of the proposed NIALM method as the ACM has to be evaluated at every 1 s interval (i.e. for each SW). Here, it was found that, most of the multiplications done for the construction of the ACM of the last few instants can be reused for the construction of the ACM for current instant with only 5 new additional multiplications. For example, to construct an ACM without any previous ACMs required 38 multiplications. However, when ACM was continuously monitored at each second, only five multiplications are enough to construct the ACM for the current instant. Furthermore, in the developed real-time feature extraction technique, an analytical equation was used to obtain the center frequency of an Eigen-filter directly when the eigenvector is given. This method showed more accuracy, efficiency and less memory consumption when compared to non-real-time versions of this NIALM algorithm [2], thus, making it apt for real-time implementation of the NIALM technique. B. Creation of Signature Databases By using the collected features for each appliance, as explained in Section III-A1, AL-PDFs and CL-PDFs were constructed and they were stored in separate signature databases named as appliance level signature database (ALSD) and
appliance combination level signature database (CLSD) respectively. These pre-calculated and stored databases improved the execution time of the load identification algorithm and thus ensured the real-time execution of this proposed NIALM algorithm.
C. Developed GUI for NILM Signature Learning A GUI was constructed (named as GUILearn) as shown in Fig.3 to guide a user to carry out the appliance learning procedure by himself. There, new appliances and/or their power traces can be added to an existing appliance database (i.e. for the ALSD) and it can reconstruct the corresponding CLSD. While acquiring data either from a new device or to a existing device as a new power trace, real-time feature extraction was employed to extract features simultaneously. Also, ALSD and CLSD were constructed for the current appliance database through this developed GUI - GUILearn. IV. APPLIANCE IDENTIFICATION PROCESS The final step of this proposed real-time NIALM strategy is to identify the active load combination in real-time while receiving the total aggregated active power signal from the universal smart meter. A. Algorithm Outline First, the developed real-time feature extraction mechanism is utilized to extract features from each observed sliding window (OSW) of the total active power profile in real-time. Then, based on the DC power level (i.e. the 1st SC) and the other SCs of this OSW, two pre-elimination stages (PES1 and PES2) were carried out to reduce the set of possible turned ON appliance combinations. After that, the features obtained from the current OSW was matched with the probable features (taken from CLSD) of this reduced set of possible appliance combinations via a Main Elimination Stage (MES) followed by a Maximum a Posteriori(MAP) criteria [12]. The main work flow of this proposed appliance identification algorithm is described in Algorithm 1. In the PES1, OSW’s DC level is compared with minimum DC levels obtained for every possible appliance combination (taken from CLSD). Then every appliance combination with larger minimum DC level than the OSW’s DC level ware eliminated. Next, in the PES2, if OSW’s one of SC’s power (for an SC with center frequency fci it is λi - the ith eigenvalue) is larger than the maximum SC power that can be obtained from a possible appliance combination at that same fci, then, that appliance combination was also eliminated. After that in the MES, probability of getting OSW’s SC was considered for each of the every possible appliance combination using the preconstructed CLPDFs. If this probability is less than 0.01, then that combination was eliminated. Finally, in the MAP criteria, those obtained probabilities at MES were utilized to calculate the most probable appliance combination (i.e. the solution) which can match the SCs of the current OSW.
Fig. 3 Developed GUI for NILM Signature Learning
07th -08th September 2017
International Conference on Advances in ICT for Emerging Regions ICTer2017
Yasitha S. Liyanage1, Shirantha Welikala2, Chinthaka Dinesh3
B. Developed GUI for real-time load Identification A separate GUI (GUIIden) was developed as shown in Fig. 4 to carry out this real-time load identification algorithm. There first, ALSD and CLSD were loaded (these files are generated from GUILearn after signature learning process). Then the COM port was selected to which the universal smart meter is connected. Finally, current load combination Algorithm 1 Real-Time Appliance Identification Algorithm Robust Under Stable Supply Voltage Levels 1: for Every Operating Cycle (at 1 Hz) do 2: Update the current OSW with new active power reading coming from universal smart meter; 3: Apply real-time feature extraction for OSW to get the SCs: (fci,Rei,Imi)i=1,2,3,4,5; 4: Set S0 = {Set of all possible appliance combinations}; 5: Set i = 1; Set execution = 1; 6: Apply the PES1 to the given OSW and obtain S1; 7: while execution do 8: Take ith dominant SC: fci, Rei, Imi; 9: Apply the PES2 to S1 or S3 and obtain S2; 10: if Size (S2) ==1 then 11: Output: Solution Appliance Combination: S2 (1) 12: execution = 0; 13: end if 14: Apply the MES to S2 and obtain S3; 15: Apply the MAP criteria to S3 and get their γ values; 16: if γ > 99% or i == 5 then 17: Output: Appliance combination in the set S3 with max γ value; 18: Set execution = 0; 19: else 20: i=i+1 21: end if 22: end while 23: end for
identification was started with the RT-NILM button, and the solution was then displayed in the solution area of the this GUI developed. This solution updates at 1 Hz frequency as real-time NIALM algorithm runs at 1 Hz. V. SOLUTION FOR THE VOLTAGE FLUCTUATION Voltage fluctuations in a power system is a common scenario in most of the developing countries such as in Sri Lanka [13].Sudden changes in the active and reactive power drawn by the grid connected loads causes these repetitive or random fluctuations in the residential supply voltage level. The characteristics of these voltage fluctuations mainly depend on the load type, size and the power system capacity. Figure 5 illustrates a real example of a fluctuating voltage waveform of a typical Sri Lankan house. 07th-08th September 2017
Fig. 4 Developed GUI for NILM Load Identification
A. Voltage dependency of Appliance’s Power Measurements Due to these voltage fluctuations, the amount of current drawn by most of the appliances tends to fluctuate. As a result, active power consumed by the residential appliances will show some dependency to these voltage fluctuations. As an example, power consumed by an incandescent lamp is shown in Fig.5 while the residential supply voltage fluctuations are minimal. In contrast, Fig.6 shows the power consumed by the same appliance under high fluctuations. From the observations, for most of the appliances, high dependency was found between the supply voltage level and the DC power level which is the 1st SC of a SW. So, as a solution to this problem, the general NIALM procedure proposed in Section III and Section IV were changed accordingly to incorporate the voltage fluctuation effect on the 1st SC. B. Correction to the Signature Learning Procedure A constructed appliance signature generally contains a minimum level and a maximum level for the appliance DC power. Now, in order to incorporate the effect of voltage fluctuations, these learned minimum and maximum DC power levels were replaced with two voltage dependent profiles. These two profiles for an appliance were constructed by observing the power profile of that appliance while changing its supply voltage level. For an appliance, every observed 1st SC was categorized with corresponding voltage value and then, distributions of 1 st SCs were obtained for each voltage value. Now, from taking the minimum value of each of these distributions, separate profile was constructed to store the minimum DC power levels at different voltage levels. Similarly, another profile was constructed by considering the maximum value of each of the constructed distributions.
International Conference on Advances in ICT for Emerging Regions ICTer2017
Real-Time Non-Intrusive Appliance Load Monitoring Under Supply Voltage Fluctuations 260
240
220
200 0
50
100
150
200
250
Time/(s) (a) 45
Fig. 7 Power Consumption Ranges of an Incandescent Bulb Under Varying Residential Supply Voltages
40
35
30 0
50
100
150
200
250
Time/(s) (b) Fig. 5 (a) Supply Voltage Profile and (b) Power Consumption Profile of an Incandescent Bulb under Low Residential Voltage Level Fluctuations 260 240 220 200
0
100
200
300
400
500
600
700
800
900
Time/(s) (a) 45 40 35 30 0
100
200
300
400
500
600
700
800
900
Time/(s) (b) Fig. 6: (a) Supply Voltage Profile and (b) Power Consumption Profile of an Incandescent Bulb Under High Residential Voltage Level Fluctuations
For an example, these two constructed profiles which describes the voltage dependency of the maximum and minimum DC power levels of the 40W incandescent lamp are shown red and green lines in Fig.7.
07th -08th September 2017
Algorithm 2 Real-Time Appliance Identification Algorithm Robust Under Voltage Fluctuations 1: for Every Operating Cycle (at 1 Hz) do 2: Update the current OSW (i.e. Xn) with new active power reading coming from universal smart meter; 3: Calculate the mean supply voltage level-Vn for the OSW; 4: Apply real-time feature extraction for OSW to get the SCs : (fci,Rei,Imi)i=1,2,3,4,5; 5: Set S0 = {Set of all possible appliance combinations}; 6: Set i = 1; Set execution = 1; 7: Apply the PES1 by also considering the Vn to the given OSW and obtain S1; 8: while execution do 9: Take ith dominant SC : fci,Rei,Imi; 10: if i==1 then 11: Apply the PES2 by also considering the Vn to S1 and obtain S2; 12: else 13: Apply the PES2 to S3 and obtain S2; 14: end if 15: if Size(S2)==1 then 16: Output: Solution Appliance Combination : S2(1); 17: execution = 0; 18: end if 19: Apply the MES to S2 and obtain S3; 20: Apply the MAP criteria to S3 and get their γ values; 21: if γ > 99% or i == 5 then 22: Output: Appliance combination in the set S3 with max γ value; 23: Set execution = 0; 24: else 25: i = i + 1; 26: end if 27: end while 28: end for ________________________________________________
International Conference on Advances in ICT for Emerging Regions ICTer2017
Yasitha S. Liyanage1, Shirantha Welikala2, Chinthaka Dinesh3
C. Correction to the Appliance Identification Algorithm
The updated version of the appliance identification algorithm is described in Algorithm 2. When compared with previous version, the major difference in the Algorithm 2 is now a voltage reading is also measured at 1 Hz sampling rate simultaneously with power measurement. Then, for each OSW, the mean voltage level was calculated. As an example, for an OSW Xn the mean voltage was calculated as Vn. Then in the PES1, current OSW’s 1st SC (i.e. the mean power level of Xn) is compared with the minimum of the 1st SCs obtained for every possible appliance combination corresponding to the mean voltage Vn. Similarly, in the PES2, for the same SC (i.e. only in the iteration 1), its power is compared with the maximum 1st SCs power of every possible appliance combination corresponding to mean voltage Vn.
D. Case Study To verify the operation of the proposed voltage fluctuation robust novel real-time NIALM technique, a case study was conducted by taking ten household appliances. Complete hardware setup is shown in Fig. 9. The list of appliances used and their name tags are tabulated in Table I. First, each appliance was individually turned ON and its power profile was observed under constant residential voltage
Fig. 8: NIALM Accuracy comparison between with and without Voltage Fluctuation (VF) correction: (a) Power Profile,(b) Voltage Profile, (c) Correctness with VF correction, (d) Correctness without VF correction
ACV in Table II.
TABLE I: USED APPLIANCES AND TAGS FOR EXPERIMENT
Tag
B1
B2
To
Mo
PC
Dr
F1
F2
VC
WK
Then, to show the impact of the proposed NIALM method in this paper, first each appliance power profile was observed under different voltage levels. Then corresponding signature databases were constructed by also incorporating the supply voltage levels (as described in Section V-B). After that, accuracy of the proposed NIALM method was observed under voltage varying real residential environment. These obtained accuracy values for each tried appliance combination are denoted by AV V in Table II.
level (230 V). Then, from the observations, ALSD and CLSD were formulated as described in Section III. After that, accuracy of the initial NIALM method described in Section IV (i.e. the NIALM method proposed in [2]) was observed under voltage varying real residential environment. These obtained accuracy values for each tried appliance combination are denoted by
Fig. 9 Hardware setup for case study
07th-08th September 2017
International Conference on Advances in ICT for Emerging Regions ICTer2017
Real-Time Non-Intrusive Appliance Load Monitoring Under Supply Voltage Fluctuations TABLE II: REAL-TIME APPLIANCE IDENTIFICATION ACCURACIES COMPARISON ACV%
AVV%
ACV%
AVV%
B1
52.1
93.2
F1
33.2
80.2
B1+B2
51.0
91.2
Dr
60.1
98.7
B1+B2+To
48.8
86.4
PC+Mo
60.2
77.5
To
62.3
93.5
To+PC
66.2
78.5
B2+To+PC
55.8
79.2
PC+Mo+F1+B2
32.0
72.0
VC
40.2
98.5
VC+WK+F1+B1
45.7
70.5
WK+B2
45.2
80.2
PC+Mo+VC
40.5
78.3
B1+VC+WK
30.2
73.0
B2+F1+Dr
57.8
86.5
Combination
Combination
ACKNOWLEDGMENT We would like to acknowledge the financial support provided by the National Science Foundation Sri Lanka (Research Grant No: RG/2016/EA & ICT/01). REFERENCES
Furthermore, another test was conducted in which few different appliance combinations were turned ON sequentially while maintaining a time varying supply voltage level as shown in Fig.8. Then, using two processors, the identification accuracy was observed comparatively with and without the voltage fluctuation correction proposed in this paper. Observed accuracy levels shown in Table II and Fig.8 illustrates the robustness of the proposed NIALM method under supply voltage level variations. Further, it shows that it can detect the turned ON appliance combination accurately taking real measurements in real-time even under supply voltage varying situations. Further, it was observed that, conducting the signature learning process under a variety of supply voltage levels can slightly increase the accuracy of the NIALM method proposed in [2] but only at a cost of increased computational power. In contrast, with the proposed voltage fluctuation corrected NIALM method in this paper, using the same learning process, more accurate results were obtained using comparatively less computational power. Furthermore, it was observed that, some appliance combinations under some voltage levels tends to show indistinguishable power profiles to the naked eye. But, through the uncorrelated spectral decomposition based NIALM technique proposed in this paper, it can clearly distinguish such appliance combinations. VI. CONCLUSIONS This paper proposes a novel NIALM approach which runs in a real-time setup delivering identification results in real- time at a 1 Hz frequency. The most important contribution of this paper is the introduction of voltage fluctuation correction mechanism to the NIALM method, such that it can deliver accurate and robust identification results even under severe residential supply voltage level fluctuations. Since residential voltage level regulation is a major problem in most of the developing countries, such a remedy is essential to implement NIALM methods in real-households in such countries. Obtained high accuracy levels in the proposed NIALM method under supply voltage level variations proves the applicability of advanced Demand Side Management techniques even in developing countries such as in Sri Lanka, through a real time NIALM implementation as proposed in this paper. Moving forward, we
07th -08th September 2017
plan to develop and apply the effect of derivatives of supply voltage signal on to other SC’s to further improve the accuracy and the robustness of the NIALM system.
[1] C. Dinesh, B. W. Nettasinghe, R. I. Godaliyadda, M. P. B. Ekanayake, J. Ekanayake, and J. V. Wijayakulasooriya, “Residential appliance identification based on spectral information of low frequency smart meter measurements,” IEEE Transactions on Smart Grid, vol. PP, no. 99,pp. 1–12, 2015 [2] S. Welikala, C. Dinesh, M. P. B. Ekanayake, R. I. Godaliyadda, and J. Ekanayake, “A real-time non-intrusive load monitoring system,” in IEEE 11th International Conference on Industrial and Information Systems (ICIIS 2016), Roorkee, India, Dec. 2016. [3] S. Welikala, C. Dinesh, G. M. R. I. Godaliyadda, M. P. Ekanayake, and J. Ekanayake, “Robust non-intrusive load monitoring (nilm) with unknown loads,” in 2016 IEEE Conference on Information and Automation for Sustainability (ICIAfS 2016), Galle, Sri Lanka, Dec. 2016. [4] G. W. Hart, “Nonintrusive appliance load monitoring,” Proc. IEEE, vol. 80, no. 12, pp. 1870–1891, December 1992. [5] W. Wichakool and Others, “Modeling and estimation current harmonics of variable electronic loads,” IEEE Trans. Power Electronics, vol. 24, pp. 2803–2811, 2009. [6] G. F. H. Lam and W. Lee, “A novel method to construct taxonomy electrical appliances based on load signature,” IEEE Trans. Consumer Electronics, vol. 53, no. 2, pp. 653–660, 2007. [7] C. Dinesh et al., “A subspace signature based approach for residential appliances identification using less informative and low resolution smart meter data,” in 2014 9th International Conference on Industrial and Information Systems (ICIIS), Dec 2014, pp. 1–6. [8] H. G. C. P. Dinesh, P. H. Perera, G. M. R. I. Godaliyadda, M. P. B. Ekanayake, and J. B. Ekanayake, “Residential appliance monitoring based on low frequency smart meter measurements,” in 2015 IEEE International Conference on Smart Grid Communications (SmartGridComm), Nov 2015, pp. 878–884. [9] W. X. M. Dong, M. C. M. Meira and W. Freitas, “An event window based load monitoring technique for smart meters,” IEEE Trans. Smart Grid, vol. 3, no. 2, pp. 782–796, June 2012. [10] C. Dinesh et al., “Non-intrusive load monitoring based on low frequency active power measurements,” AIMS Energy, vol. 4, no. 3, pp. 414–443, 2016. [11] M. Figueiredo et al., An Experimental Study on Electrical Signature Identification of Non-Intrusive Load Monitoring (NILM) Systems. Berlin, Heidelberg: Springer Berlin Heidelberg, 2011, pp. 31–40. [Online]. Available: http://dx.doi.org/10.1007/978-3-642-20267-4˙4 [12] H. G. C. P. Dinesh, P. H. Perera, G. M. R. I. Godaliyadda, M. P. B. Ekanayake, and J. B. Ekanayake, “Individual power profile estimation of residential appliances using low frequency smart meter data,” in 2015 IEEE 10th International Conference on Industrial and Information Systems (ICIIS), Dec 2015, pp. 140–145. [13] M. Iqbal and L. Automation, “Improving power quality amp; reliability in developing African countries,” in IET Seminar on Power Quality, Nov 2012, pp. 1–37
International Conference on Advances in ICT for Emerging Regions ICTer2017