Software applications for interpreting geoelectric data in ground water exploration techniques. T.S.Badrinarayanan1, G.Thiyagarajan2. 1
Geoscientist, B square geo tech services, Kollidam, Sirkali taluk,
[email protected] 2
Geoscientist, Geo Technical services, Coimbatore-35, Tamilnadu,
[email protected]
Abstract: Now days we are living in a digital era where most of our activities are being helped by digital equipments. All most in all fields, computers & software are used for fast generation of data & data base management. A long time ago hydrogeologist and petro physic scientist calculated and analyzed geoelectrical sounding data manually but now, the developing digital technology gives birth to new methods to analyze geoelectrical sounding data. In all methods of geophysical investigations to prospect the natural resources, software programs are used. Due to fast urbanization, frequent adverse seasonal conditions & over exploitation of water resources, the demand for ground water sources, being the safe alternate, has increased a lot. In this present scenario of depleting and dwindling ground water tables, it has become a herculean task to explore the very deep aquifers especially in hard crystalline rock terrains of drought prone areas by hydro geo electrical investigations. Though ample of empirical, semi empirical methods and authentic academic curve matching techniques are available to analyze and interpret the geoelectric data which are generally manual, time consuming and cumbersome process. For analyzing and interpreting the data, lot of software programs are available for rapid processing by which the subsurface lithology can be delineated and ultimately the ground water potential can be assessed. Some of the common software packages are IPI2Win, Surfer, Resist, Inverse slope, VES, Geosoft- Winsev & GIS. All such Software programs are applied for 1D subsurface geoelectric layer modeling. Commonly VES [vertical electrical sounding] which is one type of geoelectric investigation under surface geophysical exploration methods and VES curves can be rapidly and precisely generated for further qualitative and quantitative interpretations to get geolectric parameters. By application of different software packages it is possible to analyze the data accurately and fruitfully for achieving good success rate. It is needless to say that software applications in ground water exploration techniques are a boon to the hydrogeologists. No doubt it is more accurate, less time consuming, user friendly and easy to use.
Keywords: Hydrogeo electric, vertical electrical sounding, VES curves, geoelectric parameters and subsurface lithology.
Introduction: The basic four major types of ground water exploration methods are, aerial surface, subsurface and esoteric [7]. Under surface methods, geological, geomorphological, hydrogeological and geophysical investigations are commonly done. Under geophysical category different physical properties are used
Electrical
prospecting being the common method in which electrical conducting property of earth is employed. Geophysical resistivity techniques are based on the response of the earth to the flow of electrical current. Widely and globally geoelectric investigations, which are cost effective, are employed to prospect the ground water resources.
1
Interpretation: The main aim of the resistivity technique is to understand the nature of the subsurface formations through the measurements made over the surface of the earth. The interpretation of resistivity data is done in two stages: Processing of data to get the geoelectric parameters in terms of resistivities and depths/ thicknesses and using these parameters to infer the nature of subsurface formations on the basis of geological knowledge and correlative studies [5]. To achieve the ultimate objective one has to analyze the field VES curves by interpreting them suitably and properly. There are two approaches to analyze and interpret the VES data, qualitative and quantitative.
Computer techniques of interpreting VES data: The facilities in fast computation of apparent resistivity curves for multilayered media has brought the concept of using iterative process of analyzing the resistivity sounding data. By using computer techniques, it is possible to process multi layered VES curves rapidly, exactly and precisely. Computer application in VES automatic interpretation can either be direct or iterative [7].
Direct inversion technique: Use the field apparent resistivity data by inversion to arrive directly at the layer parameters. The direct inversion is dependent on the recurrence formula developed by Pekeris [1940]. Broadly speaking, the direct inversion methods involve the steps of using linear filter theory to determine the sample values of resistivity transform from the observed apparent resistivity data, using the early part of the transform curve to determine the layer parameters of the top layer and the reduction of the resistivity transform curve a lower boundary plane [7].
Iterative interpretation technique: Automatic iterative techniques are more popular with the field geophysicists as prior information can be used in the interpretation VES data. The automatic iterative interpretation is normally carried out with the process of either guessing a initial model from the field raw data or arrived by any other methods like curve matching, generating a VES curve from this initial model which is compared with original field curve [7]. If the discrepancy between the two is very large, the model parameters are changed either by geophysicists or by computer itself based on some logic incorporated in the software. The subsequent generation of theoretical curves and changes in model parameter is continued in each iteration till an exact solution is obtained. Such a method of computer interpretation is very rapid and can give satisfactory results depending on the model given initially. Koefed [1979] has described in detail several computer techniques available for VES processing.
Software packages for 1D geoelectric layer modeling: IPI2 Win, Resist, Inverse slope, Winsev, Surfer, VES, Rinvert, 1X1D, Res1D, Zhond 1D.
Software packages for 2D & 3D geoelectric layer modeling: Res2D, Zond 2d, Voxler, Surfer, and Res3D.
1D geoelectric layer modeling : IPI2 Win: It is designed for automated and interactive semi-automated interpreting of VES or induced polarization [IP] data obtained with most popular arrays, like Wenner, Schlumberger, Pole-dipole. IPI2 Win can be run on any computers with Window 95/98/NT operating systems [11].
2
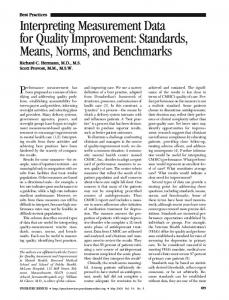
IPI2Win was developed using Delphi 5 by the Borland Int and is distributed by the Geoscan- M-ltd, Moscow, Russia. The IPI2 Win 3.0 1a version has been used to process and analyze the VES data in both sedimentary/alluvial and crystalline rock terrains to explore the ground water potential pockets.
Figures-1 & 2- IPI2 Win outputs- hard rock terrain-Pseudo & Resistivty sections.
Fig-3, Conductance window.
Fig-4, Pseudo section- coastal aquifers.
Resist: Resist [Vander Velpen, 1988] is a processing package for interpretation of resistivity data acquired by common arrays Wenner, Schlumberger and Dipole-dipole [14 & 15]. Resist runs under the MS-DOS or PC-DOS operating system. Resist file format is made compatible with the Geosoft’s file format.
Fig-5, Resist output.
Inverse slope: Sanker Narayana and Ramanuja Chary [1967] proposed Inverse slope this method initially as semi-empirical method [4 & 5]. The software has been developed on the basis of longitudinal conductance i.e., AB/2
3
/ pa Vs AB/2 plot on linear scale and it is a Java based software. This program is developed by IGIS [P] Ltd, Hyderabad.
Fig-6, Inverse slope software- geoelectric profile.
W-Geosoft-Winsev: This program is designed for processing of electrical soundings by Wenner, Schlumberger and Pole-pole arrays. The user may enter a model with 20 layers, or alternatively let the program create a model automatically [Inverse modeling]. The model may be modified or adjusted in a least square sense. Any thickness or resistivity may be fixed that the program does not modify them. Profiles of several electrical soundings may be drawn. Miguel Borreguero and Jacques Jenny developed this program between 1993 and 2004. It can be run on PC Windows [95/NT or up].
Fig-7, Winsev software- VES curves & geoelectric profiles.
Rinvert: Rinvert is a complete resistivity sounding modeling system for three of the most popular electrode arrays: Schlumberger, Wenner and Bipole-Bipole [12]. RINVERT is optimized for the Windows environment with a complete graphical user interface and full mouse support for ease of use. RINVERT for Windows provides a unique facility for equivalence analysis. RINVERT for Windows automatically modifies an initial estimate of a layered
4
earth model until the simulated and observed sounding data closely agree. RINVERT for Windows also displays the sounding curve and goodness-of-fit for each iteration.
Figures-8 & 9-Rinvert, Inverse & equivalence models.
Surfer: A Powerful Contour and 3D Surface Mapping and Plotting Software for Scientists and Engineers. Produced by Golden Software, Surfer provides more gridding methods and more control over gridding parameters. The grids can be displayed as outstanding contour, 3D surface, 3D wireframe, watershed, vector, image, shaded relief, and post maps. Surfer's automatic profile tool makes it easy to visualize the change in Z value from one point to another. Geoelectric data like apparent resistivity, conductance[S] and transverse resistance [T] can be projected as iso apparent resistivity, iso S and iso T maps. It is powerful tool for qualitative interpretation of geoelectric parameters there by anomaly zones can be demarcated.
Figures-10 & 11- Surfer-9, 3D elevation & isoresistivity maps.
IX1D: is a 1-D Direct Current (DC) resistivity, Induced Polarization (IP), Magneto telluric (MT) and electromagnetic sounding inversion program supporting most DC resistivity arrays, including Wenner,
5
Schlumberger, Dipole-dipole, Pole-dipole dipole and Pole Pole-pole pole arrays, Resistivity only or Resistivity with IP measurements [8]. It is developed by Interpex ex Limited with forward, inverse modeling and equivalence analysis.
Figures-12 12 & 13 13-1X1D- VES curve & geoelectric layers.
Resix v-3: Resix is an interactive, graphically oriented, forward and inverse modeling program for interpreting resistivity sounding data in terms of a layered earth (1 (1-D) D) model. Sounding curves values are entered as apparent resistivity as a function of spacing. Forward modeling enables you to calculate a synthetic resistivity sounding curve for a model with up to ten plane layers. Resistivity sounding curves are calculated using linear filters.
Figures-14 14 & 15 15-Resix-VES field curves & geoelectric layers.
Res 1D: It iss a program for forward and inverse modeling 1D resistivity & IP data for Wenner and Schlumberger arrays,[9] developed by M.H.Loke, Geotomo software software, Malaysia.
6
Fig-16- Res 1D- VES curve.
Zhond: Zond-IP is a computer program for 1D interpretation of profile data obtained by various modifications of VES. Friendly interface and ample opportunities for data presentation allows solving assigned geological problem with maximum efficiency [17]. Zond-IP is an easy-to-use instrument for automatic and semiautomatic (interactive) profile data interpretation and can be used on IBM-PC compatible PC with Windows system.
Figures-17 & 18-VES data, curve & pseudo sections.
Earth Imager 1D: is an inversion modeling software program used to interpret one-dimensional electrical resistivity data and reveal a layered model of subsurface geology [1]. EarthImager 1D can process vertical electrical sounding (VES) data collected with Schlumberger, Wenner, dipole-dipole, pole-pole, and various other arrays. It is a product of advanced geosciences Inc, Texas,USA. AGI EarthImager 1D is a Windows 32-bit platform based computer program that interprets one-dimensional (1D) electrical resistivity sounding data and produces a layered resistivity model that reveals subsurface geology. EarthImager 1D processes vertical electrical sounding (VES) data collected with Schlumberger, Wenner, dipole-dipole, pole-pole and other arrays. The forward modeling calculation is based on a 2D finite element method. Both smooth model inversion and damped least squares inversion methods were implemented in EarthImager 1D.
7
Fig-19,Earth 19,Earth imager imager- VES curve & geoelectric section.
VES-2000: This software package, available for compatible PC IBM systems and implemented in Windows® environment, has been conceived for the inversion, on data processing basis, of vertical electric soundings realized with the most currently used spreading types types[16]. It is a product of Pasi, Italy.
Figures-20 & 21-VES data &curve.
2 D and 3D imaging software: Res 2D INV: it is for 2D inversion of resistivity and IP using least square method, for Windows 98/Me/2000/NT/XP [10]. It is a product of Geotomo software software, Malaysia.
8
Fig-22- Res 2D, Pseudo & inverted 2D images of a coastal aquifer.
Zond res2d: This program is designed for two-dimensional interpretation of electrical tomography data by resistivity and induced polarization method in land, cross cross-borehole and water cases. ZondRes2d represents ready solution for resistivity and IP imaging imaging,, and solves wide range of problems from mathematical modeling and sensitivity analysis to quality control, field data processing and 2D inver inversion [18].. Convenient interface and variety of data visualization features allow solving wide range of geological problems with maximum effectiveness.
Fig Fig-23-Zond 2D- pseudo & inverted images.
Earth Imager 2D: AGI EarthImager 2D is a two-dimensional dimensional inversion modeling software for resistivity and induced polarization (IP) imaging. It interprets data collected by the SuperSting Wi-Fi. The data set is processed into a 2D cross-section of the earth. It is a product of advanced geosciences Inc, Texas,USA.
Fig-24, Earth imager, 2D image.
9
Res 3D inv: It is also a product of Geotomo of Malaysia, for 3D inversion of resistivity and IP data. This program is designed to invert data collected with a rectangular grid of electrodes. The RES3DINV program uses the smoothness-constrained least-squares inversion technique to produce a 3D model of the subsurface from the apparent resistivity data alone.
Fig-25-Res 3D image.
Voxler: With Voxler’s extensive 3D modeling tools, it is easy to visualize multi-component data for geologic and geophysical models, contamination plumes, borehole models, or ore body deposit models [6]. It is a product of Golden software, Colorado, USA.
Fig-26, Voxler- 3D resistivity projection.
GIS software: Geographic Information System [GIS] is referred to the computer system which handles geographic data used in substantive applications. GIS is a powerful set of tools for collecting, storing, retrieving, transforming and displaying spatial data for the real world for a particular purpose [13]. Some application areas of GIS are environmental planning, water resource management, agriculture, natural resource management. Arc info and Arc view of ESRI are powerful GIS tools commonly used in hydrogeological investigations. To delineate ground water potential zones different thematic layers are integrated by GIS tools. Resistivity contour maps, lineament densities, weathered zones, aquifer models
10
Figures-27 & 28- GIS outputs-EC contour map & Thiruvadanai aquifer 3D model.
Figures-29 & 30- GIS-Lineament DEM & Ground water prospects map.
can be generated by GIS tools. GIS can serve as a powerful analytic and decision making tool in water resources management.
Conclusion: Different software packages and its application for analyzing and interpreting geoelectric data for one, two and two dimensional modeling have been discussed in detail. IPI2 Win package for 1D analysis of VES data is a freeware. All most all other programs are commercially available. By software applications the geoelectric layer modeling can be achieved successfully and fruitfully there by subsurface lithology can be delineated for final assessment of ground water potentials. By using different software packages for ground water prospecting studies, it is possible to do the work rapidly, precisely and accurately with less time consumption. Though curve matching technique is reliable, authentic and academic, it is manual, time consuming and tedious process. No doubt that the software applications for ground water exploration techniques are a boon to hydro geologists, geophysicists and water resource engineers. The software packaged have to be applied to process geoelectric data in integration with field, geological, hydrogeological conditions to achieve good success. The models derived need to be correlated with existing lithologs of bore hole for good results. It is not that, the success can be achieved by mere application of
11
software techniques. It is a tool and its application helps in interpretation process and there by failures can be minimized if the techniques are properly employed.
References: 1. www.agiusa.com-AGI advanced geosciences Inc.-Earth Imager 1D inversion software. 2. Alwa Kurniawan- Basic IPi win tutorial, basic principles in using IPi win software-Hydrogeology world, 2009.
3. Alain Burgisser, Jacques Jenny, Miguel Borreguero- Instruction manual, Winsev-6, Electrical soundings processing for Windows.
4. T.S.Badrinarayanan, R. Venkatesan, Inverse slope method of interpretation of geoelectrical sounding curves and its application for ground water exploration in crystalline rock terrains- Mineral exploration: Recent strategies, 2007., Annamalai University, Chidambaram, Tamilnadu.;
5. T.Gangadhara Rao, K.R.Ramanuja Chary- A monograph on ground water exploration by resistivity, S.P and well logging techniques, Integrated geo instruments & services pvt Ltd, Hyderabad-17.
6. www.GoldenSoftware.com – Golden software, Colarado, USA- Voxler 4, Full user guide, 3D well & volumetric visualization-2015.
7. Hydrogeology Wing, TWAD Board, Chennai- Hand book for TWAD hydrogeologists, 2002. 8. www.interpex.com, Interpex ltd, Golden, USA- 1X1D v2 instruction manual, version.1, 2008. 9. www.geoelectrical.com, M.H.Loke, Res1D, Ver.1, for Windows 95/98/Me/2000/NT-2001. 10. www.geoelectrical.com, M.H.Loke, Res2 Inv, Ver.3.56, for Windows 95/98/Me/2000/NT-2001. 11. Moscow state university, Geological faculty, Department of geophysics- IPI2 Win user’s guide, Moscow2001.
12. Scientific software group, Sandy, Utah, 1998-Rinvert overview. 13. Training centre, TWAD Board, Chepauk, Chennai- Introduction to remote sensing and GIS for formulation of water supply and sewerage projects- 2006-07.
14. Vander Velpen B.P.A- Resist’s User guide- ITC, Department of Earth resources survey, Kansal the Netherlands-1988.
15. B.P.A. Vander Velpen and R.J.Sporry- Resist a computer program to process resistivity sounding data on PC compatibles, Computers and geosciences, Vole 19, No 5, pp.691-703,1992
16. www.pasigeophysics.com- VES-2000, software for vertical electrical soundings. 17. http://zond-geo.ru/english/zond-software/ert-and-ves/zondip1d/-Zond ip 1D software 18. http://zond-geo.ru/english/zond-software/ert-and-ves/zondres2d/-Zond res 2d.
12