Software Product Line based Approach towards the Software Product Quality Improvement Zeeshan Ahmed Mechanical Engineering Informatics and Virtual Product Development Division, Vienna University of Technology, Getreidemarkt 9/307 1060 Vienna Austria
[email protected]
Abstract. In this research paper two intensive problems to the software rose by the software industry .i.e., identification of fault proneness and increase in rate of variability’s in traditional and product line applications are discussed. To contribute in the field of software product development and to mitigate the aforementioned hurdles, a measurement analysis based approach is proposed. The proposed solution is based on the concepts of analyzing preprocessed source code characteristics, identification of the level of complexity by several procedural measurements and objects oriented source metrics and visualize the results in two and three dimensional diagrams. Furthermore, the capabilities, features, potential and effectiveness of implemented solution are validated by means of an experiment. Keywords— Fault proneness, Measurement analysis, Product line
Introduction The main objective of every product based organization/company in any field of industry is the successful revenue generation which totally depends on the market value of manufactured product. If the product is good, qualitative and timely available in best economic price in the market, the probability of getting more profit out of it is also very high. On the other hand if the quality of the product is not up to the mark, the organization/company will fall soon. Thus, the maintenance of product quality is of pivotal importance in software industry. In this research paper the main focus of discussion is software industry and software products. These days software products have brought a revolution in the world. In almost every corporate organization and industry, software products are employed in different forms e.g. database system, knowledge management, product data management and several different automatic intelligent systems etc. Where software industry is contributing to almost every field of the world there at the same time it is also facing the problems due to the high failure rate of software products. No doubt software project/product development process and life cycles are mature enough to support but still there are some areas which need more attention. One of the most important parts of any software product development process or life cycle which directly affects the quality of the software product is coding / programming.
With the passage of time, products are increasing in size and becoming large, especially when we talk about software products based on product line architectures. This increase in size of software products increases the Line of Code (LOC) which somehow causes the increase in complexity of the source code. If the complexity in software product source code is not traced and tracked, it will start causing an increase in variabilities in the source code which will ultimately increase the probability of getting a fault prone product resulting loss in business in the end. Based on previous discussion, the two questions leading to the same goal of having a fault prove software product arises in mind. 1. How to reduce the rate of variabilities in source code, if product in under development process? 2. How to identify the rate of fault proneness if the product is already developed? First of all to avoid getting variabilities in source code we have to stop the increase in complexities and to stop rise in complexities in source code we have to track the process of source code development line by line, which can be quite hectic and slow. Secondly, to identify the rate of fault proneness in already developed product, we have to identify the rate and the effect of variabilities in source code. With eyes focused on the aforementioned problems of reducing variabilities and identifying the rate of fault proneness in software products we have proposed and discussed an approach in section 2 of this research paper. We have also described the system design, model and development process of the proposed solution in section 3 of this research paper. Moreover, in the end we have justified the strength of proposed approach in an experiment in section 4 and concluded the paper in section 5 of this research paper.
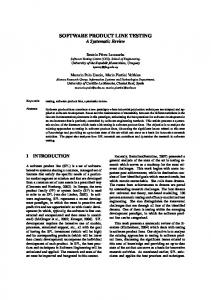
1. Proposed Solution The proposed solution to the aforementioned problems comes in the form three integrated components each of which aims at performing a specific task .i.e., Analysis, Measurement and Visualization respectively, leading an in depth understanding to the source code in context of rate of variabilities and fault proneness. Analysis reveals the analysis results of the source code so as to identify its complexities and variabilities. Measurement supports by calculating source code based metrics to evaluate the rate of fault proneness and visualization helps in understanding the produced complex statistical results by producing several different diagram .i.e., graphs, charts and maps etc.
Figure 1. Three component based approach
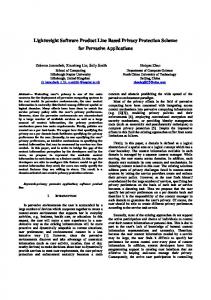
To provide a comprehensive solution to the software practitioners in analyzing the software product source code, identifying software level complexities and variabilities, measuring performance by calculating source code metrics and identifying the rate of fault proneness we have proposed a solution called Zeeshan Ahmed Java-Prepreprocessed source code analyzer (ZAJ). ZAJ is designed to dynamically analyze the internal preprocessed source code characteristics of both the single and product line architecture based software products, it computes the relevant source code metrics to identify the rate of fault proneness in software products and visualize the obtained results during analysis and measurement. As the name shows ZAJ is only designed for the software products developed in Java programming language [1]. To fulfil the desired jobs and obtain required result ZAJ is divided in to four main components .i.e., ZAJ-Analyzer, ZAJ-Data Manager, ZAJ-Measurer, and ZAJ-Visualizer which works in cyclic fashion as shown in Figure 2.
Figure 2. ZAJ Conceptual Design
ZAJ Cyclic Process works in five steps. In the first step, source code of software product written in Java programming language are treated as input context, in the second step internal characteristics .i.e., package, class, methods, functions, declarations, expressions and conditions etc. of input source code are analyzed. After that, the resultant information is stored and managed in a relational data base called ZAJ-Data Manager. Afterwards, in the fourth step ZAJ-Measurer using Goal Question Metrics (GQM) [2] will calculate source code metrics from the resultant output of ZAJ-Analyzer stored in relation database using Data Manager. In the end as the last step ZAJ-Visualizer will produce visualization of obtained results in different 2D and 3D diagrams e.g. graphs, line charts, bar charts and tree map with respect to the context and semantic.
2. Design and Development To take advantage in the development part of the research we have designed and presented the system design of ZAJ in section 3.1 based on the proposed conceptual design of ZAJ as shown in Fig 2. Moreover software tools and technologies involved in ZAJ
development are shown in section 3.2, and implemented solution is described in depth along with the available features in section 3.3. 2.1 System Design and Semantic Model Designed system architecture of ZAJ as shown in Fig 3 is composed of six main components .i.e., Source Code Analyzer, Semantic Modeler, Data Manager, Measurer, Visualizer and Editor. Each of six components has to play an important role to attain the final goal. These six components altogether works in a sequenced in a manner that the source code of software product is first treated by Source Code Analyzer, which analyses the internal source code characteristics. To fulfil the job Source Code Analyzer is further divided into two further sub components .i.e., Lexer and Parser. Lexer tokenizes the source code by generating lexical token and verifies the syntax with respect to the grammar of Java programming language [1]. Parser uses the generated tokens to verify the semantics of syntax with respect to the grammar rules of Java programming language [1].
Figure 3. ZAJ System Sequence Design
Based on the resultant information, if the syntax and semantic is verified then the Semantic Modeler generates a semantic model consisting on the resultant information of Source Code Analyzer as shown in Fig 4. The designed ZAJ-Model is based on the grammatical structure of Java programming language [1] and consists of 3 main components .i.e., Project, Package, and Class. In the first constituent Project, the whole source code is divided and classified in two categories .i.e., Artefact and Component. Artefact contains the information about all the project files including relevant e.g. java source code and irrelevant e.g. images files where as the Component contains only the source code files. Then in the second constituent Package, all the packages are included and filtered again in to two categories .i.e., Libraries and Project Files. Libraries are the source code file which are only used or external files internally used and Project files are the files belonging to the project. Then in the last and third constituent Class again we have two more categories Feature and Expression. Feature contains all declarations including functions and methods where as Expression contains all expressions in the source code.
Figure 4. ZAJ Model
Constructed ZAJ Model is then stored and managed in relational database by Data Manger in two categories .i.e., Relations and Relationships. The stored relational information is then used by ZAJ-Measurer to calculate source code metrics which then can be visualized using Visualizer in 2D and 3D diagrams. Finally the last component .i.e., the Editor, provides options to import, export and run external and internal queries (scripts) to extract and utilize the obtained results so as to take advantage in making analytical decisions by making some external statistical calculations and measurements. 2.2 Technologies Involved ZAJ is implemented using freely available object oriented software development language .i.e., Java [1], a language recognizer which interprets, compiles, and translates grammatical descriptions containing actions in a variety of target languages .i.e., ANTLR [3], a relational database management systems .i.e., MySQL [4] and to produce visual representation of structural results in abstract graphs and networks we have used an open source graph visualization software Graphviz [5].
Figure 5. ZAJ- Involved Technologies
3. ZAJ Tool We have implemented above discussed system sequence design and semantic model in section 3.1 using tools and technologies discussed in section 3.2 in the form of a real time software application .i.e., ZAJ Tool as shown in Fig 6. Over all ZAJ Tool is divided in to three main parts .i.e., ZAJ–Analyzer, ZAJ-Measurer and ZAJ-Visualizer. Source code of software applications is input and analyzed in ZAJ-Analyzer, measures are calculated in ZAJ-Measurer where as ZAJ-Visualizer produces the visualization of results.^
Figure 6. ZAJ-Tool Screen Shots
Currently developed and available version of ZAJ Tool is capable of doing the following jobs • Take complete single and product line applications along with all the relevant and irrelevant project files as input. • Identify the relevant source code files of the project. • Analyze source code files by generating lexical tokens and parsing. • Create semantic model .i.e., ZAJ Model and store in to Data Manager. • Calculates Size, Complexity, Inheritance and Coupling Measures described details in Table 1. Table 1. Measures NO.
Category
1
Size Measures
Metrics 1. 2. 3. 4. 5. 6. 7. 8.
Number of artifacts Number of components Number of namespaces Number of includes Number of macros Number of classes Number of includes Number of parameters
2
Complexity Measures
1. 2.
3
Inheritance Measures
4
Coupling Measures
1. 2. 3. 4. 5. 6. 1. 2. 3.
MCC-Number of control paths WMCOM-Number of internal level class complexities based on number of methods and statements CLD - Class to leaf depth DIT – Depth in Tree CIR - Class inheritance relationship Number of inherited methods in the classes NOC- Number of children for each class NIT- Namespace inheritance tree Coupling between caught exceptions of classes Coupling between the attributes of classes Coupling between methods in classes
• Visualizes the results in Graphs, Tree Maps and Charts described in Table 2 Table 2. Visuals NO.
Category Graphs
1
2
Tree Maps
Context 1. 2. 3. 4. 5. 1. 2. 3. 1.
3
Charts
2. 3.
Class inheritance relationship Namespace relationship Coupling between attributes Coupling between features Parameter and feature Classes, components and features Classes and Sub classes All the artifacts with respect to their file size used in the application Artifact size and number of features contained in the classes Available Feature with respect to specified type of the application Code Flow, type and count of features.
4. Validations To validate the potential and effectiveness of ZAJ Tool we have performed a simple experiment. We have used a client server based data base application based on product line architecture and developed in Java [1] .i.e., MIVP-Print Application as the context. This application is deployed in computer labs and network administration department. The job of MIVP-Print Application is to check printer and if some user sends a request for printing then it must record and maintain the information about printer, print job and user in database. Moreover this application also provides small inventory/account system to generate bills. We inputted the MIVP-Print Application in ZAJ Tool and resulted with several different results and observations; some of them are clearly described and presented in Fig 7.
Figure 7. MIVP-Print Application Statistical Analysis & Visualization
The top left corner of Fig 7 presents the File Tree Map generated by the tool after the source code file size, type and association analysis. Where yellow colour boxes are representing Jar Files [1], Blue Files are representing Class Files, Green Files are representing Java Files and Gray File is representing the Image Files. The size of each box is with respect to the size of the file where as the placement of each box is with respect to the placement and association of files with each other and directory structure. This visual representation is helpful for the software practitioners in analyzing the over structure of the whole project. Then in the second diagram, in the centre of Fig 7, there is tree graph representing the structure of Packages used in the MIVP-Print Application, like which package is associated / inherited with which package. This visual representation is helpful for the practitioners to analyze the overall structure of the packages used in the project; moreover software practitioners can also take advantage in analyzing the complexity in relationship. Then in the end, in the right corner of Fig 7, there is a horizontal line chart providing the basic information about the basic source artefacts used and created in the MIVP-Print Application. This kind of visual representation is very helpful for the overall source code analysis. Because some time even the rate of increase or decrease in some source code elements with respect to class or package can also play a vital role in increasing or decreasing the complexity e.g. cohesive or coupled code.
5. Future Work As this is an ongoing in process research, in future, we are aiming to focus on the representation of some more detailed, concrete and optimized results using some big real time data sets to present and increase the effectiveness and potential of our proposed approach & implemented solution by helping software practitioners and analysts in analyzing the single and product line based applications.
6. Conclusion In this research paper we addressed two major issues .i.e., to reduce variabilities and identify the rate of fault proneness in software products. Then describing our own contribution towards the field we have presented an approach, its conceptual and implemented system design. Moreover we have briefly described the implemented solution .i.e., ZAJ Tool and in the end we have validated its potential and effectiveness in an experiment.
References [1] [2] [3] [4] [5]
Sun Microsystems’s production, Java, Reviewed February 2008, Victor R. Basili, Gianluigi Caldieram, H. Dieter Rombach, “THE GOAL QUESTION METRIC APPROACH”. Encyclopedia of Software Engineering, John Wiley & Sons, Inc., 1994, pp. 528-532 ANTLR, Reviewed February 2008, MySql Relational Database Management System, Reviewed February 2008, Graphviz: Graph Visualization Software, Reviewed February 2008,