how to find out similarity between two software projects when they are ... In order to overcome the limitations in the current similarity measures ... clustering and fuzzy logic [10, 22] which has several advantages over nearest ...... Stamelos, I., Angelis, L., Morisio, M.: Estimating the development cost of custom software.
Software Project Similarity Measurement Based on Fuzzy C-means Mohammad Azzeh1, Daniel Neagu1, Peter Cowling1 1
Department of Computing, University of Bradford, Bradford, BD7 1DP, U.K. {M.Y.A.Azzeh, D.Neagu, P.I.Cowling}@brad.ac.uk
Abstract. A reliable and accurate similarity measurement between two software projects has always been a challenge for analogy-based software cost estimation. Since the effort for a new project is retrieved from similar historical projects, it is essentially to use the appropriate similarity measure that finds those close projects which in turn increases the estimation accuracy. In software engineering literature, there is a relatively little research addressed the issue of how to find out similarity between two software projects when they are described by numerical and categorical features. Despite simplicity of exiting similarity techniques such as: Euclidean distance, weighted Euclidean distance and maximum distance, it is hard to deal with categorical features. In this paper we present two approaches to measure similarity between two software projects based on fuzzy C-means clustering and fuzzy logic. The new approaches are suitable for both numerical and categorical features. Keywords: Software Project Similarity, Fuzzy Logic, Fuzzy C-means.
1
Introduction
Software projects similarity measurement is the key accuracy of software cost estimation by analogy. It plays significant role in identifying closest projects to a project being estimated which in turn affects estimation accuracy [12]. The use of similarity measures between two software projects has been evaluated and confirmed in previous researches of software cost estimation. The most widely used approaches are based on nearest neighborhood techniques such as Euclidean distance [1], Manhattan [3], Weighted Euclidean distance [12] and Maximum measures [11]. In these algorithms the closest analogue to a project pi is the project with maximum similarity. Stamelos et. al. [19], and Mendes et. al. [11,12] compared between different types of distance metrics in analogy software estimation and revealed that using different distance metrics yield dissimilar results which indicate the importance of distance between software projects on effort estimation. According to Idri et al [7], software projects environment has significant impact on the similarity between two software projects, in that software projects within single company give different similarity than projects gathered from cross companies [8]. In general, nearest neighborhood based techniques suffer from several disadvantages [16, 17]. First, they depend mainly on numerical features and binary
data. Thus, it is difficult to handle categorical variables. Second, they are sensitive to the irrelevant features and missing values as discussed in [17]. Moreover, the attributes employed should first be normalized in order to have same degree of influence to further processing. In order to overcome the limitations in the current similarity measures between software projects we proposed alternative approaches based on fuzzy C-means clustering and fuzzy logic [10, 22] which has several advantages over nearest neighborhood techniques. First, it groups the most similar projects together in the same cluster and represent their features values in the same fuzzy set. This eventually will enhance prediction accuracy. Second, it handles uncertainty and imprecision, where each attribute is described by several fuzzy sets instead of using single values. The prime objective of this paper is to measure similarity between two software projects in terms of similarity between two fuzzy sets that they most belong to. For example, let A be the fuzzy set that has maximum membership value for project px and let B be the fuzzy set that has maximum membership value for project py. The similarity between two projects in terms of feature j is denoted as SMj(Fj(px), Fj(py)) which is intuitively identical to SMj(A,B) in this work. However, in order to find which cluster does software project p most belong to, we use max operator as depicted in equation 1. The overall similarity is aggregated by calculating the average of all similarities between fuzzy sets in each feature as discussed in section 4.1.
μ Ci ( p ) = max{μ C1 ( p), μ C2 ( p),..., μ Cc ( p )}
(1)
The reminder of the paper is organized as follows: Section 2 discusses related work. Section 3 introduces the Fuzzy c-means clustering algorithm. Section 4 presents our proposed method of similarity distance measurement between two software projects. Section 5 presents dataset. Section 6 compares the efficiency of our method with the most often used distance metrics in literature. Finally, section 7 summarizes our work and outlines the future studies.
2
Related works
To our knowledge, there is relatively little research in literature concerned with similarity between two software projects based on the fuzzy logic. Idri et al [7] proposed a new approach based on fuzzy logic to measure the similarity between software projects that are represented by categorical variables. They stated that the equality between two software projects is not null when they have membership different from zero to at least one same fuzzy set of Fj. They built rule base engine for each attribute to find distance between two software projects using max, min and i-or operators. It is interesting to observe from their work that Kleenes-Dienes aggregation is not valid for software project similarity, using i-or operator gave better and stable results than max and min operators. However, they claimed that each organization must initially determine appropriate linguistic quantifier that complies with their situation in order to obtain better results.
3
Fuzzy c-Means clustering
Like clustering algorithms which assign a data point to distinct cluster, Fuzzy cMeans (FCM) algorithm assigns membership values to each observation in all derived clusters. FCM aims at minimizing objective function Jm(A) to local minima which depends on the initial chosen of membership values. Different initial membership will lead to different local minima [1, 6, 13]. Indeed, there is no standard way to pre-assign number of clusters unless another algorithm is being used [9]. In addition, it is recommended to use weighting parameter m=2 in fuzzy clustering [13, 20]. After clustering data using FCM the next step is construct fuzzy model based on clustered data. In literature [6, 21] there are two main ways to construct fuzzy model from data, the first is the expert knowledge which is formed in if-then-rules where parameters and memberships are tuned using input and output data. The second is no prior knowledge about the system, so the model is built based on particular algorithms. However, the fuzzy model was constructed based on the second approach where membership functions obtained by FCM and projection as explained in [21].
4
Software project similarity approach
4.1
The first approach
To explain our first approach in more details, let px, py be two software projects described by M features Fj (j=1…M), for each feature (linguistic variable) there are j
several fuzzy sets Ak obtained by FCM and fuzzy identification as mentioned in section three where k represents the number of clusters. Particularly, we impose our approach to use fuzzy sets as normal fuzzy sets [15]. Our algorithm is described by the following steps: 1. for each linguistic variable, find fuzzy set Axj that represents maximum membership value of Fj(px) and fuzzy set Ayj that contains maximum membership value of Fj(py) by using maximum operators as depicted in equation 1. 2. for each linguistic variable, find SMj ( Axj , Ayj ) using approaching degree (see next paragraph). In terms of one feature, SMj(Fj(px), Fj(py)) is intuitively identical to SMj ( Axj , Ayj ). 3. find overall similarity between two M features software projects: M
(
)
SM ( p x , p y ) = avg SM j ( F j ( p x ), F j ( p y )) j =1
(2)
Consequentially, the closes analogue to a particular project is the project with maximum similarity.
The approaching degree mentioned in step 2 is a method used to assess the similarity between two given fuzzy sets in a particular universe of discourse X [15]. j
j
Let assume S(X) be a power set of normal fuzzy sets with Ak ≠ 0 and Ak ≠ X. Let A, B be two normal fuzzy sets where A, B ∈ S ( X ) . The similarity degree between two fuzzy sets A and B is assessed as shown in equation 3: SM ( A, B ) = min ( ( A • B ) , ( A ⊕ B ))
(3)
where ( A • B ) the inner product is defined by equation 4 and ( A ⊕ B ) is the outer product defined by equation 5: ( A • B ) = max(min[μ A ( x), μ B ( x)]) , x ∈ X
(4)
( A ⊕ B) = min(max[μ A ( x), μ B ( x)]) , x ∈ X
(5)
Particularly, when the value of SM(A,B) approaches a value 1, this represents that the two fuzzy sets A and B are “more closely similar”. When SM(A,B) approaches a value 0, the two fuzzy sets are “more dissimilar”. In software cost estimation, it is interesting to define a suitable fuzzy set membership function that copes with the problem domain. We have chosen Gaussian membership function for this research. The final form of similarity measure for one feature is given in equation 6 [14]:
SM(A,B)=min(
⎡ - ( a -b ) 2 ⎤ ⎢ 2⎥ e ⎣ (σ A +σ B ) ⎦
(6)
,1)
where a, b are the mean values; and σ A , σ B are the standard deviation of Fuzzy membership functions A and B respectively. In fact, the inner product of two fuzzy sets represents the membership value of intersection point between them. Definition 1. Let px and py be two software projects described by M features. Let Fj(px) mostly belong to fuzzy set Axj and Fj(py) mostly belong to fuzzy set Ayj . The similarity between two software projects in terms of features j is given as: - ( x- y )2 ( σ x +σ y ) 2
SMj(Fj(px), Fj(py))=min( e ,1) where x, y are the mean values and σ x , σ y are the standard deviation for Axj and
(7)
Ayj respectively.
Definition 2. The Overall similarity between two software projects px and py is given by equation 8: M
(
)
SM 1( p x , p y ) = avg SM j ( F j ( p x ), F j ( p y )) j =1
(8)
4.1.1
Example:
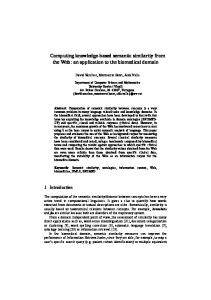
Fig. 1. Fuzzy sets for linguistic variable j.
Let assume there are three projects (p1, p2, p3) described by feature j as shown in figure 1; we want to asses which project is closer to p1. Let p1 mostly belong to fuzzy set B with parameters (b=30, σ B =9), and p2 mostly belong to fuzzy set D with parameter (d=50 , σ D =12 ), while p3 mostly belongs to fuzzy set E with parameters(e=70, σ E =14). According to definition 1: - (b-d )2
SMj(Fj(p1), Fj(p2))=min( e
( σ B +σ D ) 2 - ( b -e ) 2
,1) = min( e
- ( 30 -50 ) 2 ( 9 +12 ) 2
,1)=min(0.404,1)=0.404.
- ( 30 -70 ) 2 2
2
SMj(Fj(p1), Fj(p3))=min( e ( σ B +σ E ) ,1) = min( e ( 9+14 ) ,1)=min(0.049,1)=0.049. Thus, we conclude that project p2 is closer to project p1 than project p3. It is also worth to point out that using this approach could cause problems when a particular project belongs to two fuzzy sets at the same time with same maximum membership as shown in figure 2. For example, to compute similarity between p1 and p2 (SIMj(p1, p2)) there are two ways; first, if we assume that p2 belongs to fuzzy set B then the two projects p1, p2 are similar with degree over zero. Second, if we assume that p2 belongs to fuzzy set C then p1, p2 are more dissimilar and approaches 0 which is not realistic in this case. To avoid this problem we restrict our model to use the fuzzy set that presents larger similarity.
Fig. 2. Fuzzy linguistic variable with three fuzzy sets where p2 belongs to two clusters with same maximum membership value.
4.2
The second approach
Our second similarity approach is mainly concerned with partition matrix that is obtained by FCM. The final partition matrix contains membership of a project in each
particular cluster as shown in table 1.The similarity between two software projects is computed based on similarity between their fuzzy values as shown in equation 9 [15]. In this case, we have to decide how to assign membership for a new project. The simplest way is to use distance formula that is applied in FCM algorithm which tends to assign any new project to different clusters with a particular membership value. Table 1. Fuzzy partition matrix for software projects Project P1
Cluster A1
Cluster A2
... ...
Cluster Ak
P2
μ A1 ( p2 )
μ A2 ( p2 )
...
μ Ak ( p2 )
… ...
μ Ak ( pn )
μ A1 ( p1 )
…
μ A2 ( p1 )
…
…
μ A2 ( pn )
μ A1 ( pn )
Pn
μ Ak ( p1 ) …
k
SM 2 ( p x , p y ) =
∑ min( μ
Ai ( p x ), μ Ai ( p y ))
(9)
i =1
k
Where
∑μ i =1
4.3
Ai
( P) = 1
(10)
Project Similarity Properties
As in other software measurement fields it is appropriate to provide an evaluation for our similarity approaches. The validation of similarity measures will help us to ensure that our model respects the main properties of similarity between two software projects [7]. In the following paragraphs we introduce the main properties that are used to assess our model in narrow sense [5]. Let Fj(px) mostly belong to fuzzy set A with membership function parameters (a, σ A ) and Fj(py) mostly belong to fuzzy set B with membership function parameters (b, σ B ). Property 1. Similarity between a software project px to itself is equal to one. For feature j. According to equation 7: -( a - a ) 2
SM j ( F j ( p x ), F j ( p x )) =min( e
( σ A +σ A ) 2
,1)=>min( e 0 ,1)=>min(1,1) which produces
1. Then the overall similarity will be calculated using equation 8. m
(
)
SM 1 ( p x, p x ) = avg SM j ( p x , p x ) = avg (1,1....,1) = 1 . j =1
A significant issue arises when we deal with one linguistic variable. It can be seen that when two projects have different crisp values falling in the same fuzzy set they
have unity similarity degree same as similarity between project to itself. This seems not true and contradicts to the crisp set approach, where similarity between two close projects is not necessary to be unity unless they have the same feature value. For the second approach, this definition is true according to equations 9 and 10, let px={ μ A1 ( p x ) , μ A2 ( p x ) ,..., μ Ak ( p x ) } then:
SM2(px, px)= min( μ A1 ( p x ) , μ A1 ( p x ) )+...+min( μ Ak ( p x ) , μ Ak ( p x ) )=1. Property 2. The similarity between two different projects px and py must be less than similarity of project px to itself SM(px, py) min ( SM j ( F j ( p x ), F j ( p y )) , SM j ( F j ( p y ), F j ( p z )) )
5
The dataset
The analysis presented in this paper was based on ISBSG Repository (release 10, January 2007) which currently contains more than 4000 software projects gathered from different software development companies [6]. Seven effort drivers were selected including 3 numerical attributes (Adjusted Function points, Maximum Team size, and productivity) and 4 categorical attributes (development types, Business type, Application types, and organization types) in addition to the effort. We omitted the projects with missing values which results in 480 projects. Categorical variable must be handled because each of them has many categories. Rather grouping projects according to their nature, we intend to merge each categorical variable into two homogeneous categories and replaced by ordinal values (1=Low Effort, 2=High Effort). For example, in case of organization type, one would say that “wholesale & retail trade” and “financial” types would naturally be grouped in the same category but they are not. The merging was conducted using mean effort value of each category based on work of [18] in which the categories that has same impact on the mean effort have been placed together in the same group. We do consider this categorization is an ad hoc approach which follows a data driven context. Only Development type was categorized into three categories (1 = Enhancement, 2 = New Development, 3 = Re-development) according to the type of software development followed.
6
Results and Discussion
The results shown in Tables 2 and 3 were obtained using leave-one-out crossvalidation. The results obtained in Table 2 represent a sample of the similarity between software projects using our first approach. However, it can be seen that the maximum similarity between two software projects is always equal to one and obtained when two projects are similar (i.e. SM(Px,Px)). It is also observed that there is violation in property 3 because the FCM algorithm generates different initial membership values every time we run the leave-one-out cross validation. The way to solve this problem is to use the same initial membership function every time. It is worth to point out that the similarity between two different projects does not exceed similarity between a project to itself which consequentially respects Property 2.
The results obtained for the second approach as shown in Table 3 indicate that there is no violation in the similarity properties. Similarity between any project to itself is always equal one. In addition, the similarity between two different projects did not exceed one and still over or equal zero. The first approach has an advantage over the second approach in terms of the feature impact. The first approach takes into account the similarity between two projects in each feature while the second approach takes the distribution of membership values across clusters. Table 2. Similarity value between software projects using first approach P1 P2 P3 P4 P5
P1 1 0.97 0.87 0.93 0.65
P2 0.97 1 0.684 0.956 0.626
P3 0.86 0.684 1 0.845 0.569
P4 0.93 0.959 0.841 1 0.59
P5 0.656 0.635 0.568 0.58 1
Table 3. Similarity value between software projects using second approach P1 P2 P3 P4 P5
P1 1 0.406 0.148 0.263 0.405
P2 0.406 1 0.318 0.11 0.186
P3 0.148 0.318 1 0.469 0.604
P4 0.263 0.11 0.469 1 0.92
P5 0.405 0.186 0.604 0.92 1
In order to assess the performance of each similarity approach on software effort estimation, we compared our two approaches against Euclidean and weighted Euclidean distance in analogy estimation as shown in Table 4. This validation is analogous to Case-based reasoning techniques but it did no take in account its parameters (features subset selection, adaptation rules and case adaptation). For all similarity measures we first compared the actual effort with closest analogy, and then with the mean of K nearest neighbors where K=3. The results shown in table 4 represent the comparison between four similarity measures based on Mean Magnitude of relative errors (MMRE) and Performance indicator (Pred(e)). Pred(e) calculates how many MRE values fall below 25%. MMRE is the mean of estimating error for all individual estimates. MMRE has been criticised that is unbalanced in many validation circumstances and leads to overestimation more than underestimation [16]. Another approach called balanced mean magnitude relative error measure (BMMRE) [16] was proposed to overcome the limitation of MMRE. The new approach has been criticised to be more effective in measuring estimation accuracy. MMRE =
BMMRE =
1 n 1 n
n
| actuali - estimated i | actuali i =1
∑ n
(11)
| actuali - estimated i |
∑ min(actual , estimated ) i =1
i
i
(12)
According to Table 4 , Effort estimation based on our two approaches contribute to better estimation accuracy than those based on Euclidean distance and weighted Euclidean distance in terms of MMRE, BMMRE and Pred(0.25). The results of the MMRE evaluation criterion for both proposed approach are significant. Using mean of three analogies in the first approach gives slightly better accuracy. Whilst for the second approach, the good results achieved when two and three analogies have been used. In case of Pred(0.25) evaluation criteria, the best result obtained when using mean of three analogies in the first proposed approach, even though the other results in both proposed approaches are still significant. So we can figure out that using two approaches gives better results than using conventional geometrical distance measures. In Comparison with Idri et al [7] approach who used fuzzy logic to measure similarity between software projects. Their approach was mainly dedicated to ordinal categorical data, especially for COCOMO model. Moreover, there is a lack of evidence of how their approach could be useful for other datasets described by Nominal categorical data. Our approaches show how nominal categorical data can be also used in software projects similarity measurement. Their model was fuzzified based on experience where productivity ratio was used to find boundary of each fuzzy set. In our model we used automatic fuzzification process based on fuzzy c-means algorithm which seems more reliable than relying on experience. The aggregation operators (min and max) always give the extreme values and do not seem contributing in identification of the closest projects. While in our model we tried to take the influence of similarity between two software projects in each feature. Table 4. Comparison between proposed similarity measures against Euclidian distance and Weighted Euclidean distance on Effort estimation Evaluation Criteria
First proposed approach
MMRE BMMRE PRED(25%)
One Analogy 18.23% 22.4% 72%
MMRE BMMRE PRED(25%)
One Analogy 20.3% 26.6% 72%
MMRE BMMRE PRED(25%)
One Analogy 59.4% 62.2% 44.4%
MMRE BMMRE PRED(25%)
One Analogy 59.4% 62.2% 44.4%
Mean of two analogies Mean of three analogies 16.06% 13.55% 17.7% 17.0% 78% 84% Second proposed approach Mean of two analogies Mean of three analogies 16.6% 16.8% 23.4% 22% 74% 74% Euclidean Distance Mean of two analogies Mean of three analogies 62.8% 65.6% 60.1% 64.7% 44.6% 45.4% Weighted Euclidean Distance Mean of two analogies Mean of three analogies 55.2% 56.7% 59% 59.3% 47.9% 50.2%
7
Conclusions
In this paper we introduced new approaches to measure similarity between two software projects based on fuzzy C-means and fuzzy logic. The approaches have been validated to their appropriateness for software projects. Both approaches do respect the main properties for similarity measures between two software projects. The first approach showed better MMRE results in terms of one analogy (closest project) than second approach. In general the results obtained showed that there is no significant difference between two proposed approaches and they contribute to better effort estimation accuracy than using conventional distance measures. As discussed in the introduction, most geometrical distance based techniques applied to software cost estimation suffer from irrelevant features and dealing with categorical variables. The methods hereby proposed overcome these disadvantages by: 1. handling categorical in the same way numerical attributes are handled where they are represented by fuzzy sets. 2. using Fuzzy C-means has the advantage to group close projects together in the same cluster and then represent them in the same fuzzy set. 3. using Fuzzy logic has also advantage in dealing with uncertainty rather than single values. However, the limitations of solution proposed this paper are: first, when two different projects feature values fall in the fuzzy set and is given unity similarity degree as similarity between a project to itself, therefore the similarity should be based on composition of values of project intersects each fuzzy set. Second, our approach is restricted to Gaussian membership function. Third, the project must be defined by more than one feature. Lastly, the fuzzy set must satisfy normal conditions. There are sometimes factors affecting similarity measure such as using irrelevant features which has significant impact on similarity measurement, thus, decreasing estimation accuracy. The solution is to use either weight setting for each feature or remove irrelevant features. Weigh setting is difficult to determine and it is hard to be defined by expertise. The validation of using weight setting in our approaches will be for future improvement. We are therefore continuing to extend our approach by addressing the limitation and restrictions mentioned earlier. Acknowledgments. We would like to thank ISBSG Repository for granting us permission to utilize their datasets in this research.
References 1. Bezdek, J.C.: Pattern Recognition with Fuzzy Objective Function Algorithms, Kluwer Academic Publishers, Norwell, MA, New York (1981)
2. Dvir, G., Langholz, G., Schneider, M.: Matching attributes in a fuzzy case based reasoning. In: 18th International Conference of the North American on Fuzzy Information Processing Society, NAFIPS., pp.33–36, New York (1999) 3. Emam, K.E., Benlarbi, S., Goel N., Rai, S.: Comparing case-based reasoning classifiers for predicting high risk software components. J. Systems and software 55, 301-320 (2001) 4. Esteva, F., Garcia-Calves, P., Godo, L.: Fuzzy Similarity-based models in Case-based Reasoning. In: Proceedings of the 2002 IEEE International Conference on Fuzzy systems, pp.1348-1353, Honolulu, USA (2002) 5. Fenton, N., pfleeger, S.L.: Software metrics: A rigorous and practical approach, International Computer, Thomson Press (1997) 6. Huang, S.J., Chiu, N.H.: optimization of analogy weights by genetic algorithm for software effort estimation. J. Information and software technology (Elsevier) 48 , 1034-1045 (2006) 7. Idri, A., Abran, A: A fuzzy logic based set of measures for software project similarity: validation and possible improvements. In: Seventh International Software Metrics Symposium, pp. 85-96, London (2001) 8. Jeffery, R., Ruhe, M., Wieczorek, I.: A comparative study of two software development cost modeling techniques using multi-organizational and company-specific data. J. Information and software technology 42, 1009-1016 (2000) 9. Krishnapuram, R., Frogui, H., Nasraoui. O.: Fuzzy and Possibilistic Shell Clustering Algorithms and Their Application to Boundary Detection and Surface Approximation – Part 1&2 , J. IEEE Trans. Fuzzy Systems 3, 29-61 (1995) 10. Martin, C. L., Pasquier, J. L., Yanez, C M., Gutierrez, A. T.: Software Development Effort Estimation Using Fuzzy Logic: A Case Study. In: Sixth Mexican International Conference on Computer Science, pp.113-120, Mexico (2005) 11. Mendes, E., Mosley, N., Counsell, S.: A replicated assessment of the use of adaptation rules to improve Web cost estimation. In: International Symposium on Empirical Software Engineering, pp. 100-109, (2003) 12. Mendes, E., Mosley, N., Counsell, S.: Do adaptation rules improve web cost estimation?. In: fourteenth ACM conference on Hypertext and hypermedia. pp. 173-183, Nottingham (2003) 13. Michalewics, Z., Fogel. D. B.: How to solve it: Modern Heuristics. Springer, New York (2002) 14. Musflek, P., Pedrycz, W., Succi, G., Reformat, M.: Software Cost Estimation with Fuzzy Models. J. ACM SIGAPP Applied Computing Review 8, 24-29 (2000) 15. Ross, T.J.: Fuzzy Logic with engineering applications, John Wiley& Sons (2004) 16. Shepperd M., Schofield C.: Estimating software project effort using analogy. J. IEEE Trans. On software engineering 23, 736-743 (1997) 17. Shepperd M., Schofield C., Kitchenham B.: Effort estimation using analogy. In: 18th International Conference on Software Engineering. pp. 170-178, Berlin (1996) 18. Sentas, P., Angelis, L.: Categorical missing data imputation for software cost estimation by multinomial logistic regression. J. Systems and Software 79, 4040-414 (2006) 19. Stamelos, I., Angelis, L., Morisio, M.: Estimating the development cost of custom software. J. Information and management (Elsevier) 40. 729-741 (2003) 20. Xie, X.L. , Beni, G.: A Validity Measure for Fuzzy Clustering. J. IEEE Transaction on pattern analysis and machine intelligence 13, 841-847 (1991) 21. Xu, Z., Khoshgoftaar, T.: Identification of fuzzy models of software cost estimation. J. Fuzzy Sets and Systems 145, 141-163 (2004) 22. Zadeh, L: Toward a theory of fuzzy information granulation and its centrality in human reasoning and fuzzy logic. J. Fuzzy sets and Systems 90, 111-127 (1997)