Keywords: Software Engineering, Program Verification; Metrics. 1. ... sophisticated CASE tool, there will always be a way to evaluate its quality by weighting user.
Published at: “Software Quality and Productivity: Theory, practice, education and training”, ISBN 0-412629607, Chapman and Hall, 1995, pp. 266-272.
M. Xenos and D. Christodoulakis, “Software Quality: The user's point of view”
Software Quality: The user's point of view M. Xenos and D. Christodoulakis Computer Technology Institute, 3 Kolokotroni Str., Patras 26221, GREECE
SUMMARY In this paper is presented a methodological approach for the measurement and the evaluation of users' opinion for a software product. The methodology is general and applicable for every product and, as a concept, in every situation. The basic principle for the methodology is that each user's opinion should be evaluated in analogy to this user's qualifications in respect to computers in general, to this particular product and to the application automated by this. Therefore, the measurement and the analysis of the users' qualifications is performed before users are asked for their opinion about the product. Afterwards, the users will be asked their opinion about the product. This opinion counts equally to their pre-measured qualifications. In addition, in this paper are presented some techniques about how to set-up customized questionnaires, about how to collect and analyze the measurements and about how to overcome human aspects related to human disapproval, or even refusal to measurements. Keyword Codes: D.2.4; D.2.8 Keywords: Software Engineering, Program Verification; Metrics
1. INTRODUCTION Currently programming techniques differ greatly from those of a few years ago. The broad use of object oriented programming languages, visual programming tools and computer aided software engineering (CASE) tools, have facilitated and accelerated programmers' work. Traditional quantities/metrics for measuring software quality -such as LOC, software science metrics[1], software complexity Metrics[2]- are not fully able to measure the particular characteristics, the programming effort, nor the quality of programs which have been created using new techniques. New metrics and models[3] designed especially for such programming techniques will eventually also become inadequate, as the programming languages, techniques and tools continue to evolve. What has remained unchanged in
1
Published at: “Software Quality and Productivity: Theory, practice, education and training”, ISBN 0-412629607, Chapman and Hall, 1995, pp. 266-272.
M. Xenos and D. Christodoulakis, “Software Quality: The user's point of view”
software engineering throughout the years, regardless of programming styles, languages and techniques, is that there will always be one or more users who will work using the product. From a software product written in machine code to a product developed under a sophisticated CASE tool, there will always be a way to evaluate its quality by weighting user critique. This paper presents a methodology for the evaluation of software quality, based on the critique provided from possible, or actual users of this product. The methodology is not "stand-alone" on measuring and improving the quality of the software product. It must be used within an overall and systematic approach[4] to ensure software quality with the aid of measurements. The main principle, that is presented in section 2, is to be able to estimate each user's ability to evaluate the product, based on user expertise as far as syntactic and semantic knowledge within the field and the overall user qualifications. Consequently, the more qualified the user is, the more value will be given to his critique. Some guidelines are provided in section 3, in order to set up such a user evaluation method. Some instructions are also provided in section 4, about the questionnaires related to the product itself. Additionally, techniques and guidelines are proposed in order to select a statistical sample, to set up questionnaires for measuring users' ability to serve as "software evaluators", to measure the results of their evaluation, to identify the "experts" (those users whose opinion must weight the most), and finally (in section 5), to analyze and interpret the answers to these questionnaires.
2. THE BASIC PRINCIPLES OF THE PROPOSED METHODOLOGY The fundamental principle for this methodology is to value each user's critique according to the user's overall qualifications in the field. To the opinion of each user will be given as much value as qualified in the field the user is. Therefore, the result of the measurements of the user's critique is not the average (Avg.) that is shown by the equation 1: i= n
Avg =
∑O
i
i =1
n
where Oi ∈ 0,100 , is the opinion of the user i for the program that is measured , but the average (Avg.) that is shown by the following equation 2: i =n
Avg =
∑ (O ⋅ E ) i
i =1
i
i =n
∑E i =1
i
where E i ∈(0,1) is the measurement of the user's i qualifications. Using the above equation, the opinions of users with different qualifications within the field of application are contributed in the overall software evaluation, in analogy to their qualifications. In fact the equation 2 is also not complete. It does not include terms like how tired the user was, when measurements took place, how seriously the measurements were contacted,
2
Published at: “Software Quality and Productivity: Theory, practice, education and training”, ISBN 0-412629607, Chapman and Hall, 1995, pp. 266-272.
M. Xenos and D. Christodoulakis, “Software Quality: The user's point of view”
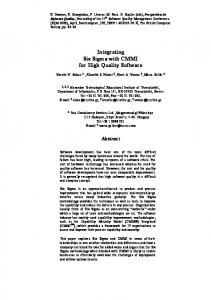
how well the user was feeling that day, etc. Such unpredictable factors are included in the following equation 3: Avg = F (Oi , E i , X 1i , ! , Xk i , n) where X 1i , ! , Xk i represents these factors. The authors opinion is that this equation is solvable, but since all of its elements are very difficult to be measured, in this paper the analysis will focus on the equation 2. Solving equation 2 is an important step toward the solution of the complete equation 3. In the next two sections the method both O i and E i are measured is presented. 3. EVALUATING THE USER As shown in figure 1 the user is considered to have three different parts of knowledge related to the subject that is measured. These figure 1 three parts are the personal background, the syntactic knowledge about the product and the semantic knowledge about the application[5]. Semantic 40% These three parts are not consider to contribute Personal equally to form the user's profile. The personal 20% background contributes the half of the other equally contributing parts. Therefore the 20% is Syntactic 40% assigned for the user's personal background and the 40% for both the user's syntactic and semantic knowledge. These three parts are further analyzed below. The personal background: All the user's attributes which are not related to the product or the application are collected in this name. Such attributes are, the user's age, his general education, his culture, etc. The user's age has to do with his ability to adopt new technologies and working styles and be open minded in figure 2 changes. His education helps him to be able to express serious critique, and the nearer to the subject of his studies is the 10 10 8 8 subject of the product, the more objective 7 6 6 he will be. 4 2 1 0 0
3
The syntactic knowledge: Syntactic knowledge is the knowledge of the Years of experience existing computer applications, and the familiarization with the use of computers in general. The more similar to the measured application those applications are, the better for the user. 0,5
1
2
5
10
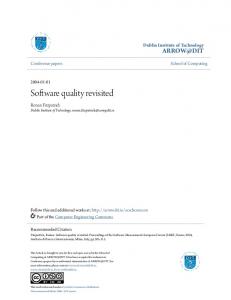
The years of experience are also a subject for measurement. As illustrated in figure 2, a user is considered to gain experience faster in the very first years when working with a program and slowly after these years. The key point here, is to understand that the subject for
3
Published at: “Software Quality and Productivity: Theory, practice, education and training”, ISBN 0-412629607, Chapman and Hall, 1995, pp. 266-272.
M. Xenos and D. Christodoulakis, “Software Quality: The user's point of view”
measurements is not the user's ability to operate a program, but his ability to provide critique for a similar program. This ability is considered to be equal to 3 out of 10 after half a year of experience and 6 out of 10 in the first whole year. The user gradually reaches 10, after ten years of experience. No user is consider to gain any further experience after working more than 10 years on the same program. The aim of the questions on the users syntactic knowledge is to evaluate the user's interaction with the program, the use of similar systems, the general use of computer systems and of course the years of experience for each one of the above. The semantic knowledge: The extreme majority of computer programs are not constructed to offer something new, but to automate an pre-existing activity. In most of the cases, new programs are build to offer an new automation, replacing an existing product. This activity (automated or not) is known by many users with different expertise levels. The semantic knowledge defines how well a user knows this activity -meaning how well a user understands the semantics of the under automation problem. Measuring semantic experience, the years of experience are also important and the diagram in figure 2 applies the same.
4. MEASURING USER'S CRITIQUE The need to measure user's critique was firstly described as a concept by Boehm et al.[6] and McCall et al.[7]. The McCall's quality model has been the basis for the ISO Metrics standard[8]. This standard reduces the complexity of the McCall's model by using the following six quality attributes: Functionality, Reliability, Usability, Efficiency, Maintainability, and Portability. In order to be in compliance with the ISO Standards this methodology embodies all the six quality characteristics of the ISO9126, and two more from the first 11 quality attributes from McCall's model (Simplicity and Expandability). Therefore the proposed set of attributes is the following eight quality characteristics: • • • • • • • •
Functionality, Simplicity, Reliability, Usability, Efficiency, Maintainability, Expandability and Portability.
These attributes were found sufficient in order to describe all the aspects of the user's critique about the measured product. Additionally, these attributes could be decomposed to lower-level attributes (according to McCall's model), and finally into direct questions to the user. The five proposed rated levels for the products are the following: poor, • average, •
4
Published at: “Software Quality and Productivity: Theory, practice, education and training”, ISBN 0-412629607, Chapman and Hall, 1995, pp. 266-272.
M. Xenos and D. Christodoulakis, “Software Quality: The user's point of view” • • •
good, excellent, and optimum.
The scoring system is also simple. A 20% of the overall score of the question is assigned for the selection of "poor", 40% for the "average", 60% for the "good", 80% for the "excellent", and 100% for the "optimum". Using this approach, the lower level of user satisfaction which could be measured, is 20% of the expected product and the best level is, naturally, 100%. An example of how the functionality could be measured, is the following question: "How does the product perform user's functions?" with the available choices: The product does not provide the required functions. The product provides the required functions, except some limitations. These limitations may be overcame by using manual procedures. The product provides the required functions, except minor limitations, Good that may be ignored. Excellent The product provides all required functions, except a few minor limitations. These limitations may also be overcame by using other automated functions. Optimum The product performs all user's requirements without any limitation at all. Poor Average
This methodology suggests that the user must be given only multiple choice sheets with the question and the choices (Poor, Average, Good, Excellent, Optimum) and to be guided by an expert analyst, in order to mark the suitable answer. Further explanation about why this is suggested, is provided in the following section. The scoring system of the questionnaires, measuring the users' opinion for a product, is very simple. An equal amount of contribution is given to each of the eight quality attributes: 12.5% for each attribute. The participation of each question in the overall 12.5% of the attribute is related with the measured application and is to be defined by the expert analyst. For example, in a telematics application the availability characteristic is highly the most important characteristic of the reliability attribute. For an non telematics application this characteristic might not be considered important. 5. COLLECTING AND ANALYZING THE MEASUREMENTS The collection of the answers to the measurements is a vivid aspect of the methodology. Human aspects related with the tendency not to take seriously these measurements, or to exaggerate about their abilities, may affect the reality of measurements. The kind of answers which are required is equally important. Multiple choice sheets have been used in our experiments and our suggestion is to follow this example. It's easy to analyze the multiple choice answers, the collection of answers may be automated and the users are guided to choose a preset answer. The problem of multiple choice sheets is that the user may not find a suitable answer, or may not understand which answer is the one that suits better. In order to solve this, in our first examples the users were provided plenty of comments, explaining each
5
Published at: “Software Quality and Productivity: Theory, practice, education and training”, ISBN 0-412629607, Chapman and Hall, 1995, pp. 266-272.
M. Xenos and D. Christodoulakis, “Software Quality: The user's point of view”
question and guide them to the right selection. The experiments shown that in the most cases the users tend to ignore long comment lines and as a result they tend to chose carelessly. It has been found that the best solution is to provide plain questionnaires without any comments, but not just give them to the users to mark them. An expert is the one who must ask the questions to the users, must advise them about the best category that fits to them, and must mark the answers for them. Using this approach, the user's tendency to exaggerate about their abilities is limited, due to the expert's present. The size of the questionnaires is important too. In the early experiments, when the questionnaires were just given to the users, has been measured a big tendency to mark carelessly the last answers of the questionnaires. This tendency grows when the size of the questionnaires becomes bigger. Humans do not like filling questionnaires, especially when the questions have to do with their abilities. Therefore they never take this task seriously. Furthermore the bigger the questionnaire is, the more careless they tend to be, when they choose their answers. Our suggestions are that the questionnaires must be small. It would be better to divide a questionnaire into three parts and to repeat the measurements three times. The methodology that analyze the measurements is graphically illustrated in figure 3. The selection of the statistical sample, (how many users will be asked to fill in the questionnaires Q1,...,Qm and how these users will be Q1 Q2 Qm selected), is not the subject of this paper. There is a well defined theory of how to perform a statistical analysis. From the set of m questionnaires the analysts extract the Ei and the Oi (the user evaluation and the user Ei Oi opinion). Analyzing this result, the Avg of the equation 2 is extracted. In addition the analysis EUS of a users' subset, EUS, consisted only from the "expert users", results in the expert users' Analysis opinion. This opinion, EUA, is of a great Expert Users importance and significantly more important Analysis from the result of equation 1. In the next paragraphs two techniques are proposed in order to identify the "experts" . EUA
Avg
The first technique is the one that is chosen in our experiments. According to this technique, the analysts set a minimum standard for the expert user, select a statistical sample, collect the answers to questionnaires and finally, identify the users who exceed this minimum standard as experts. Using this technique, the analysts have the opportunity to work besides the limits of the statistical sample, by heuristically selecting "candidate expert users". Those users are persons who the analysts believe that there is a great possibility to exceed the minimum expert level. Figure 3
The second technique is more simple than the first one, but it might fail to identify the real expert users. According to this technique, the analysts after the collection of the answers to the questionnaires, consider the upper 5% of the users as experts. This technique requires a
6
Published at: “Software Quality and Productivity: Theory, practice, education and training”, ISBN 0-412629607, Chapman and Hall, 1995, pp. 266-272.
M. Xenos and D. Christodoulakis, “Software Quality: The user's point of view”
homogenous statistical sample, so as there will be within an actual 5% of expert users. The choice of 5% as the limit for the expert user selection, is based on our experimentally measurements, but in other environments might be different. In other situations a different users' percentage might be chosen as experts, according to the user profile analysis performed before the measurements. In order to estimate this percentage, pre-analysis like the first technique must be carried out before the measurements.
6. OPEN PROBLEMS AND FURTHER RESEARCH The methodology that is presented in this paper, is not complete so as to measure the quality of a software product. It must be used in parallel with other software metrics and under an overall rigorous quality assurance approach for optimum software engineering. Though this methodology will be valuable throughout time because it is not depended on programming languages, techniques and tools, but it evaluates the product itself. The aim of this paper, was not to provide same sample questionnaires, that an analysts will take them as they are and apply them, but to provide a way of analyzing user's opinions. This approach is formed under a methodology that is applicable as a concept in all cases. Though, the analysts must operate within the scope of this methodology and define their own suitable questionnaires. The answer to the question "How to measure users' critique?" is a methodological and rigorous collection and analysis of measurements by using customized, dynamically changed, and always suitable questionnaires. Solving equation 3 is an open problem. Our estimation based on our current research reveals that the result of the measurements of the "expert users opinion" might be the best approximation to this equation's solution. This measurement might be better than both the results of equations 1 and 2. Proving this estimation is also a future goal.
REFERENCES [1]
HALSTEAD, M.: 'Elements of Software Science', (McGraw-Hill, 1968)
[2] McCABE, T.: 'A Complexity Measure', IEEE Transactions on Software Engineering, 1976, SE-2, (4), pp 156-167. [3] XENOS, M. and TSALIDIS C. and CHRISTODOULAKIS D.: 'Measuring software complexity using software metrics', 3rd European Conference on Software Quality Proc., Madrit Spain, 1992, pp 167-178. [4]
FENTON, N.: 'Software Metrics - A rigorous approach', (Chapman & Hall, 1991)
7
Published at: “Software Quality and Productivity: Theory, practice, education and training”, ISBN 0-412629607, Chapman and Hall, 1995, pp. 266-272.
M. Xenos and D. Christodoulakis, “Software Quality: The user's point of view”
[5] PRESSMAN, R.: 'Software Engineering - A practitioners approach', pp 457-480, (McGraw-Hill, 1992) [6] BOEHM, B.: 'Software Engineering Economics', IEEE Transactions on Software Engineering, 1978, SE-10, (1), pp 37-46. [7] McCALL, J. and RICHARDS P. and WALTERS G.: 'Factors in software quality', US Rome Air Development Centre Reports, 1977. [8]
ISO9126: ISO/DP 9126.: 'Software Quality Characteristics', (ISO9126, 1987)
8