Microb Ecol (2008) 56:153–167 DOI 10.1007/s00248-007-9333-z
ORIGINAL ARTICLE
Soil Microbial Responses to Temporal Variations of Moisture and Temperature in a Chihuahuan Desert Grassland Colin Bell & Nancy McIntyre & Stephen Cox & David Tissue & John Zak
Received: 5 July 2007 / Accepted: 2 October 2007 / Published online: 2 February 2008 # Springer Science + Business Media, LLC 2007
Abstract Global climate change models indicate that storm magnitudes will increase in many areas throughout southwest North America, which could result in up to a 25% increase in seasonal precipitation in the Big Bend region of the Chihuahuan Desert over the next 50 years. Seasonal precipitation is a key limiting factor regulating primary productivity, soil microbial activity, and ecosystem dynamics in arid and semiarid regions. As decomposers, soil microbial communities mediate critical ecosystem processes that ultimately affect the success of all trophic levels, and the activity of these microbial communities is primarily regulated by moisture availability. This research is focused on elucidating soil microbial responses to seasonal and yearly changes in soil moisture, temperature, and selected soil nutrient and edaphic properties in a Sotol Grassland in the Chihuahuan Desert at Big Bend National Park. Soil samples were collected over a 3-year period in March and September (2004–2006) at 0–15 cm soil depth from 12 3 × 3 m community plots. Bacterial and fungal carbon usage (quantified using Biolog 96-well micro-plates) was related to soil moisture patterns (ranging between 3.0 and 14%). In addition to soil moisture, the seasonal and yearly variability of soil bacterial activity was most closely associated with levels of soil organic matter, extractable NH4–N, and soil pH. Variability in fungal activity was related to soil temperatures ranging between 13 and 26 °C. These findings C. Bell (*) : N. McIntyre : S. Cox : D. Tissue : J. Zak Department of Biological Sciences, Texas Tech University, Lubbock, TX, USA e-mail:
[email protected] D. Tissue Centre for Plant and Food Science, University of Western Sydney, Richmond, NSW, Australia
indicate that changes in soil moisture, coupled with soil temperatures and resource availability, drive the functioning of soil-microbial dynamics in these desert grasslands. Temporal patterns in microbial activity may reflect the differences in the ability of bacteria and fungi to respond to seasonal patterns of moisture and temperature. Bacteria were more able to respond to moisture pulses regardless of temperature, while fungi only responded to moisture pulses during cooler seasons with the exception of substantial increased magnitudes in precipitation occurring during warmer months. Changes in the timing and magnitude of precipitation will alter the proportional contribution of bacteria and fungi to decomposition and nitrogen mineralization in this desert grassland.
Introduction Precipitation pulse sizes and corresponding soil moisture in arid ecosystems are discrete and highly variable events [1]. These discontinuous moisture pulses provide a window of opportunity for soil microbes, triggering mineralization for brief periods, and consequently releasing nitrogen and other minerals into the upper soil horizons [2–4]. However, primary producers in arid systems rarely benefit from brief moisture pulses, as plant growth is dependent not only on soil microbial activity, but also on other factors including the duration of the precipitation event, amount of soil water infiltration and subsequent soil moisture levels, and plant functional types [5, 6]. Consequently, short-term increases in soil microbial activity triggered by moisture pulses in arid systems will not typically correspond to subsequent increases in primary production on the same time scale. As decomposition and consequent mineralization can be stimulated by moisture pulses that are too brief to benefit primary producers [2, 7, 8], there is potential for soil
154
nutrient pools to accumulate over time in desert soils and then become available to plants as heavier precipitation events occur. In addition, any accumulation of soil nutrients as a consequence of mineralization pulses caused by brief soil moisture pulses may subsequently influence microbial functional dynamics and consequently alter soil microbial community diversity. Increased root and soil microbial respiration rates in response to isolated moisture pulses has been shown to occur in the Sonoran Desert at both Saguaro National Park and the Santa Rita experimental range outside Tucson, AZ, and in the northern Chihuahuan Desert at the Sevilleta National Wildlife Refuge in central New Mexico [9–11]. However, current understanding is incomplete as to how belowground microfloral dynamics in deserts functionally respond to environmental variation over a several-year period and how environmental variation might influence soil microbial biodiversity across arid landscapes [12–15]. Even less is known about how changes in soil microbial biodiversity will influence processes such as decomposition and mineralization rates in arid systems, and how ecosystem function will subsequently be affected as climate change results in altered precipitation patterns [15–20]. These questions are important to answer because available soil moisture is predicted to become increasingly variable in arid systems as a consequence of global climate change. Moreover, changes in plant productivity, root growth, and exudation patterns as a consequence of climate modifications are likely to significantly influence microbial diversity and activity [21–23]. These impacts will most likely occur through changes in soil organic matter levels, decomposition, and mineralization rates [24–29]. Thus, by evaluating microbial functional responses to current environmental patterns, potential impacts of climate change on soil microbial function can be addressed. Assessment of carbon utilization patterns of soil microbial communities, as affected by soil moisture or temperature patterns, can provide some insights into microbial functional responses to environmental changes in arid regions. The Biolog procedure was introduced initially to identify bacterial functional differences between soil and water samples [30]. Zak et al. [31] used this procedure to measure soil bacterial functional diversity along a moisture gradient in the Chihuahuan Desert at the Jornada LongTerm Ecological Research site and reported considerable variation in the ability of bacterial communities to utilize different carbon substrates along the gradient. Zak et al. [32] later used this approach to examine bacterial carbon use along an extensive elevation gradient in the Chihuahuan Desert at Big Bend National Park. Using similar methodology, the FungiLog approach was then developed [33, 34] to determine saprophytic fungal functional diversity associated with decomposed plant material and soil. Although the
C. Bell et al.
Biolog method is limited, as results cannot reflect accurately the carbon use potential of the bacterial community as a whole, the capacity of this approach for estimating microbial response patterns to various treatments, disturbance, or environmental conditions has been recognized [35, 36]. Employing these two methods, potential carbon usage of both saprophytic fungi and soil bacteria in response to temporal patterns of moisture and temperature in arid systems can be ascertained. Linking bacterial and saprophytic fungal carbon use to changes in soil moisture patterns, nitrogen availability, or soil temperature will be crucial for understanding consequences of changes in precipitation patterns on soil microbial dynamics in arid landscapes. The objective of this research was to determine patterns of soil microbial and soil nutrient dynamics in a Chihuahuan Desert grassland at Big Bend National Park in response to temporal differences in environmental conditions with the goal of providing insight as to how global climate change predictions for this region will subsequently influence soil microbial activity and function and ultimately ecosystem process.
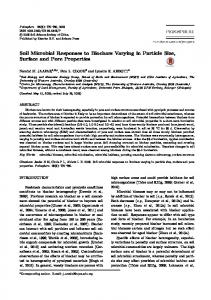
Materials and Methods Site Description This research was conducted in a Sotol Grassland site in the Pine Canyon Watershed [32], located in Big Bend National Park (BBNP), Texas. BBNP is located in the central region of the Chihuahuan Desert and is characteristic of the Chihuahuan Desert because of its many mountain ranges and diverse plant communities [37, 38]. Like the Chihuahuan Desert (taken as a whole), BBNP receives the majority of its rainfall in the summer months from moisture brought in by southeasterly winds blowing over from the Gulf of Mexico, with the least amount of precipitation occurring during winter months [39, 40]. Precipitation data collected at Big Bend’s Panther Junction Visitor Center over the past 19 years shows the average winter rainfall (December–February) to be 55.9 mm, whereas the average summer rainfall (June– August) is 163.3 mm. The average total annual rainfall for BBNP over the past 19 years is 364 mm. Average daily air temperatures in BBNP range from ~10 °C in the winter months to ~32 °C in the summer (Fig. 1). The research site for this study is located in the Sotol Grasslands in the Pine Canyon Watershed, which is situated on the northeast side of the Chisos Mountains (centrally located in BBNP). This desert grassland site is higher in elevation (1500–1678 m) than other components of the Chihuahuan Desert; consequently, climate is slightly wetter and cooler than for lower elevation grasslands in
Soil Microbial Responses to Moisture and Temperature
60
Monthly Precipitation (mm )
Fig. 1 Average monthly precipitation (mm) for Panther Junction Visitor Center (elevation 1143 m) in Big Bend National Park (located in the Chihuahuan Desert) over the past 19 years (a) and daily maximum and minimum air temperatures (recorded at 1 m height) at the Sotol Grassland site in Pine Canyon (elevation 1550 m) in Bend N. P. (b). Temperatures were recorded every 36 min
155
a
19 yr average
55 50 45 40 35 30 25 20 15 10 5 0
Jan Feb Mar Apr May Jun Jul Aug Sep Oct Nov Dec
40
b
AIR_MAX AIR_MIN
Temp (
o
C)
30
20
10
0
the Chihuahuan Desert. Dominant plants include sotol (Dasylirion leiophyllium), several species of prickly pear (Opuntia phaeacantha, Opuntia engelmannii, Opuntia violacea, and Opuntia rufida) and grama grasses (Bouteloua capitola, Bouteloua curtipendula, and Bouteloua hirsute). In general, desert grasslands are characterized as having the lowest biomass levels of any North American grassland type [41]. The Pine Canyon Sotol Grassland is located in a caldera (latitude: 29°5.86″ N; longitude: 103°14′13.54″ W), and the magma produced from the area is the major source forming the surrounding Chisos Mountains [42]. Soils in Pine Canyon typically have an extremely rock-strewn A-horizon with little to no litter layer that immediately overlays a fractured igneous bedrock foundation. This soil is described
Oct 06
June 06
Feb 06
Oct 05
June 05
Feb 05
Oct 04
June 04
Jan 04
-10
as Lajitas-rock outcrop complex by USDA soil surveys [43, 44]. The soil texture throughout this site has been determined to be a sandy–loam (62% sand, 30% silt, 8% clay) by Waters Agricultural Laboratories, Inc. (Owensboro, KY). Experimental Design We established 12 3×3 m community plots to study longterm soil microbial and plant responses to seasonal patterns in precipitation. These community plots were constructed to uniformly encompass the three dominant plant species of the Sotol Grasslands in Pine Canyon (sotol, prickly pear, and grama grasses). Twenty-four soil samples (two per plot) were collected biannually in March and September for three consecutive years starting in 2004. These months were
156
chosen to represent the ends of the winter and summer seasons at BBNP, which are the two seasons predicted to experience the greatest shift in precipitation patterns due to global climate change in this region [45, 46]. Soil was collected from 0 to 15 cm depths and stored at 4 °C until use. All soils were analyzed within 2 weeks of collection. Assessing the Potential Carbon Usage of Soil Microbes Microbial functional responses to environmental conditions were assessed by analyzing potential carbon usage for both bacteria and fungi. To quantify bacterial responses, soil samples were diluted to 10−4 and inoculated into Biolog GN2 96-well microtiter plates containing 95 different carbon substrates following the Biolog method [30, 31, 36, 47]. Fungal functional responses were assessed by inoculating Biolog SFN2 96-well microtiter plates containing 95 different carbon substrates with a 20 ml inoculation mixture containing 50 mg SOM particles (ranging between 250 and 500 μm) following Soil Fungilog procedures. Soil organic matter particles were separated from the mineral soil fraction using the procedure as outlined by Sobek and Zak [34]. Functional responses for bacteria and fungi were quantified for total substrate activity and substrate richness after 72- and 120-h incubation periods. The 72- and 120-h incubation periods were chosen to allow for the most complete expression of microbial carbon use potential at the time of sampling [31, 34, 48]. Substrate activity refers to the sum of combined ability to utilize the different carbon substrates, whereas substrate richness refers to the number of wells (95 total wells) that have any level of carbon-use activity. Nitrogen Dynamics Exchangeable soil ammonium (NH4–N) was determined via colorimetric assay and was extracted one day after the sample collection date using a 50-ml 2-M KCl solution from a 5-g field moist (oven dry equivalent) soil sample [49]. Levels of extractable NO3–N were determined 1 day after the sample collection date by A&L Soil Laboratories (Lubbock, TX, USA) using ion-specific probes. Potential Nitrogen Mineralization Soil incubations were employed to evaluate seasonal changes in potential nitrogen mineralization patterns as described by Robertson et al. [27]. Ninety-six 250 mL soil chambers were incubated after each sampling period beginning in 2006. Forty-eight chambers were used to incubate soil for 40 days, with the second set of 48 chambers incubated over 80 days. Soils throughout all incubation periods were kept at (24 °C). Initial watering application increased soil moisture to near saturation (~20% soil moisture). Soils slowly dried over the
C. Bell et al.
incubation intervals, and at the end of each incubation period, percent soil moisture was determined along with extractable soil NO3–N and NH4–N to assess net nitrogen mineralization rates, net nitrification rates, and relative percent nitrification [27]. Measurements of extractable NO3–N and NH4–N occurred as described above. Carbon to nitrogen ratios of initial, 40- and 80-day incubations were analyzed using a CE Elantech CHN analyzer (NCS 2500, Carlo Erba, Inc. Milan Italy) for samples collected in March and September 2006. SOM Soil organic matter (SOM) was estimated via loss-onignition method [50]. Soils were air-dried for 24 h, then placed in aluminum pans and oven-dried for an additional 24 h in a 60 °C drying oven. After drying for 24 h, approximately 10 g of soil was placed in a weighed porcelain crucible and then incinerated at 450 °C for 24 h. After incineration, samples were removed from the furnace and reweighed to determine ash weight remaining. Microbial Biomass Carbon Estimations of microbial biomass carbon (MBC) was accomplished using the chloroform fumigation and extraction method [51], in which two replicates from each soil sample were fumigated for 48 h, while another set of two replicates from each soil sample were not fumigated. Soil MBC was extracted using a 0.5-M K2SO4 solution from 5 g field moist (dry weight equivalent) soil sample and filtered using Fisherbrand-P2 fine-porosity filter paper. Extracted soil MBC was measured spectrophotometrically at 280 nm, and the difference between the extracted C in the fumigated and non-fumigated soils represents the microbial biomass C [52]. Environmental Parameters: Soil pH, Soil Moisture, and Air and Soil Temperatures Soil pH was measured using a 2:1 paste extract [27]. Percent soil water content was measured at each sampling time by drying soils in a drying oven (60 °C for 48 h) [53]. Soil (15 cm depth) and air temperatures (1.0 m above soil surface) were collected using Onset Computer Corporation HOBO-H8 Pro Series data loggers at 36-min intervals [54]. For every sample period, average soil and air temperatures were calculated for 4 weeks before sampling occurred to represent environmental conditions critical for microbial response. Statistical Analysis The statistical approach used to assess significant differences in all observed parameters collected over the 3-year
Soil Microbial Responses to Moisture and Temperature
157
Table 1 Pearson correlation matrix among environmental parameters measured in the Sotol Grasslands in Big Bend National Park Independent variables
sm%
som
pH
sm% som pH NO3–N NH4–N Soil temp Air temp
1.000 0.018 −0.050 0.179 0.217 0.373 0.385
1.000 −0.037 −0.208 0.057 −0.224 −0.198
1.000 0.121 −0.102 0.053 0.071
NO3–N
NH4–N
Soil temp
Air temp
1.000 0.089 0.543 0.557
1.000 −0.004 0.011
1.000 0.988
1.000
sm%=soil moisture %, som=soil organic matter Pearson correlation matrix indicates correlated variables used in multiple regression analysis for microbial and in situ nitrogen responses to soil properties and soil and air temperatures. Values in this matrix can range from −1.0 to 1.0, with 1.0 indicating perfectly correlated variables and −1.0 indicating perfectly negative correlations. Soil and air temperatures were the only environmental variables that were highly correlated. Significant correlations (P≤0.05) are indicated in bold. The sample size for each variable used for multiple regression analysis of microbial responses and in situ (initial) soil nutrient responses with the environmental variables listed above is N=144
period (soil pH, soil organic matter percentage, microbial biomass, available soil NH4–N and NO3–N, in vitro mineralized soil NH4–N and NO3–N, soil C:N, net nitrification, net mineralization, relative percent nitrification, and potential carbon usage for both bacterial and fungal communities) was repeated-measures analysis of variance (rmANOVA) using the consecutive sample dates as the within subject variable using the statistical software package SPSS 14.0 (Chicago, Il, USA). To determine microbial and soil nutrient responses to environmental conditions, stepwise multiple regression analysis was performed (SPSS 14.0, Chicago, Il, USA; [55]). The stepwise method was chosen because this technique provides, as the first step, a single-variable model that accounts for the most variation and then calculates successively more complex models. This approach allows for an examination of the relative contributions of each variable to the most parsimonious descriptive model. Biolog, Fungilog, and available soil NH4–N and NO3–N data was modeled as a function of environmental parameters to assess microbial response and available nutrient relationships to environmental and edaphic variables (Table 1). Levels of extractable NO3–N and NH4–N from in vitro incubations were modeled as a function of percent soil moisture and the inorganic nitrogen counterpart recorded at the end of the incubations using multiple regression analysis to detect any relationships between soil nitrogen levels and soil moisture (Table 2). Every R2 statistic reported in this experiment is from the final significant model (P≤0.01) provided by the stepwise process. The stepping-method criteria entered any variable with the probability of F≤0.005 and removed any variable from the model F>0.01. Pearson correlations (Tables 1 and 2) were examined to identify any highly correlated variables that might corrupt the models generated by the multiple regression analysis. Only two variables, soil and air temperature, were found to be highly correlated (R>0.80). Statistical analyses were conducted
with SPSS 14.0 (Chicago, Il, USA). The sample size for regression analysis for bacterial and fungal responses and initial (in situ) extractable soil nitrogen levels collected over the 3-year study (between 2004 and 2006) is 144. The sample size for regression analysis for in vitro nitrogen mineralization data collected from soil incubation methods was from March and September 2006 only; the sample size for these data is 192.
Results Environmental Parameters Over the 3-year period, average soil temperatures within each sample period closely matched average air temperatures during the same sampling period and were highly correlated throughout the study (R=0.98) (Fig. 2; Table 1). Soil and air temperatures in March were consistently lower than air and soil temperatures in September, with March temperature averages ranging from ~13–18 °C for soil Table 2 Pearson correlation matrix for soil parameters during in vitro N-mineralization Independent variables
NH4–N
sm%
NO3–N
NH4–N sm% NO3–N
1.000 −0.514 −0.678
1.000 0.577
1.000
sm%=soil moisture % Pearson correlation matrix indicates correlated variables used in multiple regression analysis for in vitro soil incubations. Values in this matrix can range from −1.0 to 1.0, with 1.0 indicating perfectly correlated variables and −1.0 indicating perfectly negative correlations. Significant correlations (P≤0.05) are indicated in bold. The sample size for each variable used for multiple regression analysis of in vitro soil-N mineralization responses with the variables listed above is N=192
158
C. Bell et al.
the last year of the study appeared slightly less acidic than the previous 2 years; however, only September 2004 displayed significantly higher acidity levels (P≤0.031) than the last year of sampling (Fig. 3a).
and ~13–16 °C for air. In September, temperature averages ranged ~24–26 °C for soil and ~23–26 °C for air. Monthly precipitation varied throughout the 3-year period, with 2004 receiving above average annual rainfall (567 mm), 2005 receiving average rainfall (329 mm), and 2006 receiving below average rainfall (273 mm; Fig. 2a). Soil moisture throughout the 3-year study was observed to be highly variable and contingent on the timing and magnitude of moisture, ranging between 3.0 and 12.0% (VWC). The first three sample periods (March 2004, September 2004, and March 2005) exhibited soil moisture values typical for these desert grasslands (6–8%; Fig. 2b). For the duration of the next two sampling periods (September 2005 through March 2006), this region experienced an extended drought; consequently, very low soil moisture levels (140 mm) received during the month before this sampling period (Fig. 2b).
SOM Soil organic matter content tended to increase in March and decrease in September. However, this pattern was only significant in the first year (P