POSTER PRESENTATION
Some Applications of VBD and QBD Tests J. T. C. Chen#, T. Dimitrova#, D. Dimitrov#, K. Park*, and D. K. Schroder* *
Four Dimensions, Inc. 3140 Diablo Ave., Hayward, CA 94545 510-782-3968; fax:510-786-9321; e-mail:
[email protected] *Dept. of Electrical Engineering Arizona State University Tempe, AZ 85287-5706. 480-965-6621; fax:480-965-8118; e-mail:
[email protected]
ABSTRACT Much work has been done and many papers have been published on gate oxide integrity. The work is largely concentrated on characterization, modeling of oxide degradation and breakdown under stress and measurement techniques. With such extended knowledge and techniques on oxide reliability available, we can make use of that for monitoring wafer quality and process equipment. Here we show that VBD measurements reflect different aspect of oxide characteristics from QBD measurements and each can be used for its corresponding monitoring applications.
Using very low current (around 1 pIA) criteria in VBD measurements allows us to detect one or more oxide defects under any gate of conventional size, independent of gate material and gate area. Hence, using statistical calculations based on the total gate count, the gate count under which there is at least one oxide defect, the gate area, and total oxide area, numerous VBD measurements over the wafer can determine defect density more reliably than QBD test. This kind of VBD test can easily be done with automatic mercury probe systems such as the Four Dimensions, Inc. CVmap92A [6].
10 '$ Silicon wafer oxidized in FabA
80
VOLTAGE BREAKDOWN (VBD) TEST FOR DETERMING DEFECT DENSITY It has been reported that defects on the Si surface introduce defects in the thermal oxide grown on it [1] [2]. This points to a practical and convenient way of monitoring defect density on the surface of a Si wafer and its distribution, i.e., measuring VBD or charge-to-breakdown (QBD) at many sites of its oxides thermally grown in a clean furnace, then determining the defect density statistically based on counting of good and bad sites, and then show the bad sites on the wafer map. However, experiments show that the bad site and good site counts and their locations are very different between VBD and QBD tests. This raises the question of which one of these techniques is to be relied on for monitoring defects.
Martin et al. reported that stressing at higher current significantly reduces QBD [3]. At higher stress current the device operates in the steeper region of the oxide I-V curve leading to stress current less likely to be evenly distributed under the gate. Also, it is well known that QBD is very gate material dependent [4]. The QBD can be orders of magnitude different between poly-Si and metal gates. Furthermore, QBD can depend on the conductivity of the oxide under stress, as it has been shown that QBD is voltage dependent [5], and oxides of different conductivity experience different voltages across it under a constant stress current. Being dependent on such factors, one can see that QBD tests may not be a reliable oxide defect density monitor.
130
(Good Oxide)
Silicon wafer oxidized in Fab B (Bad
C, 60 * 40
A
Lin~~ear Voltage Ramp Rate
20
IlV/s
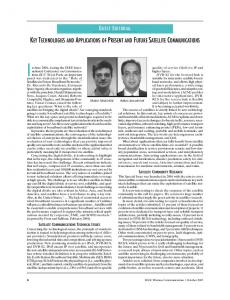
0 5 10 15 20 25 30 35 Breakdown Voltage VBD [Volts] Fig. 1: Cumulative failure percentage vs. breakdown voltage (VBD) of two different oxides fabricated at two different locations. Fig. 1 compares two on-wafer oxides through their cumulative failure percentage vs. breakdown voltage plots based on the results of 68 site ramp-voltage to breakdown tests for these two oxides. The plots clearly show the quality difference. But since the oxides had different thicknesses, there can be sites on the bad oxide to have significant higher breakdown voltage than the good oxide. One can, however, convert the plot units of cumulative failures vs. tBD using an equation proposed by Lee et al. [7] as shown below, for comparing them on the same scale as shown in Fig.2: tBD
= r0
exp( GX eff Vox )'
where: tBD is the calculated time to breakdown, VO, is the voltage across the oxide, G _ 350 MV/cm, r0 = 10-11 s, and Xef is the effective oxide thickness:
0-7803-8992-11051$20.00 @2005 IEEE
2005 IIRW FINAL REPORT
POSTER PRESENTATION
Xeff
=
XO- AXox
QBD
I
AXox is the effective local oxide thinning due to a defect. Experimentally, the value of Xeff depends on the ramp rate R [V/s] and on the VBD itself, and can be calculated numerically using the equation: VBD
2
R.G.X eff
100
= 80
GXeff
exp(
V BD
)
=
O
In Fab A (Good Oxide)
Silicon Wafer oxidiz > 60 1 in Fab B
g40
(Bad Oxide)
Const F
@ X
TEST
100
0
*60 .>
Fig. 2: Re-plotting Fig. 1 by converting the breakdown voltage to tBD using Lee's equations.
80
A Dry oxide grown on regular raw silicon wafer} DD=0.37 [cm-2]
*
60
[] Dry oxide grown
epi-Si layer
DD=O. 1
40
20
tBD
ox
Z*
Very small gate area ~ 7 x 10⁻⁵ cm2
U
Larger gate area
ig
X
3.25 x 10⁻³ cm2
40
X
20
X,
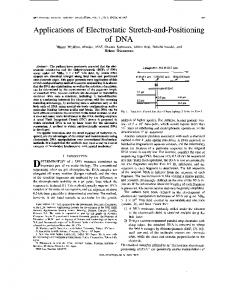
Fig. 4: Effect of the gate area on the distribution of charge to breakdown. The observed defect densities are smaller if QBD is measured with very small gate area.
l0years
0
l.E-10 1.E-06 L.E-02 L.E+02 1.E+06 l.E+10 Calculated Time to Breakdown t BD [S]
Fig. 3: A comparison of cumulative failure vs. tBD plots of the oxides grown on a regular raw silicon wafer and on an epi wafer reveals the difference in distribution of the data points and thus the defect density. A criterion for poor tBD can be chosen for determining defect density from Fig. 2. Fig. 3 shows cumulative failure vs. tBD plots of two oxides grown on different wafers for comparing the wafer surface crystal defect densities.
2005 IIRW FINAL REPORT
OXIDE
° n n T0 =130A, A I.E-4 1.E-2 L.E-1 I.E-3 Charge to Breakdown QBD [C / Cm2]
--
[cm-2]
Const Field V = 8 MV/cm
*
O)80
L.E-10 I.E-05 I.E+00 I.E+05 1.E+10 Calculated Time to Breakdown tBD [s]
100
DETERMINING
Using very small gate areas for QBD measurement can greatly improve the stress current uniformity. This reduces the dependence of QBD on the gate material and the gate current magnitude. As mentioned, these two factors can lead to stress current non-uniformity for large gate areas. Ultimately, if the gate area is small enough, the measured QBD is believed to depend only on the intrinsic oxide property, such as its conductivity. Fig. 4 shows the probability of failure VS. QBD for tests done on the same wafer, using a mercury gate with very small area, (7x10⁻⁵ cm2, test current 1 ,uA) and larger one (3.25x10⁻³ cm2, test current 10 ptA). This clearly shows testing with large gate area results in much smaller QBD, presumably due to non-uniform stress current distribution in large gate area stress. We suggest QBD tests are suitable for examining oxide intrinsic properties, not for defect density, because the gate area in the QBD test should be very small. We expect more conductive oxides, such as doped oxides, to have higher QBD. Typical I-V curves of doped and un-doped oxides are shown in Fig.5.
IO 12 years
U 20
FOR
INTRINSIC PROPERTIES
E
I1
SiO2 doped by
U.0
5.0
1.E-7
E I.E-8
It l.E-9
*l.E-10V l.E-l
-
i
1
10.0
15.0
Oxide Field IMV/cm] Fig.5: Current density voltage characteristics of SiO2 doped with phosphorus and boron. Plots of I-V characteristics of regular undoped SiO2 are shown for comparison. -
131
POSTER PRESENTATION
furnace is contaminated. If the breakdown voltages of these spots are close together, measuring QBD at a few spots can reveal whether the oxide is doped. Fig. 7 shows the same kind of plot for oxides grown before and after furnace cleaning, for a furnace not in a manufacturing facility.
1100
80 4) .
.o
Cd
4.4
0
.
-4
4--a
Cd
0 0
u
60
40
V
*
\
Si surfacej not cleaned
-1
-
,
before
tBD V
Const Field -
ox
oxidation DD=1 .29cm.
20
8 MVlcm 10
In some cases in addition to the statistical distribution of the breakdown voltage like this one in Fig. 1 it is also important to look at the location of the defects throughout the wafer. The visual distribution of the data from Fig. 1 is shown in Fig.8.
years
L.E-10 I.E-06 1.E-02 I.E+02 I.E+06 L.E+10 Calculated Time to Breakdown tBD [s] Fig.6: The cumulative failure vs. tBD plots of oxides grown with and without pre-oxidation clean clearly reflects the difference contamination can make to tBD distribution and defect density of oxide.
800
o
Si Wafer oxidized
Cleaning Furnace DD=1.8 [cm-2]
Before}
oxidized Si Wafer SimilarFurnace Q 60 :1 After Cleaning 40 DD=0.75 [cm-2] > tBD @ Const Field 20 =8 MV/ ~~~ 0x
Fig.8: Visual (Face and Perspective) breakdown voltage (VBD) distribution within the wafer.
lOyears
l.E-1i
l.E-06 l.E-01 1.E+04 l.E+09 Calculated Time to Breakdown tBD [S]
REFERENCES [1]
[2] [3]
Fig.7: Impact of the furnace contamination on the time to breakdown distribution. Defect Density (DD) in the SiO2 decreases from 1.8 [cm~2] to 0.75 [crn2] after furnace cleaning.
[4]
MONITORING FURNACE CONTAMINATION
[5]
Oxides grown in a contaminated furnace should be either more conductive, because of doping, or have more defects due to precipitation of foreign materials in the oxide and deposition of particles on the wafer or both. Experiments have been done to illustrate how contaminations can lead to different oxide defects detected by multiple site ramp voltage VBD measurements. Fig. 6 is an example of Cumulative Failure vs. Log tBD [7] of samples without and with pre clean. These plots show that cumulative failure points are spread over a wider log tBD range for the wafer with no cleaning before oxide growth. One can put a relatively defect-free wafer, such as an epitaxial wafer, in the monitoring furnace to grow oxides of about 20 nm to 50 nm thick, then let it be ramp-voltage VBD tested at numerous locations all over the wafer. Inconsistency in breakdown voltage reveals that the 132
[6] [7]
H. Abe, et al., "Analysis of Defects in Thin SiO2 Thermally Grown on Si Substrates", IEDM, pp. 372375 (1985) M. Itsumi, et al., "Oxide Defects Originating from Czochralski Silicon Substrates", J. Appl. Phys., 72, pp. 2185-2191 (1992) A. Martin, et al., "Dielectric Reliability Measurement Methods: A Review", Microelectron. Reliab., 38, pp. 37-72 (1998). X. Gao, "Influence of Gate Material on Charge to Breakdown in P-Type Si MOS Structure", Ext. Abst., Spring Meeting ECS, San Francisco, CA, Abst. 136, p.209 (1994) J.H. Stathis, "Physical and Predictive Models of Ultra Thin Oxide Reliability in CMOS Devices and Circuits", IEEE 39th Annual Int. Reliab. Phys. Symp., Orlando, FL, pp. 132-148 (2001) Instruction Book, of CVmap92A, Four Dimensions, Inc. Jack C. Lee, et, al., "Modeling and Characterization of Gate Oxide Reliability", IEEE Trans. Electron Dev., 35, pp. 2268-2278 (1988)
2005 IIRW FINAL REPORT


![Graph theory and its applications [Book Review] - IEEE ... - IEEE Xplore](https://m.moam.info/img/260x300/graph-theory-and-its-applications-book-review-ieee_5baa4e93097c47566d8b4752.jpg)