Unfortunately, this method relies on a manual registration of the different images. ..... Golub, G., Loan, C.V.: Matrix Computations 3rd Edition. The Johns Hopkins.
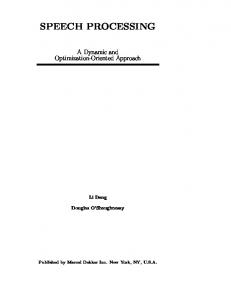
Some experiments in Audio-Visual Speech Processing G. Chollet1 , R. Landais1 , T. Hueber1,2 , H. Bredin1 , C. Mokbel4 , P. Perrot1,3 and L. Zouari1 1
CNRS LTCI/TSI Paris, 46 rue Barrault, 75634 Paris Cedex 13 - FRANCE Laboratoire d’Electronique - ESPCI - 10 rue Vauquelin - 75005 Paris - FRANCE 3 Institut de Recherche Criminelle de la Gendarmerie Nationale (IRCGN), 93110, Rosny sous bois, FRANCE 4 University of Balamand, Po Box 100, Tripoli, LEBANON
2
Abstract. Natural speech is produced by the vocal organs of a particular talker. The acoustic features of the speech signal must therefore be correlated with the movements of the articulators (lips, jaw, tongue, velum,...). For instance, hearing impaired people (and not only them) improve their understanding of speech by lip reading. This chapter is an overview of audiovisual speech processing with emphasis on some experiments concerning recognition, speaker verification, indexing and corpus based synthesis from tongue and lips movements.
1
Introduction
A talking face is more intelligible, expressive, recognisable, attractive than acoustic speech alone. Natural speech is produced by the vocal organs of a particular talker. The acoustic features of the speech signal must therefore be correlated with the movements of the articulators (lips, jaw, tongue, velum,...). For instance, hearing impaired people (and most of us) improve their understanding of speech by lip reading. Lip reading also increases understanding in adverse environment. All these reasons motivate the research done on audiovisual speech processing. This chapter is an overview of audio-visual speech processing. The combined use of facial and speech information improves speech recognition, identity verification and robustness to forgeries. Multi-stream models of the synchrony of visual and acoustic information have applications in the analysis, coding, recognition and synthesis of talking faces. SmartPhones, VisioPhones, WebPhones, SecurePhones, Visio-Conferences, Virtual Reality worlds are gaining popularity. This defines several applications of audiovisual speech processing, e.g: – Audio-Visual speech recognition : Automatic lip-reading to help understanding in adverse environment like a cocktail party, . . . – Audio-Visual speaker verification : Detection of forgeries – Speech driven animation of the face : Could we look and sound like somebody else ?
– Speaker indexing : Who is talking in a video sequence ? – OUISPER : a silent speech interface : Corpus based synthesis from tongue and lips movements This chapter reviews some of the signal processing techniques which have been developped and experimented for these applications. It is organised as follows : features extraction techniques, for face and speech are first analysed, followed by an overview of modelling and classification techniques. It is shown within this chapter how similar techniques may be used in the framework of five different applications. The experimental results of these applications are detailed and finally, conclusions and perspectives are given.
2
Features Extraction
Audiovisual applications analyse video data and take benefit from information extracted from the two available signals: the audio and the visual signals. Features extraction from these two signals is the preliminary step to any further analysis. The most common features used in the five applications mentionned previously are detailed here. Apart from the description of the features, this section also addresses issues related to temporal and spatial segmentation, to the sampling of signals and to the dimension of features vectors.
2.1
Temporal Segmentation
One of the main difference between the audio and the visual signal extracted from a video stream is the temporal sampling : while the visual stream is divided into frames which could be directly handled, audio samples are generally grouped together to form larger units which allow to extract reliable features. Audio samples can be grouped using a sliding analyis window (e.g of 10ms). This window moves over the signal (overlapping may be allowed) and each position leads to the extraction of relevant audio features to characterize the temporal segment attached to the window. As speech oriented applications are considered, the basic signal unit is the phone (or a subword based unit as speech synthesis is concerned). Phonetic segmentation is generally performed in the same time as their recognition. For example, phones are modeled into three to five states within a Hidden Markov Models (HMM) framework, and the features extracted from a sliding window are used as observations to estimate the current state. Whenever the signal leaves the last state of a given phone, a phonetic temporal boundary is added. More details are further given concerning HMM and speech recognition in section 4.2. Whenever phonetic modeling is adopted, all or a part of speech training databases must be manually segmented into phones. Unfortunately, such a manual phonetic segmentation of the speech signal is difficult and time consuming.
For applications where text output is not needed, an alternative segmental decomposition of speech, called ALISP (Automatic Language Independant Speech Processing techniques), has been introduced in [1]. This decomposition is computed in three main steps. First, speech signal is decomposed into variable length units using the temporal decomposition algorithm described in [2]. This algorithm is based on the detection of quasi-stationary segments in the parametric representation of the signal. Then, unit classes are built by gathering together acoustically similar speech segments using an unsupervised vector quantization algorithm [3]. This decomposition is driven only by the data and is independent from the language and from the text, but correspondence of ALISP segmentation with phonetic transcriptions has been studied [4]. A consistent mapping was found, which was however far from a one to one correspondence. Applications using the ALISP segmentation are discussed later. 2.2
Managing sampling rates and alignement
Two issues arise when first comparing an audio stream with a visual one: the difference in sampling rates and the alignement. Concerning sample rates, any easy solution to recover a common sampling rate is to choose for a reference which may be the audio rate or the visual one. In the first case, the visual signal must be over sampled. For instance, if a sliding window of 10ms is considered to produce audio observations while video frames are observed every 40 ms, interpolation must be provided to produce ”new” visual features leading to the same number of frames per second (cf 4.2, 4.3). Another problem is alignement. Audio and visual streams may not be synchronised at a particular time due to co-articulation effects and articulator inertia. In fact, the articulators sometimes move in anticipation of a phonetic event before the phone is produced. In these cases, the visual information may be available before the acoustic evidence. Many methods for modelling audio-visual asynchrony have been proposed and are detailed in section 3. 2.3
Spatial segmentation
Prior to any feature computation stage, video frames are usually spatially segmented in order to focus on particular regions of interest. Applications reported in this chapter mainly deal with speech processing. Most of these regions of interest are therefore related to faces; that is either faces or face features like eyes or lips. In most of the cases, face features are localized within a face area which has been previously determined. A complete survey about face detection may be found in [5]. Two face detection systems have been experimented. The first one, the Viola and Jones algorithm [6], may be qualified as a ”classical” one, considering that
its use is widely spread over the community. It is based on the estimation of a ”strong” classifier composed of a cascade of many weak classifiers, each of these weak classifiers being attached to a particular Haar feature. A stage of learning is thus required to produce this ”strong” classifier. The nature of the data included in the learning base then influences the type of faces which can be correctly detected afterwards. As a consequence, different cascades must be learnt to allow the detection of faces under different orientations. Typically, a cascade is dedicated to frontal faces detection and another one to profile faces detection. This system has been used in the framework of the VMike project concerning audiovisual speech recognition (cf section 4.2). Faces are first extracted thanks to a frontal cascade. A mouth cascade (that is to say a classifier which has been learnt over a database containing samples of mouth), is applied on the lower part of the detected face. The second system may be considered as a probabilistic equivalent of the Viola and Jones method [7]. While this system still relies on the estimation of a strong classifier, the difference is that the underlying classifier function is then used to estimate the distribution of the object of interest (faces in our case), that is to model the generation of such objects within images (such a model is called a ”generative model ”). As this distribution is computed, many partitions of the input images are considered and the patches they are composed of are assigned a label (”object of interest” versus ”background”) depending on the estimation of likelihoods. As for the Viola and Jones method, any object may be considered. A two stage process then allows to detect faces and eyes within faces. This algorithm has been applied prior to features extraction within the framework of asynchrony detection 4.3 and within the framework of face verification. Concerning the asynchrony detection application, eyes position allows to determine a region of interest where to look for the mouth knowing the geometrical structure of the human face. Then, the actual mouth detection step is performed using a Viola and Jones detector [6]: it was developped by Castrill´ on et al. [8] and is freely available on the internet for download. A different kind of face features is used on ultrasound images within the framework of the OUISPER project (section 4.4). In that context, objects of interest are the lips, the jaws and the tongue. A classical approach to characterize such local objects is to extract their contours using automatic methods. Fully automatic methods use classical edge-detection method, basically Canny’s one or its variations to segment an object in the image. Such methods are easy to use and require no a priori knowledge on the object shape. However, non relevant contours could also be extracted and a post-processing is often needed to remove them. Furthermore, the parametrization of extracted contour is a difficult task. Active contours (also known as Snakes), introduced by Kass [9], are semi-automatic methods to track edges in image sequences. They are based on the assumption that the edge is smooth and that the object is well contrasted with respect to the background. Here, the contour is initialized manually and its
motion is driven by the image data, minimizing a potential, which can embed a priori knowledge on the object shape and on its motion. In order to track an object in sequence, the contour found in the current frame can be used to initialize the contour in the next frame.
2.4
Faces normalization and selection
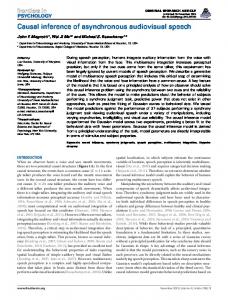
Once eyes position is obtained within a face, a geometrical normalization is performed in order to make the line between the eyes horizontal. Then, a mask is applied in order to remove artifacts that might appear at the border of the face. Finally, image pixels are normalized by histogram equalization. Figure 1 shows an example on a face from the BANCA database (see section 4.1).
Fig. 1. Face detection and normalization
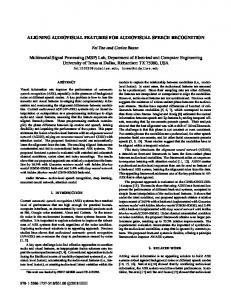
Given that the rotation of the face, its (partial) occlusion or bad lightning conditions can lead to a poor quality detected face whose features are not representative of the person, a method has been designed to keep only the best faces. This selection is obtained by removing all detection results that might lead to degraded results regarding the aimed application (e.g: authentication). For each frame f of the video, a reliability score r(f ) is computed as the inverse of the euclidean distance between the detected face and its projection into the eigenface space (see figure 2). Consequently, a threshold is applied on r(f ) in order to keep only the best faces within the video sequences: Face f is selected if and only if r(f ) > α · max r(f 0 ) . 0 f ∈Nf
(1)
Fig. 2. Reliability based on the distance from face space.
where Nf is the set of all faces detected in the video sequence. α = 23 has been used in our experiments. Only the selected faces are then used for authentication. Figure 3 shows an example of the application of this method.
2.5
Audio features
Most speech recognition and speaker verification systems use short-term cepstral features. The two most popular sets of features are cepstrum coefficients obtained with a Mel-frequency cepstrum coefficient (MFCC) [10] analysis and the ones whose computation relies on a perceptual linear predictive (PLP) [11] analysis. In both cases, a short-term power spectrum is estimated on a fixed frame (20-30 milliseconds), with the most used frame rate being 100 hz. To get MFCC coefficients, a cosine transform is applied to the log power spectrum. A root-linear prediction cepstral coefficient (LPCC) analysis is used to obtain the PLP cepstrum parameters.
Fig. 3. Face with maximum r (left), selected (center) and rejected face (right)
2.6
Visual Features
A difference must be made between local features which are attached to a particular set of points within the region of interest that must be characterized ; and global which produce a new representation of the region of interest treating it as a whole. Both features are detailed thereafter. Local features SIFT (Scale Invariant Feature Transform) descriptors [12] are known to be among the best local descriptors [13]. Their extraction can be coarsely summarized into three stages: extraction of keypoint candidates, filtering and descriptors calculation. Keypoint candidates extraction relies on the scale-space theoretical background [14, 15]. Once these candidates are extracted, their location is refined and their scale is determined. Keypoints are then filtered according to some constraints on contrast and geometrical properties (ratio of principal curvatures). Each remaining keypoint is finally represented by a 128 dimensional vector by computing gradient orientation and magnitude over its neighbourhood and by quantizing values spatially (reducing to a 4x4 array) and regarding orientation (8 bins). Each keypoint is also defined regarding three other data: its spatial location, its scale and its orientation. SIFT descriptors have been used for face verification (cf section 4.3). Global features Local methods require a precise localization of particular points within the region of interest. Depending on illumination, occlusions, such a localization may not be easily obtained. Global methods then allow to overcome this drawback. The first kind of global features rely on the Discrete Cosine Transformation (DCT) which are used for asynchrony detection (cf section 4.3) and audiovisual speech recognition (cf section 4.2). Their extraction is illustrated in figure 4. Only the 28 coefficients corresponding to the low spatial frequency are kept, as shown in figure 5.
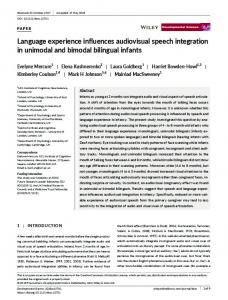
Fig. 4. Visual speech features extraction. 1– Eyes detection. 2– Selection of the region of interest where to look for the mouth. 3– Mouth detection. 4-5– DCT coefficients computation.
Fig. 5. Visual speech features extraction. 28 low spatial frequency DCT coefficients are extracted, in a zigzag manner.
The eigenfaces method [16] may also be used to code the relevant information in the region of interest. The main principle is to project face images (viewed as intensity vectors) in a space where data scattering is maximized. Such a space is obtained by applying Principal Component Analysis (PCA) over a training set composed of numerous face images. Its direction vectors are called eigenfaces as they refer to eigenvectors of the training data covariance matrix. Such a method may easily be extended to any visual object given that enough learning data are available. It has thus been applied to lips (eigenlips) and tongues (eigentongues) within the framework of our experiments concerning audiovisual speech recognition (OUISPER project). The control points of the optimal snake are good features of the object edges.
2.7
Audiovisual features and decision fusion
Each of the audiovisual applications detailed in the next sections are related to an underlying decision process: transcribing speech, deciding whether a person claiming he/she is person λ is effectively λ, deciding whether an audio stream is synchronised with the visual one, etc. All these decision processes may take benefit from considering in the same time audio features vectors and visual ones. Two main approaches may then be adopted. The first one is called early fusion and is based on the computation of audiovisual features vectors from audio and visual features vectors (for instance concatenation). The second one is called late fusion and relies on the fusion at the decision level. Many different methods may be applied to combine the outputs of all the classifiers used in the modeling process [17]: majority voting, max, min, sum, . . .. We will also mention here the use of Support Vector Machines SVMs to perform fusion at the score level (e.g for audiovisual identity verification involving scores given by each modality. Early and late fusion methods have been experimented within the framework of several audiovisual applications and are detailed thereafter. 2.8
Dimension reduction
The size of the learning databases required to compute models is a function of the dimension of the feature vectors chosen to represent audio segments/visual regions. As a consequence, handling high dimensional feature vectors may be difficult if not enough learning data are available. Dimension reduction may then be used to overcome this issue. Many methods are available: Principal Component Analysis (PCA) or Linear Discriminant Analysis (LDA), . . . PCA has already been presented within the section concerning eigenfaces. LDA is much more appropriate for classification. Typically, its properties are interesting for audiovisual speech recognition (cf section 4.2) since classes are then known (phones). On the difference of PCA which tends only to maximize intraclasses scattering, LDA also tends in the same time to minimize inter-classes scattering. Another method for dimension reduction is the Co-Inertia Analysis (CoIA [18]).This method is a multivariate statistical analysis that aims at jointly transforming two signal (the acoustic and the visual one when performing audiovisual synchrony analysis) in order to maximise their covariance. Denoting X ∈ Rn and Y ∈ Rm the acoustic and visual features vectors, CoIA can be summarized by the following equation (a and b are column vectors of A and B optimal projection matrices): ¡ ¢ (a, b) = argmax cov at · X, bt · Y (2) (a∈Rn ,b∈Rm )
Details for A and B calculation can be found in [18]. It will be shown in section 4.3 how to derive synchrony measures from A and B matrices using their first K vectors.
3
Modeling and classification
Once features vectors have been extracted from the audio and the video stream, a modeling stage is applied to compute representations which will be used to make the final decision. Most of the time these models are statistics. For instance, Gaussian Mixture Models model the distribution of observation vectors as a combination of gaussian distributions. These models may be used for modeling phones observation distribution, as the speech of a given speaker (see sections 4.2,4.3). Hidden Markov Models (HMMs) then allow to model a statistical process involving different states. These models are at the heart of many audiovisual applications and are detailed in this section. 3.1
Gaussian Mixture Models
As already mentionned, GMM distribution is a mixture whose components are classical Gaussian distributions. This results in the following form for the GMM distribution:
p(X) =
K X k=1
wk Nk (X, µk , Γ k ) =
K X
° °−1/2 1 T −1 ° ° wk (2π)−p/2 °Γ k ° e− 2 (X−µk ) Γ k (X−µk )
k=1
(3) where K, X, wk , µk , Γ k are respectively the number of components in the GMM, the speech feature vector, the weight of the kth component in the mixture (i.e. its probability of appearance), the mean vector and the covariance matrix of this k th Gaussian component. Given a GMM to model the speech, a sequence of T speech feature vectors will have the following likelihood: p(X 1 , ..., X T ) =
t=1 Y
p(X t )
(4)
T
This supposes that the speech feature vectors are independent given the GMM model. Therefore the same likelihood will be obtained if we take a random order of the same sequence of T vectors. Large GMM distributions have been used to represent speech in general in speaker recognition systems [19]. The number of components K can take large values, sometimes more than 2048. Given a set of feature vectors the estimation of the GMM parameters, i.e. the components weights wk and the mean and covariance matrices (µk , Γ k ) does not have a direct analytical solution. The estimation of the distribution parameters is then based on the Estimation-Maximization (EM) algorithm. It is an iterative algorithm that adjusts in each iteration the model parameters while ensuring a non-decrease of the likelihood of the training data. In some cases, the amount of data available for training is not large enough to estimate the GMM parameters. A constrained training is applied and is called
adaptation. Actually, starting from an existing GMM, the parameters are adjusted in order to better describe, based on a criterion, the training data. The adjustment is constrained either by an a priori distribution function like in the Maximum A Priori (MAP) or Bayesian adaptation or by a transformation function applied on the models parameters like in the Maximum Likelihood Linear Regression (MLLR) adaptation. A unified adaptation theory has been proposed in [20]. 3.2
Hidden Markov Models
A Markov Model is a finite state machine composed of N states. It changes state once every time unit. In Hidden Markov Models states are not observed and each time a state is entered, it emits an observation according to a statespecific probability distribution. Formally, an HMM is defined as : λ = (si , aij , bj ) si state ii=1,2,..,N aij transition probability between i and j bi (ok ) emission probability of observation ok at state i
a11
state 1
p1(o1)
o1
a22
a12
state 2
p2(o2)
o2
a33
a23
state 3
p3(o3)
o3
Fig. 6. Example of a HMM model with three states
Looking at a series of observations O = o1 , o2 , ..oT does not directly indicate the sequence of states S = s1 , s2 , .., sN which are hidden. However, knowing the emission probabilities bi (ok ) and the transition probabilities aij allows to estimate the associated states sequence thanks to the Viterbi algorithm [21]. All these probabilies are thus required to compute the sequence of hidden states.
The very first stage is then to estimate them using the Baum-Welch algorithm over a training set. 3.3
HMMs extensions
Two other kinds of statistical models may be derived from the classical HMMs to facilitate audiovisual process modeling, namely the Multistream HMMs and the coupled HMMs (CHMMs) [22–24]. Multistream HMMs may be considered as a late fusion method. In this approach, each modality (here the audio one and the visual one ) is independently processed and pre-classified. The final classification is based on the fusion of the outputs of both modalities. Multistream HMMs derive the most likely class by taking the product of the likelihoods of the two single-modality classifier decisions, using appropriate weights λ. The models for each mode are estimated separately. In the case of state-synchronous decision fusion, the scores (weighted likelihoods) are multiplied after eachtime unit in order to find a new audio-visual likelihood of the observation being generated by a state : P (oav,t |s) = P (oa,t |s)λa P (ov,t |s)λv An advantage of decision fusion over early fusion is the possibility of weighting the importance of the two modes independently: the weights λa and λv may be chosen so as to model the reliability of each modality. However, assigning the good weights to different streams is a critical step and if the weights are not chosen properly, the system might perform poorly. In fact, the weights can be defined in a static manner by using a-priori knowledge or they can be estimated and learned on a validation dataset. For a more complete description of this dynamic weighting technique, we refer the reader to [25] in which multi-stream combination is used to improve the noise robustness of automatic speech recognition (ASR) systems. It has already been explained that audio and visual streams may not be synchronised at a given time due to co-articulation effects and articulator inertia. Many methods for modelling audio-visual asynchrony have been proposed in the literature including multistream HMMs we presented above, product HMMs and coupled HMMs. The product HMM is a generalisation of the state-synchronous multistream HMMs that combines the stream log-likelihoods at an higher level. A CHMM [24] can be considered as a set of HMMs in which each HMM is dedicated to one stream. In the common topology of coupled HMM, the discrete nodes at time t for each HMM are conditionned by the discrete nodes at time t − 1 of all the HMMs of the set. Thanks to this property, CHMM can model the audio and visual state asynchrony while preserving their natural correlation over time.
4
Applications
Four main on-going experimentations will be detailed afterwards: audiovisual speech recognition, audiovisual identity verification, speaker indexing, and speech
reconstruction from silent-speech. All these applications make use of the features and models which have been presented in the previous section. 4.1
The BANCA database
The BANCA database [26] has been used for our experiments concerning audiovisual speech recognition and for our audiovisual identity verification system. Here is a brief overview of its content. The BANCA database contains audiovisual recordings of 52 persons talking in front of a camera equipped with a microphone. Two disjoint groups (G1 and G2, of 26 persons each) are made of 13 females and 13 males. Each person recorded 12 sessions divided in 3 different conditions. In each session, one true and one false identity claims were recorded. The difference between true and false identity claims only stays in what the person says: his/her name and address and a personal PIN for true identity claims, and the name and address and the personal PIN of the target for false identity claims. Concerning identity verification, seven evaluation protocols for identity verification are defined for the BANCA database. The Pooled protocol, which contains 232 client accesses and 312 impostor accesses per group, from any recording conditions has been chosen for our evaluation.
4.2
Speech recognition
Most state-of-the-art Automatic Speech Recognition (ASR) systems make use of the acoustic signal only and ignore visual speech cues while visual information has been shown to be helpful in improving the quality of speech recognizers, especially under noisy conditions [27–29]. The system described in this section involves information extracted from both modalities to improve recognition performances. Audiovisual recognition units: Audio only ASR systems generally use phones as basic recognition units. As the visual signal only provides partial information about the underlying sequence of phones as all the articulators are not visible (usually only the lips), various sets of phones that are acoustically distinct may be visually indistinguishable. A possible solution is to consider ”visemes” (the linguistically minimal units which are visually distinguishable). However, having different classes in the audio and the video system components complicates audiovisual integration: identical classes for both modalities will then be used afterwards and both components will recognize phones. Audiovisual integration: The concept behind bimodal ASR is to combine the information from each mode in order to increase performances which could be obtained considering each mode separately [29–31]. Both early and late fusion have been tested.
Early fusion: the vectors of each single mode are concatenated. Given timesynchronous audio and visual feature vectors oa,t and ov,t , feature fusion considers oav,t = [oa,t , ov,t ] ∈ Rlav, where lav = la + lv as the joint audio-visual observation. So a single classifier is trained on the concatenated vector. It is also possible to process the concatenated vectors with any transformation (such as Linear Discriminant Analysis LDA) in order to reduce the increased number of coefficients and facilitate classification (see Figure 7). Late fusion: as already explained, multistream HMMs derives the most likely speech class by taking the product of the likelihoods produced using models learned for each mode. The final likelihood is then: P (oav,t |s) = P (oa,t |s)λa P (ov,t |s)λv
Audio FrontEnd 1 .
state
P(o | c) state
.
1
.
.
39 1
. .
1 .
LDA
.
.
.
.
40
state
P(o | c)
79
. 40
Decision Fusion
Video FrontEnd
Feature Fusion
Fig. 7. Example of discriminative feature fusion and state-synchronous multistream integration
Experiments: Data and features This work is done within the framework of the VMike project [32]. VMike is a video microphone, which includes both a microphone and an optical retina. Experiments have been led on the BANCA database: 208 subjects were recorded in three different scenarios, controlled, degraded and adverse over 12 different sessions. During each recording, the subject was prompted to say a random 12 digit number, his/her name, address and date of birth. In the scope of this work, only the 12 digit sequences of the scenario ”controlled” are extracted. In order to test the performance of the developed audiovisual speech system under noisy conditions, those utterances are combined with samples of babble noise at several signal to noise ratios (SNR). The babble sample is taken from the NOISEX database [33]. The retina has been simulated for evaluation. First, a detection algorithm is applied on every frame and outputs the position of the mouth as an image of size
200x200 (thanks to the Viola&Jones mouth detector described in section 2.3). Horizontal and vertical projection profiles are then computed (cf fig. 8).
130
X
125
Y
120 115 110 105
0
20
40
60
80
100
120
140
160
180
200
150
Y
140 130 120 110 100 90 80
0
20
40
60
80
100
120
140
160
180
200
X = x1, x2, ..., x200
Fig. 8. Horizontal and vertical profiles
The 200 projections along the X axis and 200 projections along the Y axis are concatenated to a single vector whose dimension is reduced to 40 using an LDA after a feature mean normalization. So as to capture dynamic speech information, each vector is then extended by concatenating its 7 chronologically preceding and the 7 following vectors. The resulting 600 features per sample are finally transformed into vectors of 40 using LDA. In order to compare these features to state-of-the-art features, DCT coefficients of the detected mouths are also computed (these zones are firstly scaled to a 64x64 image) and the 100 most energetic coefficients are then selected. The same process as the one described for profiles features is then applied resulting in a DCT feature vector of size 40. The computation of all the visual features is summarized in figure 9: Concerning the audio features, 13 feature-mean-normalized MFCC coefficients are extracted and extended with first and second derivatives of each coefficient. In order to obtain audio and visual features synchronicity, a simple element-wise linear interpolation of the visual features to the audio frame rate is applied. From the up-sampled pictures the Discrete Cosine Transform (DCT) coefficients and profiles are extracted. Models and Fusion The acoustic models are context-independent. Each monophone consists of 3 states, which are modeled by 16 Gaussians each. The HTK Toolkit [34] software is used for model training and testing. For the feature fusion, the 39-dimensional audio vectors are simply concatenated with the 40-dimensional visual features (DCT or profiles respectively). The combined vectors are then LDA transformed before being used for model estimation. Decision fusion is obtained by combining separately trained models for the audio and the visual coefficients to two-stream models, with specific weights on
1 ... 64
1
.
DCT
.
Extraction
. . .
64
Extract 100 most
.
Energetic
.
+
.
Feature
1
Mean
.
Normalization
100
.
1
100
40
1
.
.
.
.
.
40
LDA
.
.
.
.
-
.
40
40
40
15 Frames
600
"DCT"
E[ . ] 1
.
. .
4096
1 ... 200
. 1
. .
. 1
.
LDA
.
1
1
t
1
1
"DCT2"
Upsampling
.
with Linear Interpolation
. 200
Rate = 100Hz
Video Signal Rate = 25Hz
"PRO" 1
t 125 120
X-Profile
115 110 105
0
20
40
60
80
100
120
140
160
180
1 .
200
.
150 140 130
Y-Profile
120 110 100
.
90 80
0
20
40
60
80
100
120
140
160
180
200
400
+
Feature
1
1
1
Mean Normalization
.
.
.
. . 400
LDA
. . 40
1 . . .
-
40
"PRO2"
1
.
130
.
1
. . 40
.
. . .
40
15 Frames
.
LDA
. . 40
600
E[ . ]
Fig. 9. Visual features extraction process
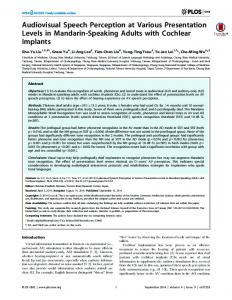
each stream. We assume state-synchronous fusion for combining the stream likelihoods. The optimal weighting is found through by trial-and-error. Results Two speech recognizers are then evaluated : video-only and audio-visual. The terminology for the different visual features is the following (see figure 9): DCT/PRO and DCT2/PRO2 correspond to the features without and with dynamic concatenation respectively. 1. Visual-only speech recognition: the results of all four different parametrization experiments do not exceed 45% accuracy (Fig.10). Using 15 consecutive vectors to include feature dynamics, did not improve performance. The results for single (DCT/PRO) and for concatenated (DCT2/PRO2) vectors respectively do not differ significantly. 2. Audio-visual speech recognition: figure (a) in fig. 11 shows the performance for all decision fusion recognizers at -5 db. Both DCT2 and PRO2 improve word recognition, but only DCT2 does so significantly compared to the audio-only system. When feature fusion is applied (figure (b) in fig. 11) under noisy conditions, the recognition is improved by up to 12 percent with respect to audio-only recognition. 4.3
Audiovisual identity verification
Biometrics identity verification systems have been proven to be much more effective when information extracted from several modalities are merged together [35]. The system presented in this section relies on the fusion of three different modalities: the visual modality based on face verification, the audio one based on speaker verification and the synchrony modality based on the analysis of the correspondence between the audio and the visual stream (in a region located
Fig. 10. Visual-only ASR
around the lips). We will also deal with the issue of speech conversion which may be considered as a high-effort attack against the verification system. Face verification Face verification may rely either on global face features (as in the eigenfaces approach [16]) or on local ones (approach using facial keypoints). The latter are able to capture geometrical relations between particular parts of the face and are thus more efficient when geometrical distortions occur. On the other hand, global features are easier to compute and takes the whole face into account: no information is lost. We propose to benefit from the complementarity of these two approaches in a fusion framework, where two algorithms based on global and local features respectively will be fused at scores level. The first algorithm uses classical eigenfaces global features (cf section 2.6) and the second one involves local SIFT descriptors (cf section 2.6). The comparison stage is the same for both type of features and is based on an SVD-matching process [36, 37]. SIFT descriptors have already been used together with the SVD based matching method in [38] which deals with object matching. Concerning face authentication in particular, SIFT descriptors have been tested in [39] where the matching between two images relies on the minimum euclidian distance between their SIFT descriptors. Unfortunately, this method relies on a manual registration of the different images. The main advantage of our method is then to propose an end-to-end system which does not suppose to know the position of faces before applying verification. SVD-based matching method was introduced for spatial matching between keypoints [36] and relies on the proximity and exclusion principles enunciated by Ullman [40], which impose one-to-one correspondences. Let us consider two sets of keypoints and R be the distance matrix between them. The matching consists in searching for pairs (i, j) that minimize Rij .
(a) Audio-visual decision-fusion results at -5db
(b) Audio-visual parameter-fusion results Fig. 11. Audiovisual ASR results
Searching for one-to-one correspondences may be facilitated if some projection matrix Q allows to make R closer to the identity matrix I. Such a problem is referred as the orthogonal procrustes problem: find the orthogonal matrix Q that minimizes ||R − IQ|| [41]. It is proven that Q can be computed as follows: 1. Compute R Singular Values Decomposition (SVD): R = U DV 0 2. Replace D by the identity I to get Q: Q = U V 0
The last step is then to extract good pairings (i, j) searching for the elements of Q that are the greatest both of their row and their column. This main principle is further improved by¡using a gaussian-weighted distance ¢ to compute the proximity matrix Gij = exp −Rij /2σ 2 where σ quantifies the maximal tolerated distance between two keypoints. This parameter is known to have very little influence on the final results [42] and will be set to 1/8 of the width of the image as this value has been already successfully tested [42]. A first extension was defined in [42] to take local descriptions around keypoints into account. SVD is then performed on the matrix G defined as Gij = f (Cij )g(Rij ) where Cij denotes the correlation between gray-levels around i and j keypoints, and where g is the gaussian function previously defined. Two different f functions may be used [37]:
Exponential: f (Cij ) = exp(−(Cij − 1)2 /2γ 2 ) . Linear: f (Cij ) = (Cij + 1)/2 .
(5) (6)
where γ = 0.4 [37]. A second improvement has been experimented in [38] where gray-level correlation is replaced with SIFT descriptors correlation (only the linear form for f function is tested). At test time, pairings (i, j) are filtered according to their associated correlation Cij and the number of pairings with Cij > Corrth is taken as the authentication score. Considering a video as a set of faces, the same SVD matching process is used to search for correspondences between two videos whatever face representation is used (the global one based on eigenfaces or the local one using SIFT descriptors). Concerning SIFT matching, our system is the same as the one in [38]. Position vectors (used to compute R proximity matrix) include the spatial location, the scale and the orientation of SIFT descriptors. A {²−λ} test will refer afterwards to an authentication test involving two videos: V ² of a person ² claiming she/he is person λ and V λ , the enrollment video of person λ. Let then NfSIFT be the number of detected faces selected (cf section 2.4) in each video. SIFT descriptors are extracted from each of these faces. Resulting video representations will be denoted afterwards as follows: {Sk² }k∈[1...NfSIFT ] k and {Skλ }k∈[1...NfSIFT ] , where Sk² = {s²,k k ] . Ndesc represents the number i }i∈[1...Ndesc
of 128-dimensional SIFT descriptors ski extracted from face k. Matching is performed between each pair (Sk² ,Slλ ) related to SIFT descriptors extracted from faces k and l retained from V λ and V ² respectively. In this case, Cij and Rij elements are computed between sk,² and sl,λ i j descriptors. An authentication score (i.e: the number of matchings between descriptors) is obtained for each pair (Sk² ,Slλ ). These scores are firstly normalized according to the number of SIFT
descriptors and their mean then produces a single score: ²
1
λ
S(V , V ) =
(NfSIFT )2
NfSIFT NfSIFT
X
X
k=1
l=1
M (Sk² , Slλ ) . min(N k , N l ) desc desc
(7)
where M (Sk² , Slλ ) is the number of matchings between Sk² = {s²,k k ] and i }i∈[1...Ndesc
Slλ = {sλ,l l ]. i }i∈[1...Ndesc Let us consider the same {² − λ} authentication test to set out the matching process for global representations. The same number NfPCA of detected faces is kept in each video. Their eigenface features will be denoted afterwards as {E²k }k∈[1...NfPCA ] and {Eλk }k∈[1...NfPCA ] respectively.
Pairwise matching is performed between each Ek² and Ekλ , that is between faces directly. As these features treat faces as a whole, location information is lost and the G matrix is reduced to its description part: Gij = f (Cij ). These Cij elements are computed between Ei² and Ejλ . This differs with SIFT matching since a single authentication score will be obtained for each test: S(V ² , V λ ) = M (E ² , E λ ) .
(8)
where M (E ² , E λ ) is the number of matchings between E ² = {Ek² }k∈[1...NfP CA ] and E λ = {Elλ }l∈[1...NfP CA ] .
Parameters have been set in the following manner during our experiments: NfSIFT = 5, NfSIFT = 100, Ei ∈ R97 (i.e we chose to keep the 97 most influent directions to compute global representations), Corrth = 0.4. The f function is linear for global matching and exponential for local matching. The form of f function has been chosen by cross-validation between groups G1 and G2 of the BANCA database. Speaker verification Speaker verification is based on GMM modeling (cf section 3.1) of each speaker included in the BANCA database. To overcome the lack of training data dedicated to each speaker, adaptation of a world (or universal) model is performed using the MAP algorithm. The verification score is computed as the following likelihood ratio : S(V ² , V λ ) =
µ ¶ 1 X P (x² |λ) log Nx x P (x² |Ω)
where x² denotes an observation vector in the audio stream of V ² , Ω the world model and Nx the number of observation vectors considered in the whole speech sequence. Synchrony modality
Speaker conversion and face animation can be considered as high-effort forgeries, which – if they are performed correctly – are very difficult to detect. But, most of the current talking-face biometrics verification systems can be fooled by much simpler attacks, e.g. replay attacks [43]. In this scenario, the impostor previously acquired a biometric sample of his/her target. For instance, he could have recorded his/her voice during a phone call and taken a picture of his/her face without being noticed. Then, a basic idea would be to play the recording of the voice through speakers while displaying the picture in front of the camera. An example of the resulting acquired picture is shown in figure 12.
Fig. 12. Example of a simple replay attack
Therefore we introduced a new biometric modality based on a client-dependent measure of the synchrony between acoustic and visual speech features. Audio and visual speech features are respectively MFCC and DCT coefficients extracted as explained in sections 2.5 and 2.6. In order to equalize the sample rates of acoustic and visual features (initially 100 Hz and 25 Hz respectively), visual features are linearly interpolated. Using the acoustic and visual features X and Y extracted from the enrollment sequence, CoIA (cf section 2.8) is applied in order to compute the clientdependent synchrony model (A, B). At test time, acoustic and visual feature vectors X ² and Y ² of the test sequence ² are extracted and Sc of their synchrony is computed using the ¡ a measure ¢ synchrony model Aλ , Bλ of the claimed identity λ: Sc (V ² , V λ ) =
D ´ ³ t 1 X t corr aλk X ² , bλk Y ² D k=1
(9)
where D is the number of dimensions actually used to compute the correlation. In our case we chose D = 3. Scores fusion The scores provided by each modality are finally fused in a late fusion framework involving SVM (cf section 2.7). Results obtained on groups G1 and G2 of the BANCA database are depicted in figure 13 which validates the initial idea of taking benefit from different modalities to improve performances.
Fig. 13. Performances of mono-modal and multimodal verification systems
It has already been explained that the synchrony modality is appropriate whenever robustness to high-effort attacks is required. In order to test synchrony modality superiority, some work has then been dedicated to generate forgeries which would defeat traditional modalities. Speech conversion is one of the possible high effort attack and will be adressed in the next section. Speaker conversion Automatic voice conversion may be defined as the process of transforming the characteristics of speech uttered by a source speaker, such that a listener would believe the speech was pronounced by a target speaker. Different kinds of information are included in the speech signal: environmental noise, speech message, speaker identity. The question of voice conversion is firstly, to establish the most characteristic features of a source individual to transform them to their target counterpart. The analysis part of a voice conversion algorithm focuses on the extraction of speaker identity. Secondly, it will calculate the transformation function to apply. Both operations must be performed independently of the environment and of the message. At last, a synthesis step will be achieved to replace the source speaker characteristics by the target speaker characteristics. Consider a sequence Xs = [x1 , x2, . . . xn] of spectral vectors pronounced by the source speaker and a sequence pronounced by the target speaker composed by the same words Yt = [y1 , y2 , . . . yn ].
Voice conversion is based on the calculation of a conversion function F that minimizes the mean square error: ²mse = E(ky − F (x)k2 ) where E is the expectation. Two steps are useful to build a conversion system: a training step and a conversion step. In the training phase speech samples from the source and the target speaker are analysed to extract the main features. Then these features are time aligned and a conversion function is estimated to map the source and the target features. The aim of the conversion step is then to apply the estimated conversion function rule to the source speech signal so that the new utterance sounds like the speech of the target speaker. The last step is the re-synthesis of the signal in order to reconstruct the speech segment of the source voice after the conversion. The most representative techniques of voice conversion are based on vector quantization [44], on Gaussian Mixture Models and derived [45–48], on Multiple Linear Regression [49] and on an indexation in a client memory [50]. Two of these conversion methods will be developed afterwards and their influence on an automatic speaker recognition system will be evaluated. The first one is based on ALISP (cf section 2.1) [50]. One hour of speech pronounced by the target speaker is available. This speech signal is segmented and vector quantization allows to extract 64 classes which will constitute the target codebook. As this speech signal is now annotated regarding these 64 recognition units (or classes), a HMM may be trained and applied on the source signal. Once the source signal has been segmented, the synthesis stage is applied: each segment is replaced by one of its closest counterpart in the same class (i.e the one with the same index) among target classes. This counterpart is selected comparing prosodic parameters (Harmonic plus Noise [48]) between the source segment and all the segment contained in the target class (cf figure 14) thanks to the Dynamic Time Warping (DTW). This technique of conversion provided interesting results on the NIST 2004 corpus [50], as the recognition rate effectively decreased when applying speech conversion. The second technique we experimented consists in modifying all the shape of the source spectrum to correspond to the target spectrum [49]. The different stages of this techniques are depicted in the figure 15. In the first time, the source segment and the target segment (they contain the same utterance) are aligned using DTW. Vector Quantization is then applied on each segment to extract 64 classes. Mappings between source and target classes is then estimated using DTW (mapping codebook). After a normalization stage over each class, conversion matrices (from source class i to target class j, . . .) are then estimated using Multiple Linear Regression. These matrices finally allow to transform a new source segment so that it corresponds to target speech in the feature space.
Fig. 14. Conversion step
Fig. 15. Obtaining the Mapping Codebook
As in the previous conversion method a significant decrease of the automatic speaker recognition is demonstrated on the DET curve (cf figure 16). The impact of speech conversion over a speaker verification system has been clearly established. The next stage will be to test whether a modality like the synchrony could help to deal with such attacks. 4.4
OUISPER
The audio-visual speech based applications discussed before use the video stream in addition to the audio stream to improve speech or speaker recognition. However, for some applications, the audio stream cannot be used at all: whenever
Protocol Mc − Group 1 original forged 40
Miss probability (in %)
30
20 15
10
5
2
2
5
10 15 20 30 False Alarm probability (in %)
40
(a) DET curve
45 Original Client Original Impostor Original Client Forged Impostor
40 35 30 25 20 15 10 5 0 −1
−0.5
0
0.5
1
1.5
2
2.5
3
(b) Score distribution Fig. 16. Results obtained using the Multiple Linear Regression approach
audio is too much corrupted by noise, or, at the opposite, in the context of speech communication in situations where silence and privacy must be maintained. These applications address the issue of speech recognition and/or speech reconstruction from silent-speech, that is normal speech without glottal activity. Speech recognition from silent-speech using electromyographic sensors to monitor the articulatory muscles has been introduced in [51]. In [52], an isolated word recognition task from whispered speech is investigated using a special acoustic sensor called non-audible microphone (NAM). In [53], Denby proposes to use
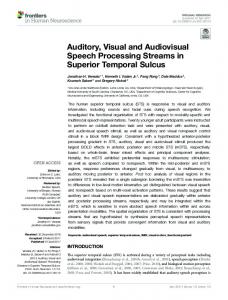
ultrasound acquisition of the tongue and video sequences of the lips as visual inputs of an artificial neural network and predict a relative robust LSF (Line Spectral Frequency) representation of voiced parts of speech. This envisioned ultrasound-based speech synthetiser could be helpful for patient having undergone a laryngectomy because it could provide an alternative to the tracheooesophageal speech. In [54], an approach based on visual speech recognition and concatenative synthesis driven by ultrasound and optical images of the voice organ is introduced. This system is based on the building of a one-hour audiovisual corpus of phonetic units, which associates visual features extracted from video to acoustic observations. Ultrasound and optical images are coded using a PCA-based approach similar to the EigenFaces approach described previously. As the visual and audio streams are synchronized, the initial phonetic segmentation of the video sequences can be obtained from the temporal boundaries of the phonemes in the audio signal. These labels are generated using speech forced alignment techniques. Then, HMM-based stochastic models trained on these visual features sequences are used to predict phonetic targets from video-only data. Finally, a Viterbi unit selection algorithm is used to find the optimal sequence of acoustic units given this phonetic prediction. The system is already able to perform phonetic transcription from visual speech data with over 50% correct recognition. Figure 17 presents an overview of this system and figure 18 shows a typical image of the database in which a lip profile image is embedded into the ultrasound image. The use of a large word dictionary and the introduction of a Language Model will help improving the rendered signal.
Fig. 17. Ouisper corpus-based synthesis system overview
Fig. 18. Example of an ultrasound vocal tract image with embedded lip profile
4.5
Speaker Indexing
One of the most promising on-going experiments concerns speaker indexing. The goal of this application is to answer automatically the question: Who is speaking in a video sequence ?, taking benefit from information extracted from the audio channel and from the video stream. This application is clearly audiovisual and is based on many of the tools detailed in the previous sections. First, faces are located within each frame of the considered video. Given a sliding temporal window, audio energy is computed. A visual feature vector is then attached to each pixel within the image (its values over time). The audio feature vectors are sampled to match with the frame rate and both vectors are σ − µ normalized. Correlations between all these vectors (the single audio vector and visual feature vectors attached to each pixel) are computed. The mean correlation is then computed for each detected face and the one with the greatest value is defined as locating the ‘current speaker’. First results are depicted in figure 19. While very simple, this first method has proven to perform quite well. Further experiments are under way, focusing especially on the choice of appropriate visual features. The idea would then be to fuse the obtained segmentation with face tracking/recognition and the speaker segmentation to obtain better results and to be able to extract voice-over speech segments.
5
Conclusion and Perspectives
Speech is not only an acoustic signal. It is produced by a speaker moving his articulators. The observation of these movements helps in all aspects of speech
Fig. 19. Some good localizations of the current speaker (green rectangles)
processing: coding, recognition, synthesis, . . . This chapter described a few ongoing experiments exploiting the correlation between acoustic and visual features of speech. It is demonstrated that the correlation of audio and visual information can be exploited usefully in many applications.
6
Aknowledgments
The research leading to this chapter was supported by the European Commission (K-SPACE, BioSecure, SecurePhone), by regional fundings (InfoM@gic), and by the Franco-Lebanese program CEDRE.
References 1. Chollet, G., Cernocky, J., Constantinescu, A., Deligne, S., Bimbot, F.: Towards ALISP: a Proposal for Automatic Language Independent Speech Processing. In: Computational Models of Speech Pattern Processing, NATO ASI Series, Series F: Computer and System Sciences. Volume 169. Springer Verlag (1999) 375–387 2. Bimbot, F., Chollet, G., Deleglise, P., Montaci´e, C.: Temporal Decomposition and Acoustic-Phonetic Decoding of Speech. In: IEEE International Conference on Acoustics, Speech and Signal Processing. (1988) 445–448 3. Gersho, A., Gray, R.: Vector Quantization and Signal Compression. Kluwer, Boston (1992) 4. Petrovska-Delacretaz, D., Chollet, G.: Searching Through a Speech Memory for Efficient Coding, Recognition and Synthesis. In: Festchrift for Prof. Dr J-P.Koester, A. Braun and H. Masthoff (eds.). Franz Steiner Verlag (2002) 453–464 5. Yang, M.H., Kriegman, D., Ahuja, N.: Detecting Faces in Images: a Survey. IEEE Transactions on Pattern Analysis and Machine Intelligence 24(1) (2002) 34–58 6. Viola, P.A., Jones, M.J.: Robust Real-Time Object Detection. International Journal of Computer Vision 57(2) (2002) 137–154 7. Fasel, I., Fortenberry, B., Movellan, J.: A Generative Framework for Real-Time Object Detection and Classification. Computer Vision and Image Understanding 98(1) (2004) 182–210 8. Santana, M.C., Navarro, J.L., Su´ arez, O.D., Martel, A.F.: Multiple Face Detection at Different Resolutions for Perceptual User Interfaces. In: 2nd Iberian Conference on Pattern Recognition and Image Analysis, Estoril, Portugal (June 2005)
9. Kass, M., Witkin, A., Terzopoulos, D.: Snakes: Active contour models. International Journal of Computer Vision 1(4) (1988) 321–331 10. Davis, S., Mermelstein, P.: Comparaison of Parametric Representations of Monosyllabic Word Recognition in Continuously Spoken Sentences. In: IEEE International Conference on Acoustics, Speech ans Signal Processing. (April 1980) 357–366 11. Hermansky, H.: Perceptual Linear Predictive (plp) Analysis of Speech. In: J. Acoust. Soc. America. Volume 87. (1990) 1738–1752 12. Lowe, D.: Distinctive Image Features from Scale-Invariant Keypoints. Int. Journal of Computer Vision 60(2) (2004) 91–110 13. Mikolajczyk, K., Schmid, C.: A Performance Evaluation of Local Descriptors. IEEE trans on Pattern Analysis and Machine Intelligence 27(10) (2005) 14. Witkin, A.: Scale-Space Filtering. In: Proceedings of the 8th International Joint Conference on Artificial Intelligence. (1983) 1019–1022 15. Koenderink, J.: The Structure of Images. Biological Cybernetics 50 (1984) 363–370 16. Turk, M., Pentland, A.: Eigenfaces for Recognition. Journal of Cognitive Neuroscience 3(1) (1991) 71 – 86 17. Kittler, J., Hatef, M., Duin, R., Matas, J.: On combining classifiers. IEEE Trans. Pattern Anal. Mach. Intell. 20(3) (1998) 226–239 18. Dol´edec, S., Chessel, D.: Co-Inertia Analysis: an Alternative Method for Studying Species-Environment Relationships. Freshwater Biology 31 (1994) 277–294 19. Reynolds, D., Quatieri, T., Dunn, R.: Speaker Verification Using Adapted Gaussian Mixture Models. Digital Signal Processing (10) (2000) 19–41 20. Mokbel, C.: Online Adaptation of HMMs to Real-Life Conditions: A Unified Framework. IEEE Trans. On Speech and Audio Processing 9(4) (2001) 342–357 21. Rabiner, L.: A Tutorial on Hidden Markov Models and Selected Applications in Speech Recognition. Proceedings of the IEEE 77(2) (1989) 257–286 22. Potamianos, G., Neti, C., Luettin, J., Matthews, I.: Audio-Visual Automatic Speech Recognition: An Overview. In Bailly, G., Vatikiotis-Bateson, E., Perrier, P., eds.: Issues in Visual and Audio-Visual Speech Processing. MIT Press (2004) 23. Argones-R´ ua, E., Garc´ıa-Mateo, C., Bredin, H., Chollet, G.: Aliveness Detection using Coupled Hidden Markov Models. In: First Spanish Workshop on Biometrics (SWB’07), Girona, Spain (June 2007) 24. Brand, M., Oliver, N., Pentland, A.: Coupled hidden markov models for complex action recognition. (1996) 25. Misra, H.: Multi-stream processing for noise robust speech recognition. PhD thesis, Lausanne (2006) 26. Bailly-Bailli`ere, E., Bengio, S., Bimbot, F., Hamouz, M., Kittler, J., Mari´ethoz, J., Matas, J., Messer, K., Popovici, V., Por´ee, F., Ruiz, B., Thiran, J.P.: The BANCA Database and Evaluation Protocol. In: Lecture Notes in Computer Science. Volume 2688. (January 2003) 625–638 27. Hazen, T.: Visual Model Structures and Synchrony Constraints for Audio-Visual Speech Recognition. IEEE Transactions on Audio, Speech and Language Processing 14(3) (2006) 28. Dupont, S., Luettin, J.: Audio-Visual Speech Modeling for Continuous Speech Recognition. IEEE Transcations on Multimedia 2(3) (2000) 29. Potamianos, G., Neti, C., Gravier, G., Garg, A., Senior, A.: Recent Advances in the Automatic Recognition of Audiovisual Speech. IEEE 91(9) (2003) 30. Chu, S., Huang, T.: Audio Visual Speech Modelling using Coupled Hidden Markov Models. In: IEEE International Conference on Acoustics, Speech and Signal Processing. (2002) 2009–2012
31. Nakamura, S.: Statistical Multimodal Integration for Audio-Visual Speech Processing. IEEE Transactions on Neural Networks 13(4) (2002) 854–866 32. Brugger, F., Zouari, L., Bredin, H., Amehraye, A., Chollet, G., Pastor, D., Ni, Y.: Reconnaissance Audio-Visuelle de la Parole par VMike. In: XXVI`eme Journ´es ´ d’Etude sur la Parole (JEP’06), Dinard, France (June 2006) 417–420 33. The NoiseX Database: http://spib.rice.edu/spib 34. Young, S., Evermann, G., Kershaw, D., Moore, G., Odell, J., Ollason, D., Povey, D., Valtchev, V., Woodland, P.: The HTK Book (for HTK Version 3.2). Cambridge University Engineering Department. (December 2002) 35. Ross, A.A., Nandakumar, K., Jain, A.K.: Handbook of Multibiometrics. Springer (2006) 36. Scott, G., Longuet-Higgins, H.: An Algorithm for Associating the Features of Two Images. Proc. of the Royal Society of London. Series B. Biological Sciences 244(1309) (1991) 21–26 37. Pilu, M.: Uncalibrated Stereo Correspondence by Singular Value Decomposition. Technical Report HPL-97-96, Digital Media Department HP Laboratories (1997) 38. Delponte, E., Isgr, F., Odone, F., Verri, A.: SVD-Matching using SIFT Features. In: Proc. of the Int. Conf. on Vision, Video and Graphics. (2005) 125–132 39. Bicego, M., Lagorio, A., Grosso, E., Tistarelli, M.: On the Use of SIFT Features for Face Authentication. In: Conf. on Computer Vision and Pattern Recognition Workshop (CVPRW). (2006) 40. Ullman, S.: The Interpretation of Visual Motion. MIT Press, Cambridge, MA (1979) 41. Golub, G., Loan, C.V.: Matrix Computations 3rd Edition. The Johns Hopkins University Press (1996) 42. Pilu, M.: A Direct Method for Stereo Correspondence based on Singular Value Decomposition. In: Proceedings of CVPR. (1997) 261–266 43. Bredin, H., Miguel, A., Witten, I.H., Chollet, G.: Detecting Replay Attacks in Audiovisual Identity Verification. In: 31st IEEE International Conference on Acoustics, Speech, and Signal Processing (ICASSP’06). Volume 1., Toulouse, France (May 2006) 621–624 44. Abe, M., Nakamura, S., Shikano, K., Kuwabara, H.: Voice Conversion through Vector Quantization. In: International Conference on Acoustics, Speech and Signal Processing. (1988) 45. Capp´e, O., Stylianou, Y., Moulines, E.: Statistical Methods for Voice Quality Transformation. In: EUROSPEECH. (1995) 46. Sundermann, D., Hge, H., Bonafonte, A., Ney, H., Black, A., Narayanan, S.: TextIndependent Voice Conversion Based on Unit Selection. In: International Conference on Acoustics, Speech and Signal Processing, Toulouse, France (2006) 47. Genoud, D., Chollet, G. In: Voice Transformations: Some Tools for the Imposture of Speaker Verification Systems. Franz Steiner Verlag (1999) 375–387 48. Stylianou, Y., Capp´e, O.: A System for Voice Conversion Based on Probabilistic Classification and a Harmonic Plus Noise Model. In: International Conference on Acoustics, Speech and Signal Processing. (1998) 49. Valbret, H., Moulines, E., Tubach, J.: Voice Transformation Using TDPSOLA Technique. In: International Conference on Acoustics, Speech and Signal Processing. (1992) 50. Perrot, P., Aversano, G., Blouet, R., Charbit, M., Chollet, G.: Voice Forgery using ALISP. In: International Conference on Acoustics, Speech and Signal Processing. (2005)
51. Jou, S.C.S., Schultz, T., Waibel, A.: Continuous Electromyographic Speech Recognition with a Multi-Stream Decoding Architecture. In: International Conference on Communication Audio and Speech Processing, Honolulu, Hawaii (April 2007) 52. Heracleous, P., Nakajima, Y., Saruwatari, H., Shikano, K.: A Tissue-Conductive Acoustic Sensor Applied in Speech Recognition for Privacy. In: sOc-EUSAI ’05: Proceedings of the 2005 joint conference on Smart objects and ambient intelligence, New York, NY, USA, ACM Press (2005) 93–97 53. Denby, B., Oussar, Y., Dreyfus, G., Stone, M.: Prospect for a Silent Speech Interface Using Ultrasound Imaging. In: International Conference on Acoustics, Speech and Signal Processing, Toulouse, France (2006) 54. Hueber, T., Chollet, C., Denby, B., Stone, M., Zouari, L.: Ouisper : Corpus Based Synthesis Driven by Articulatory Data. In: International Conference on Phonetic Science. (2007) to appear