Published as M.C. Paulk, âSome Explanatory Factors for Software Quality,â Third ...... Lynne B. Hare, Roger W. Hoerl, John D. Hromi, and Ronald D. Snee, âThe ...
Some Explanatory Factors for Software Quality Mark C. Paulk, Carnegie Mellon University
Abstract Even in a world of agile methods and Internet-time processes, quality is a crucial attribute of software. A number of explanatory factors for software quality have been proposed, but the empirical evidence on the effect of these factors has been mixed. One reason for the mixed evidence is that surrogates are frequently used that capture the desired factor poorly. For example, it is widely agreed that the competence of the people doing the work is fundamental to the quality of the work done. How does one measure competence? Even if we agree that surrogates such as years of experience are inadequate, better measures may not be readily available. After reviewing the evidence supporting various proposed factors, data from the Personal Software Process (PSP) is analyzed to see what the impact of some of those factors is on software quality as measured by defects found in testing. The factors considered include process factors, such as design time, and non-process factors, such as programming language. Arguably the most important factor to be considered is the competence of the people doing the work, and a number of surrogates are considered. One of the greatest challenges in empirical software engineering is the variability associated with individual differences, and the PSP data shows that, even though performance improves and variability decreases as disciplined processes are instilled, the dominant factor in superior performance remains the competence of the individual professional. The paper closes with a discussion of the issues associated with generalizing from PSP data to an industry environment, since PSP assignments are “toy problems” compared to the complex systems commonly demanded today. . Published as M.C. Paulk, “Some Explanatory Factors for Software Quality,” Third International Conference on Software Quality, Dallas, October 2003.
1
Introduction It is generally acknowledged that there are three conditions expected before designintensive processes can be seriously considered for statistical control: best practices, discipline, and teamwork. Software engineering that uses “best practices” supports repeatable performance [Fagan, 1986]. Less effective practices generally increase variation. A disciplined process with consistent performance will have less variability than an ad hoc process [Hayes, 1997; Wesslen, 2000]. Inconsistently performed processes are by definition unstable. An effective team will demonstrate less variability than that shown by individuals [Hare, 1995]. Teams can be much more effective than individuals for doing software development and maintenance. Sociological factors are as important as technological and process factors in building high-quality software. The three supports for quality in the software world are sometimes expressed as people, technology, and procedures; “process” is the framework that integrates these three supports as “the way software is built” in an organization. The most advanced software organizations, however, are only beginning to apply quality management concepts that have been well-known in manufacturing for decades, and the preferred quantitative techniques remain sharply debated. The purpose of this paper is to consider some of the factors affecting software quality using data from the Personal Software ProcessSM (PSPSM). “Software quality” is an ambiguous term – for this research, defect density in testing will be used as a surrogate for the general topic. The initial results reported here are part of a larger investigation into the factors that affect variation with respect to software quality. In analyzing software quality for PSP, defect density in testing will be the surrogate measure for quality. The number of defects found in testing is an alternative surrogate, which some prefer. Defect density was selected for this analysis because: 1. The area of opportunity for injecting defects as measured by program size, even for the relatively simple PSP assignments, varies significantly. 2. Defect density is the most commonly used quality surrogate. 3. Comparing the results for defect density and number of defects in the following analyses led to no additional insights or significant differences in the results. Defects found in compile could be grouped with those found in testing since the compiler is being used to detect syntactic defects that escaped from coding, but the average effort per defect found in testing is more than five times greater than that per defect found in compile (e.g., 23.3 minutes / defect in testing versus 4.3 minutes / defect in compile). Given the magnitude of the difference in effort, defect density in testing appears to be a reasonable quality surrogate. While quality as perceived in terms of reliability by the customer may be quite different from that observed in testing in terms of defects, when PSP or TSP are applied to industry projects, very few to no defects, or the associated failures, are typically reported in the field.
2
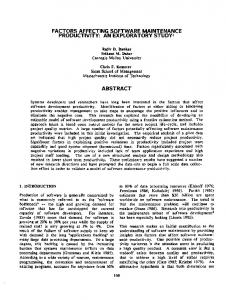
The Personal Software Process The Personal Software Process (PSP) is taught as a one-semester university course at several universities or as a multi-week industry training course. It typically involves the development of ten programs, using increasingly sophisticated processes. The life cycle processes for PSP are planning, design, coding, compiling, testing, and a post-mortem activity for learning. The primary development processes are design and coding, since there is no requirements analysis step. PSP is a measurement-driven approach, where the student’s own data drives the learning process as incrementally more powerful processes are adopted. Design and code reviews are introduced in assignment 7; design templates are introduced in assignment 9. Design and code reviews are personal reviews conducted by an engineer on his or her own design or code, and they are designed to help engineers achieve 100% yield: all defects removed before compiling the program. The design templates are for functional specifications, state specifications, logic specifications, and operational scenarios. The PSP dataset used in this analysis is from PSP classes taught between 1995 and 2001 by authorized PSP instructors using the PSP textbook and materials [Humphrey, 1995]. As can be observed in Figure 1, software quality improves over the course of PSP, in terms of both decreased variance and lower averages, as reported in earlier studies [Hayes, 1997; Wesslen, 2000]. Reported differences, using repeated measures ANOVA, range from 1.7X to 2.5X of the median initial value.
DD in Testing (defects/KLOC)
200
150
100
50
0 1
2
3
4
5
6
7
8
9
10
Assignment
Figure 1. Trends in Defect Density in Testing Across PSP Assignments.
3
The PSP Data PSP data comes from a thoroughly instrumented process that explicitly emphasizes disciplined engineering practice. To the degree that good engineering practice is not followed, it should be obvious in the data. Learning curve effects, arguably as part of continual improvement, are observed in projects after the PSP class [Humphrey, 2000; Kamatar, 2000]. There are several advantages to using PSP data. First, disciplined processes are followed in the ending assignments, 7A to 10A. Second, many potential explanatory variables, such as those associated with teams or requirements volatility, that might confound the analysis can be eliminated from consideration. Third, a reasonably comprehensive, detailed, and large data set is available from PSP classes since 1993. One set of PSP data, covering PSP classes from 1993 to 1996, was used in initially analyzing the results of PSP. This first data set, labeled PSP1997 for the 1997 report, contains data for 2,365 assignments and 298 students. A second PSP data set covers PSP classes from 1994 to 2001. This PSP2001 data set contains data for 10,347 assignments and 1,345 students. For the PSP2001 data set, internal data consistency errors were identified for 2.8% of the reported data, which was discarded. Data is available for 112 classes with 1,345 students providing data from 10,242 assignments where a program was successfully completed. Inconsistencies between the total number of defects injected and removed resulted in the removal of 264 tuples. For 21 data tuples, more defects were found in the design review than had been injected by that point in the process, and, for 4 data tuples, more defects were found in the code review than had been injected by that point in the process. Data errors were identified in 289 of 10,242 data tuples, leaving 9,953 for analysis in the PSP2001 data set. For the PSP1997 data set, errors were identified for 4.4% of the reported data, which was discarded. Data is available for 23 classes with 298 students providing data from 2,365 assignments where a program was successfully completed. In addition to internal consistency errors, two of the classes did not follow the standard ten programming assignments, therefore 299 data tuples were removed, leaving 21 classes. Inconsistencies between the total number of defects injected and removed resulted in the removal of 86 data tuples. For 4 data tuples, more defects were found in the design review than had been injected by that point in the process, but no data tuples were removed because of more defects being found in the code review than had been injected by that point in the process. Data errors were identified in 390 of 2,365 data tuples, leaving 1,975 for analysis in the PSP1997 data set. A similar data cleanup was performed for the Hayes and Over study, but since repeated measures ANOVA was the primary analytic tool, an additional requirement was added that data be reported for all of the first nine assignments (assignment 10 was not used),(i) with the result that data from 181 of the 298 students was usable.(ii)
4
Concerns About Generalizability There are several concerns in using the PSP data, which are summarized in Table 12. These concerns can be summarized as limitations on the generalizability of analyses based on classroom data, which cannot be assumed to extrapolate to industrial settings, although doing so is a common practice. Subsequent analyses of TSP and CMM high maturity project data should mitigate these concerns but do not remove them since the project data available does not permit the same depth of analysis. Table 1 Issues That May Limit the Generalizability of PSP Analyses Descriptor
Issue in Analyzing PSP Data
Classroom measures
Potential explanatory variables that are eliminated from consideration by virtue of the data being classroom data may be significant in an industrial environment. Examples include variables associated with teamwork or larger systems.
The people who take the PSP course, or who choose to work in high Disciplined professionals maturity organizations, may not be typical of most software professionals. A corollary is that people who finish the PSP course may differ from those who begin the class but do not finish. Small programs
The systems built in real-world software projects are much larger than PSP assignments. For industrial projects, a design module may correspond to several code modules, since design is a higher level of abstraction than code. Similarly, a code module may consist of several procedures or subroutines, which may be independently reviewed. For PSP, however, data collection is at the level of the assignment rather than the module.
Programmer differences
The surrogates, e.g., years of programming experience, available for testing the competence of programmers, while frequently used, are known to be inadequate.(iii) Programmer ability, as empirically observed in the PSP context, addresses this concern for this research, but using process and defect data to characterize the ability of programmers in an industry setting can drive dysfunctional behavior, such as data falsification or inappropriate emphases, e.g., maximizing “productivity” at the expense of defects.
Missing data
Some contextual information, such as programming language used and years of programming experience, was not consistently recorded in the PSP repository, therefore fewer data points are available for analyzing explanatory variables. The number of data points in the PSP2001 data set is sufficient for the selected data splits to have adequate statistical significance and power.
5
Descriptor
Issue in Analyzing PSP Data
Instructor differences
There could be differences between classes due to the ability of the instructors. This should not be significant since the classes were taught by SEI-authorized instructors who have been through the PSP instructor training and classes are typically co-taught by two to three instructors.
PSP data captures time spent, defects injected, and defects removed No requirements in each PSP phase (or activity): planning, design, design reviews, coding, code reviews, compiling, testing, and postmortem. In PSP phase there is no requirements elicitation or analysis phase since the assignments are relatively straightforward; misunderstandings of the requirements are captured in the design, code, and test activities.
Potential Explanatory Variables A number of defect prediction models have been built by various researchers, based on lines of code, number of decisions, number of subroutine calls, code segments, Halstead volume, McCabe cyclomatic complexity, and other measures. These variables tend to be highly correlated. In Lipow’s model, the coefficients are language-dependent factors. Gaffney’s model is a variant of Lipow’s that assumes programming language is not a significant factor. Criscione, Ferree, and Porter’s model uses data from previous phases in the product’s life cycle to estimate test defects: summing the sizes of various work product times times empirical defect density.(iv) Their model depends on a stable development and testing environment,(v) similar to the assumption in this research of having a mature software process. Defect prediction models based on simple measures of size and complexity do not consider the difficulty of the problem, the complexity of the proposed solution, the skill of the programmer, or the software engineering techniques used.(vi) Multivariate analyses, such as factor analysis, may generate synthetic metrics that combine a number of different measures, such as lines of code and complexity, to avoid multicollinearity, but the practical application of the synthetic metric may be obscure. One of the more detailed defect prediction models is the COnstructive QUALity MOdel (COQUALMO), which has defect injection and removal submodels that incorporate 21 of the COCOMO II cost drivers, with the exception of development flexibility.(vii) COCOMO II has 17 multiplicative cost drivers (or effort multipliers), which are grouped into four categories, and five scaling cost drivers, as listed in Table 6.(viii) Each cost driver can accept one of six possible qualitative ratings, ranging from very low to extra high.
6
Table 2 COCOMO II and COQUALMO Drivers COCOMO II Categories
Product factors
Platform factors
Personnel factors
Project factors
Scaling cost drivers
COCOMO II and COQUALMO Drivers
Required software reliability Data base size Product complexity Required reusability Documentation match to life cycle needs Execution time constraint Main storage constraint Platform volatility Analyst capability Programmer capability Applications experience Platform experience Language and tool experience Personnel continuity Use of software tools Multi-site development Required development schedule Precedentedness Development flexibility (not in COQUALMO) Architecture and risk resolution Team cohesion Process maturity
Comparisons of different defect prediction models suggest that different models are best for different environments; it is not possible to find a single superior model.(ix) Process discipline, in terms of consistently following good practices, is only one of the factors that affect productivity and quality. Although process and non-process contributors to software quality can be separated, relationships between variables can be expected, e.g., capable programmers tend to consistently use effective techniques and tools. The potential explanatory variables for software quality are identified based on the drivers in COQUALMO, empirical observations about software defects, and the available data from the PSP course. Some factors change systematically across PSP assignments as part of the teaching process, but many of the possible explanatory variables can be assumed to be constant within a PSP class (or within a project or team) and can therefore be ignored in this analysis. The following factors from COQUALMO are not expected to change significantly within any of the PSP data sets used: applications experience, architecture and risk resolution, application domain complexity, customer information, data base size, documentation match to life cycle needs, execution time constraint, language and tool experience, main storage constraint, multi-site development, personnel continuity, platform experience,
7
platform volatility, precedentedness, product complexity, required development schedule, required reusability, and required software reliability. Significant shifts in any of these factors should proactively managed by a software project but are outside the scope of this research. Although complexity measures such as McCabe’s cyclomatic complexity are frequently used in reliability models, they are highly correlated to LOC(x) and are not measured in PSP, therefore they will not be considered in this analysis. Problem complexity would not appear to be a significant factor in PSP, given the relative simplicity of the assignments. Programs smaller than 10 KLOC are usually considered simple programs, between 10 and 100 KLOC are considered of medium complexity, and programs larger than 100 KLOC are considered relatively complex. Models frequently shift, even to different formulations, around these boundaries.(xi) Seven of the assignments are numerical analysis programs. Assignments 2 and 3 are text processing problems, which in conjunction with learning curve effects for the students who have done little recent programming, probably contributes to the increase in defect density in testing for those assignments. Assignment 8 is a sorting problem, and quality appears consistent with the numerical analysis problems. Because of the learning curve effects intrinsic to the PSP course, many of these analyses will focus on assignments 9 and 10. These two assignments incorporate design techniques and reviews that are potentially best practices in good software engineering. In principle, they represent a disciplined process employing a reasonable set of software techniques and tools. Assignments 9 and 10 can be separately analyzed to provide a split data set; to the degree significant learning curve effects remain in PSP between these two assignments, this may be desirable anyway. Solution complexity, or product complexity, is not constrained, and can be a significant source of variation.(xii) A student’s preferred style in optimizing memory space, speed, reliability (e.g., exception handlers), generality, reuse, etc., can lead to radically different solution complexities. Since PSP does not impose any performance requirements, students have significant latitude in how they solve the problems; a latitude available in many industry contexts as well. Solution complexity can be measured by program size. The use of defect density should normalize out solution complexity differences, although a non-linear relationship between size and defects is a concern. Within the realm of the simple PSP assignments, this non-linearity is unlikely to be practically significant. Programmer/analyst capability is difficult to objectively determine. Factors such as highest degree attained and number of years of programming experience are flawed surrogates for programmer capability. Breadth of experience is usually considered a superior indicator of competence, and the number of languages known by the programmer is a plausible surrogate.(xiii) Percent of time programming in previous year may indicate the steepness of the learning curve for students for the early assignments, and correlate with applications experience and language and tool experience, but should not be a concern by the time of assignments 9 and 10. Software developer experience with techniques may be an issue as the PSP design techniques are introduced. Untangling
8
the effect of experience in general and experience with specific techniques and tools can be challenging, but the data available provides a direct measure of general experience and specific experience issues associated with learning should be indicated by differences between assignments 9 and 10 Team composition is not a consideration when analyzing the PSP data, but the increase in performance and decrease in variation associated with effective teams will be analyzed in the context of TSP and CMM high maturity project data in later analyses. Process maturity is “very high” for CMM Level 4 and “extra high” for CMM Level 5,(xiv) therefore maturity should not be a significant factor in the analysis of data from mature processes. One of the objectives of this research, however, is to independently measure those aspects of the software process, e.g., review rates, that objectively define what “process maturity” is, i.e., the consistent execution of good engineering practices. It is interesting to note that in COQUALMO, process maturity has the highest impact of all factors on defect injection.(xv) The specific hypotheses regarding primary variables for process discipline and individual differences to be investigated in this analysis are listed in Table xxx. Before exploring these primary variables, however, it is desirable to investigate a number of control variables that could confound the analyses if not appropriately addressed. These hypotheses will be considered statistically significant for α < 0.05. Since differences between individuals can contribute over half of the variance in performance,(xvi) the values of the coefficient of determination, R2, are likely to be small for any specific explanatory variable except programmer ability, and a statistically significant explanatory variable with R2 > 0.05 will be considered a potentially useful addition to a defect prediction model. The focus of this first analysis is identifying which explanatory variables are worthy of further consideration and exploration. Later analyses will consider data transformations and correlations that may improve the insight afforded by those variables deemed worthy of further pursuit.
Analyzing the Control Variables The primary variables in this analysis center on processes and individual variation, but a number of control variables must be considered, which are listed in Table 14.(xvii) The empirical evidence regarding the impact of these control variables on software quality is mixed.(xviii) Table 3 PSP Control Variables for Software Quality Explanatory Category
Factor Affecting Software Quality
Hypotheses for Control Variables
People
Learning curve There is a difference in defect density in testing between assignments 9 and 10. effects
9
Explanatory Category
Factor Affecting Software Quality
Hypotheses for Control Variables
Programmer differences
There is a difference in defect density in testing between the students who finish all ten PSP assignments and those who do not.
Instructor differences
There is a difference in defect density in testing between the PSP classes.
Credentials
Highest degree attained is related to defect density in testing.
Experience
Years of experience is related to defect density in testing.
Recent experience
Percent of time programming in previous year is related to defect density in testing.
Breadth of experience
Number of programming languages known is related to defect density in testing.
Technology Language
Programming language used is related to defect density in testing.
Application LOC domain
Program size is related to defect density in testing.
As is apparent in Figure 2, and reported in various studies of PSP, there are consistent, statistically significant changes in defect density in testing across assignments. Even when the focus of these analyses is on assignments 9 and 10 to minimize the effects of process changes and learning, if learning curve effects between these two assignments are significant, then the data may need to be split by assignment. As is clear from the comparison circles in Figure 4, there are significant differences between assignments 9 and 10. The analysis results confirm that there is a consistent, statistically significant difference between assignments 9 and 10 for defect density in testing, as shown in Table 15. The data sets will be split by assignment where appropriate in subsequent analyses.
10
Table 4 ANOVA Statistics for Assignment 9 Versus Assignment 10 Data Set
Levene Test (variance)
ANOVA Test Selected
p-value (means)
Power
PSP2001, 9A & 10A