Fu, Chen, and Shi quires simulation to estimate for a given value of s and q. Approaches towards simulation optimization include the following: ⢠sample path ...
Proceedings of the 2008 Winter Simulation Conference S. J. Mason, R. R. Hill, L. Mönch, O. Rose, T. Jefferson, J. W. Fowler eds.
SOME TOPICS FOR SIMULATION OPTIMIZATION
Michael C. Fu
Chun-Hung Chen
Robert H. Smith School of Business University of Maryland College Park, MD 20742, U.S.A.
Department of Systems Engineering & Operations Research George Mason University Fairfax, VA 22030, U.S.A. Leyuan Shi
Industrial and Systems Engineering Department University of Wisconsin Madison, WI 53706, U.S.A.
ABSTRACT
of the most well-known approaches, providing some of the key references that the reader can consult for more details. The rest of the tutorial provides more in-depth description of three specific areas: the optimal computing budget allocation (OCBA) approach, stochastic gradient estimation techniques, and the nested partitions (NP) method. The key difficulty in simulation optimization involves a trade-off between allocating computational resources for searching the solution space versus conducting additional simulation replications for better estimating the performance of current promising solutions. The searching aspect can involve algorithmic computation, as well as simulation computation for estimating the new candidate solutions. So application of randomized search algorithms in the simulation optimization setting involves two types of sampling: sampling the solution space and sampling the sample path (stochastic simulation) space. The fundamental tradeoff between search and estimation becomes especially pronounced when the cost of simulation is expensive, For example, one simulation replication of a complex semiconductor fab for a month of operations might take as long to run as solving a large linear programming (LP) problem. With millions of random variables generated in the stochastic simulation, a mathematical programming model formulation with millions of decision variables and an objective function involving a quantity that must be estimated using the simulation quickly leads to intractability. We end this section with a disclaimer note. Much of this material is similar to that presented in Chen, Fu, and Shi (2008), and portions of that paper are repeated here (sometimes verbatim) without explicit attribution.
We give a tutorial introduction to simulation optimization. We begin by classifying the problem setting according to the decision variables and constraints, putting the setting in the simulation context, and then summarize the main approaches to simulation optimization. We then discuss three topics in more depth: optimal computing budget allocation, stochastic gradient estimation, and the nested partitions method. We conclude by briefly discussing some related research and currently available simulation optimization software. 1
INTRODUCTION
Mathematical programming models can routinely involve millions of decision variables and constraints. Similarly, simulation models routinely utilize the generation of millions of random variates. However, the combination of these two arguably most used operations research (OR) tools on this scale is not yet achievable (Fu 2007). So one either has a large-scale simulation model with relatively few (perhaps just a handful of) decision variables or a huge mathematical programming model with a relatively small number of random variables (or scenarios) over a couple of recourse stages. Furthermore, as discussed in Fu (2002), there seems to be a gap between academic theory and commercial practice, especially in software implementations of “optimization” approaches. In this tutorial, we provide an overview of various aspects of simulation optimization. We begin with a classification of problem settings, and then provide an overview
978-1-4244-2708-6/08/$25.00 ©2008 IEEE
27
Fu, Chen, and Shi 2
PROBLEM SETTING & OVERVIEW
ordering, subject to a service level constraint involving inventory shortages. We will adopt the first formulation for simplicity, and also define q = S − s to use in place of S as one of the decision variables. Thus, in the framework of above, we have θ = (s, q), Θ = ℜ+ × ℜ+ and J(s, q) is the sum of holding costs, backlogging or lost sales costs, and ordering costs (which includes a fixed set-up cost and a per-unit cost). Under certain conditions, it is well known that an (s, S) policy is optimal, but even in cases where such a policy is not guaranteed to be optimal, one might adopt an (s, S) policy for its simplicity in implementation, and the optimization would be over all policies of that form. In certain simplified settings, an analytical form for J can be derived, and the optimal (s, q) values obtained analytically in closed form. Sometimes to test a simulation optimization algorithm, such a simplified setting is also considered to compare the convergence speed of the algorithm to the known true optimum. However, in more general settings, the costs can only be estimated via simulation. A rough classification of simulation optimization problems can be based on the form of Θ. First, one could distinguish between continuous variable optimization problems and discrete variable (e.g., combinatorial, including binary) optimization problems. The latter could also be divided into categories where the solution space is finite and small, finite and large, or (countably) infinite. In the first of these cases, if it were a deterministic optimization problem, then enumeration would be an easy and obvious solution approach. However, in the simulation setting, even enumeration is not straightforward, as there is still the estimation aspect which leads to the question of how to allocate simulation replications among the feasible solutions. One approach for treating this setting is presented in the next section. Next, Θ itself could be defined either explicitly or implicitly, and deterministically or probabilistically. What we mean by explicit and implicit here is non-standard, but it refers to the variables being constrained independently, as in Θ = ℜ+ × ℜ+ versus what would have been the case had we used s and S as the decision variables, since in that case, we would have the constraint S ≥ s, putting a dependence between the two decision variables, whereas s and q have no such dependence. Typical mathematical programming problems have both of these types of constraints, though the distinction is usually not made. For randomized search algorithms, however, there is an implication in terms of generating components of θ independently or in a possibly correlated fashion. Both of these types of constraints, however, define known deterministic domains for the decision variables, whereas if we consider the setting of a service level constraint in the (s, S) inventory example, then Θ itself would not even be known a priori, but would be implicitly estimated based on simulation, e.g., Θ = {(s, q) : P(stockout) < 0.05)}, where P(stockout) re-
The general problem setting is as follows: min J(θ ), θ ∈Θ
(1)
where θ is a p-dimensional vector of all the decision variables and Θ is the feasible region. This general formulation subsumes the usual mathematical programming settings (which prefers x to θ for its decision variables): •
•
J(θ ) is linear in θ and Θ can be expressed as a set of linear equations in θ corresponds to linear programming, or mixed integer linear programming if part of the Θ space involves an integer (e.g., {0, 1} binary) constraint. J(θ ) is convex in θ and Θ is a convex set corresponds to a convex optimization problem.
Our setting, however, presupposes that we have little knowledge on the structure of J (such as linearity or convexity), and moreover that J cannot be obtained directly, but rather is an expectation of another quantity L(θ , ω), to which we have access, i.e., J(θ ) = E[L(θ , ω)], where ω comprises the randomness (or uncertainty) in the system. In our setting, ω represents a simulation replication, and L(θ , ω) is a sample performance estimate obtained from the output of the simulation replication, e.g., the number of customers who waited more than a certain amount of time in a queueing system, or average costs in an inventory control system, or the profit and loss distribution in an investment portfolio or risk management strategy. Most performance measures of interest can be put into this general form, including probabilities by using indicator functions. However, quantiles are an example that cannot be put into this form. The prototypical example we will use for illustrative purposes in this tutorial is a single-item (s, S) inventory control problem. Clearly, this example could easily be extended to more realistic systems that include many items and complicated relationships in terms of demand and ordering costs. Recall that under an (s, S) inventory control policy, when the inventory position (which includes inventory on hand plus that on order) falls below s at an order decision point (discrete points in time in a periodic review setting and any point in time in a continuous review setting), then an order is placed in the amount that would bring the inventory position up to S. The usual performance measure of interest involves costs assessed for excess inventory, inventory shortages, and item ordering. Alternatively, the problem can be formulated with costs on excess inventory and item
28
Fu, Chen, and Shi quires simulation to estimate for a given value of s and q. Approaches towards simulation optimization include the following: •
•
•
•
Over the past decade, all of the commercial simulation software vendors have begun offering an “optimization” module as an option. Most of the algorithms in these modules are based on the fourth approach, employing metaheuristics on the estimated performance, and thus have little in the way of probabilistic or statistical guarantees (Fu 2002), although more recently some statistical ranking & selection ideas have begun to be applied in order to be able to say something about the goodness of the solutions obtained. Many commercial simulation software vendors offer a call center simulation. Using queueing models (Whitt 2007), one could optimize staffing levels, and then use simulation to test the performance and tune the decision variables and/or optimize other decision variables. At this time, however, as far as we are aware, none of the commercial software for simulation optimization has implemented any efficient gradient search, which would require integration between the simulation model and the optimization routine. The following three sections outline in more detail three different approaches or methodologies that attack the problem of simulation optimization from completely different aspects. The first approach can be viewed as one methodology in the general research area of statistical ranking and selection. The objective is simply to pick the best among a fixed set of alternatives, where all alternatives will be tested, so the number of choices has to be relatively small. In the context of simulation optimization, the difficulty of search has been removed, so the focus is on efficiently allocating simulation replications among the alternatives. Following that is the section on stochastic gradient estimation, where both indirect “black box” techniques and more efficient direct estimation methods are described. Then we consider a global optimization approach called the nested partitions method, which can be applied to both deterministic and stochastic optimization problems. In terms of our earlier classification, the three methodologies discussed in more detail in the following sections attack the following cases:
sample path optimization, also known as sample average approximation — the main idea is to take a large enough set of samples so that the stochastic problem is basically turned back into a deterministic problem to which the tools of nonlinear programming (or possibly convex optimization) could be applied; in finance settings, this approach is sometimes referred to as “freezing all the random numbers,” which typically could easily go into the millions or even billions; “convergence” is in terms of increasing the number of samples taken; for more details, see Rubinstein and Shapiro (1993), Homem-de-Mello, Shapiro, and Spearman (1999), Kleywegt, Shapiro, and Homem-de-Mello (2001); sequential response surface methodology — iterative algorithms using statistical methods, primarily regression, in order to improve upon the candidate solution by searching the feasible solution space; there is also a non-sequential metamodel version, as well; for more details and recent developments, see Barton and Meckesheimer (2006) and Kleijnen (2008); stochastic approximation — iterative algorithms that mimic gradient methods in deterministic (nonlinear) optimization; such algorithms have provably convergent asymptotic (in the number of iterations) properties under suitable conditions; a comprehensive reference is Kushner and Yin (2003); deterministic metaheuristics — broad category including approaches such as genetic algorithms, tabu search, scatter search, Nelder-Mead iteration, and other iterative and possibly population-based (evolutionary) algorithms from deterministic (nonlinear) optimization; there is little probabilistic or statistical consideration incorporated; for more de´ tails in the simulation setting, see Olafsson (2006).
• • •
More details on these techniques can be found in other simulation optimization surveys (Fu 1994a, Fu 2002, Fu 2006, Andrad´ottir 1998, Andrad´ottir 2006). The first three of these approaches benefit from the availability of gradient estimates. In the sequential response surface methodology approach, the gradient is obtained via (linear or quadratic) regression. In the other two cases, there are different techniques depending on how much knowledge one has about the system of interest, from “black box” approaches to exploitation of the dynamics of the system. Stochastic gradient estimation is discussed further in Section 4.
Θ is finite (and relatively small). Θ is a continuous space (subset of ℜ p ). Θ can be continuous or discrete, possibly defined implicitly and probabilistically.
3 OPTIMAL COMPUTING BUDGET ALLOCATION When Θ is finite and small enough, enumeration can be used in principle to find the optimum, but in the simulation optimization setting, the value of the objective function is obtained through simulation, so the main question is how to allocate the simulation replications efficiently among the various alternative candidate solutions. This is a classical problem in statistical ranking and selection (see, e.g.,
29
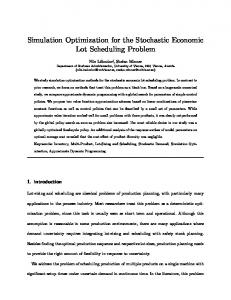
Fu, Chen, and Shi (Bechhofer, Santner, and Goldsman 1995), (Kim and Nelson 2006)). One direct and intuitive approach is to gradually increase the computing budget (i.e., the number of simulation replications) for each alternative solution until the variance of the estimated performance is sufficiently small (i.e., the confidence interval for estimation is satisfactorily narrow). The simplest allocation is to use an identical number of replications for each alternative – called the “total equal allocation” (TEA), which can be inefficient. For example, if one alternative has very low variance, then it may only require one or two simulation replications to estimate its performance; thus, it seems sensible that the number of total replications allocated to an alternative increase with increasing (estimated) variance. On the other hand, if another alternative has a very large mean, then it may be easily screened out as not being competitive; thus, it seems intuitive that the number of total replications allocated to an alternative decrease with increasing (estimated) mean (for a minimization problem; otherwise, it should increase). The main result in the optimal computing budget allocation (OCBA) approach is that both the means and variances enter into the allocation. We explain the ideas using a simple example. Suppose that in the inventory control example, five alternative values for (s, q) are provided to us, from which we want to find the one with minimum expected cost. Generally, a sequential procedure is employed, with the first stage used to “screen” out obviously poor alternatives, and subsequent stages used to determine the best. Two well-known two-stage ranking and selection procedures are Dudewicz and Dalal (1975) and Rinott (1978), which essentially allocate the total number of replications to each alternative proportional to the (estimated) variance, with no dependence on the estimated means! Returning to the (s, S) inventory example, suppose we conduct some initial simulation replications (assume equal number) for all five alternatives, and consider some possible outcomes from the first-stage estimates, in terms of the estimated costs and associated confidence intervals. Figure 1 depicts one possible outcome, where some alternatives seem better, but are not clearly better than the others, since all the confidence intervals overlap. In such a situation it is not straightforward to determine which alternatives can be eliminated. In this particular example, a reasonable approach might be to simulate further all of the alternatives the same number of replications, because the variances are approximately equal, judging by the current confidence interval half-widths. Thus in this case, equal allocation corresponds roughly to an allocation based on variances, as in Dudewicz and Dalal (1975) and Rinott (1978). Another possibility after the initial set of replications is shown in Figure 2, where there is also a significant amount of uncertainty in the performance estimation, but it appears
Figure 1: Confidence intervals for average cost in the (s, S) inventory example: a case where all five alternatives could be best and have approximately the same variance.
that alternatives 2 and 3 are much better than the other alternatives. Furthermore, the three worst alternatives have larger variance than the two best alternatives, so an allocation based solely on variances would be wasting resources on obviously inferior solutions, while not being able to distinguish which one of the two better alternatives is best. Thus, intuitively it seems sensible to allocate few or no replications to alternatives 1, 4, and 5, instead allocating the bulk of the simulation budget to alternatives 2 and 3. In other words, the simulation budget allocation should be based on a combination of the mean and variance estimates, rather than just the variance alone. If the sample performances L(θ , ω) are assumed to be independent and normally distributed, then the means and variances should suffice to characterize an efficient allocation of simulation resources (otherwise, higher moments and correlations might be required). The Optimal Computing Budget Allocation (OCBA) — introduced in Chen et al. (1997), Chen et al. (2000) — maximizes an approximation of the probability of correct selection P{CS}, where correct selection (CS) indicates choosing the alternative with minimum mean, leading to an efficient allocation algorithm that includes both means and variances. Extensions of the OCBA approach consider correlated sampling (Fu et al. 2007); non-normal distributions (Glynn and Juneja 2004), (Fu et al. 2004); multiple objective functions (Lee et al. 2004); using expected opportunity cost instead of the probability of correct selection (Chick and Wu 2005), (He, Chick, and Chen 2007); minimizing variance instead of maximizing the probability of correct selection (Trailovic and Pao 2004); selecting an optimal subset of top-m solutions rather than the single best solution (Chen et al. 2008).
30
Fu, Chen, and Shi scribes an allocation proportional to variance and inversely proportional to the squared difference in mean from the best. A sequential algorithm implementing the OCBA solution is given in Figure 3, where the index “b” corresponds to the estimated best alternative. INPUT k, T, ∆, n0 (T − kn0 a multiple of ∆ and n0 ≥ 5). INITIALIZE l ←0; Perform n0 simulation replications for all alternatives; N1l = N2l = · · · = Nkl = n0 . k
LOOP WHILE ∑ Nil < T DO i=1
UPDATE Calculate sample means J¯i , sample standard deviation si , i = 1, ..., k, and b=arg mini J¯i using the new simulation output. ALLOCATE Increase the computing budget by ∆ and calculate the new budget allocation, N1l+1 ,N2l+1 , . . . ,Nkl+1 , according to
Figure 2: Confidence intervals for average cost in the (s, S) inventory example: a relatively “easy” case where two alternatives are clearly superior, if based on both the mean and variance estimates.
(1)
Nil+1 N l+1 j
=
s2i /(J¯b −J¯i )2 , s2j /(J¯b −J¯j )2
s (2) Nbl+1 = sb
k
∑ i=1,i6=b
i 6= j 6= b, � �2 Nil+1 , si
SIMULATE Perform max(Nil+1 − Nil , 0) additional simulations for alternative i, i= 1,. . . ,k; l ← l +1. END OF LOOP OUTPUT estimated best solution b=arg mini J¯i .
The approach by Chick and Inoue (2001b), Chick and Inoue (2001a) estimates the correct selection probability with Bayesian posterior distributions, and allocates further samples using decision-theory tools to maximize the expected value of information in those samples. The procedure by Kim and Nelson (2006) allocates samples in order to provide a guaranteed lower bound for the frequentist probability of correct selection integrated with ideas of early screening. Branke, Chick, and Schmidt (2007) provide an overview and extensive computational comparison between many of the aforementioned selection procedures. Now we briefly describe the OCBA approach, one of the top performers in the computational tests of Branke, Chick, and Schmidt (2007). Chen et al. (2000) formulate the problem of simulation computing budget allocation as an optimization problem. Let Ni denote the number of simulation replications allocated to alternative i. It is intended to find N1 , N2 , . . . , Nk such that the probability of correct selection P{CS} is maximized, subject to a limited overall computing budget T , i.e.,
Figure 3: OCBA allocation procedure. On the other hand, Chen and Y¨ucesan (2005) consider the problem from what can be viewed as the dual perspective, which essentially corresponds to the traditional statistical ranking and selection approach. Specifically, instead of trying to maximize P{CS} subject to a fixed computing budget, the problem is to minimize overall computing cost (total number of simulation replications) while guaranteeing a specified P{CS}, such as 95%, i.e., min N1 + N2 + · · · + Nk s.t. P{CS} ≥ P∗ ,
max P{CS}
where P∗ is the desired “confidence level.” While the problem appears to be different, Chen and Y¨ucesan (2005) show that its approximate solutions are identical, so the same OCBA procedure applies to this problem, as well. Extensive numerical testing of OCBA can be found in the literature, including Branke, Chick, and Schmidt (2007), which compares it with other methods with favorable conclusions on its efficiency. Of course, the actual computation cost using OCBA depends on the specific problem and the corresponding P{CS} requirement. However, the speedup
s.t. N1 + N2 + · · · + Nk = T. Here N1 + N2 + · · · + Nk = T denotes the total computational cost assuming the simulation execution times for different alternatives are roughly the same. Using a Bayesian model (Chen 1996), an approximation of P{CS} is found and then an asymptotic solution to the approximation is obtained. Basically, aside from the best alternative, the solution pre-
31
Fu, Chen, and Shi factor of using OCBA vs. equal allocation is increasing in the number of alternatives, but otherwise pretty robust to many other problem parameters. Table 1 shows the speedup factor using OCBA for an experiment in Chen and Y¨ucesan (2005).
simulation runs per gradient estimate would be 2p. If p were a million, then we go from one simulation replication per performance estimate to two million simulation replications per gradient estimate! Another more efficient approach is simultaneous perturbation stochastic approximation introduced by (Spall 1992), which requires only two simulations per gradient estimate, regardless of the dimension of the vector. Whereas in the (symmetric) finite difference estimate, the pair in the numerator changes for each component of the gradient estimate, in the simultaneous perturbation (SP) gradient estimate, the pair in the numerator is identical for each component of the gradient estimate, and it is the denominator that is (possibly) different for each component. The ith component of the SP gradient estimate would be as follows:
Table 1: Example of estimated speedup factor of using OCBA compared with the use of equal allocation. # alternatives speedup
4
4 1.8
10 3.4
20 6.5
50 12.8
75 16.3
100 19.8
STOCHASTIC GRADIENT ESTIMATION
The goal of stochastic gradient estimation is to estimate the gradient of the performance measure with respect to the parameters, denoted by ∇J(θ ). This presupposes that J is differentiable in θ , so in our simulation optimization context, we are considering the setting where Θ is a continuous space, generally a subset of ℜ p . Given a gradient, one can carry out local gradient search. When the gradient estimate is noisy, this leads to the stochastic form of gradient search known as stochastic approximation (Kushner and Yin 2003). The algorithm takes the following iterative form:
� � L(θ + ∆, ωA ) − L(θ − ∆, ωB ) b , ∇J(θ ) = 2∆i i where ∆ is a vector whose ith component ∆i is ±hi w.p.0.5. Both of these approaches could be called “black box” methods, since no knowledge of the simulation model is used. In fact, there is nothing that even recognizes that the model is stochastic, as the same estimators could be used for deterministic models. However, in the simulation setting more is known about the underlying system, for example distributions that generate input random variables. This allows for the implementation of more efficient direct methods to estimate the gradient. Methods for direct stochastic gradient estimation include perturbation analysis (Ho and Cao 1991, Glasserman 1991, Fu and Hu 1997), the likelihood ratio/score function method (Glynn 1987), (Rubinstein and Shapiro 1993), and weak derivatives (Pflug 1989, Pflug 1996). For a more detailed overview on these methods, the reader is referred to Fu (2006) and Fu (2008). In general, perturbation analysis corresponds to directly differentiating the sample performance function and is thus sometimes called the pathwise method in finance applications (Glasserman 2004), whereas the other two methods involve differentiation of the underlying (joint) probability distribution, which in simulation generally corresponds to the input random variables that generate the output performance measures. In a queueing system, the input random variables include the interarrival times and the service times, whereas in the (s, S) inventory system, the input random variables include the demand amounts, interarrival times of demands, and order lead times. If the parameters occur in these distributions, then any of the methods could theoretically be applied, but the technical requirements are more stringent for perturbation analysis. The latter has the advantage that it more easily handles “structural” parameters, which is what the control parameters s and S can be viewed as for that example. In principle, θ could have elements
θn+1 = θn − an ∇J(θn ), which is simply gradient search in the stochastic setting, where θn represents the value of the parameter vector at the nth iteration and {an } is a step-size multiplier sequence (sometimes called a “gain” sequence) that needs to go to zero at an appropriate rate in order to guarantee with probability 1 (w.p.1) [or almost sure (a.s.)] convergence. However, less stringent conditions are required (e.g., not even going to zero) if weaker forms of convergence suffice. The straightforward method of estimating the gradient is to do so using componentwise perturbations. The ith component of the symmetric difference gradient estimate would be as follows: � � L(θ + hi ei , ωA ) − L(θ − hi ei , ωB ) b , ∇J(θ ) = 2hi i where hi is the (scalar) perturbation in the ith component, ei is the unit vector in the ith direction, and ωA and ωB represent two simulation replications with different random number seeds. Using common random numbers, i.e., taking ωA = ωB can oftentimes reduce the variance dramatically, but it is problem dependent as to whether synchronization can be achieved (Law and Kelton 2000). The biggest drawback to finite difference approaches is that the computational burden grows linearly in the dimension p of the vector θ , e.g., for the symmetric difference estimate, the number of
32
Fu, Chen, and Shi in both the sample performance and the underlying input distributions (see L’Ecuyer (1990)). For the (s, S) inventory system, perturbation analysis estimators were derived under different settings in Fu (1994b), Fu and Hu (1994), and Bashyam and Fu (1994), the first applications of stochastic gradient estimation techniques to inventory systems. In Fu and Healy (1992) and Fu and Healy (1997), the resulting estimators are applied to the classical unconstrained cost minimization formulation, comparing a stochastic approximation algorithm with a “retrospective optimization” algorithm (precursor to the “sample average approximation” or “sample path optimization” terminology), whereas in Bashyam and Fu (1998), perturbation analysis estimators are applied to a minimization of expected holding and ordering costs subject to a service level constraint, where the latter is also estimated using simulation, and the optimization algorithm is a stochastic adaptation of a deterministic feasible directions algorithm. Zhang and Fu (2005) add a pricing decison variable to the optimization problem. Pflug and Rubinstein (2002) have shown how the score function method could also be applied to the (s, S) inventory system through an appropriate change of variables and conditioning argument. The entire Chapter 7 of the Lancaster Prize-winning textbook by Glasserman (2004) discusses applications of stochastic gradient estimation to the finance setting, beginning with a discussion of finite difference methods. Gradient search finds only local optima and applies only to the setting where the parameters are continuous. The method described in the next section is a global optimization method that is also particularly suitable for discrete (combinatorial) optimization problems. 5
sub-region scoring highest on the promising index automatically becomes the most promising region. The method backtracks to a larger region, if the surrounding region rather than a sub-region is found to have the best promising index. Here, a fixed backtracking rule is employed. The new most promising region is then partitioned and sampled in a similar fashion. This methodology divides into four main steps that constitute the NP method. Not only can each of these steps be implemented in a generic fashion, but it can also be combined with other optimization methods, thus making it adaptive to any special structure of a given problem. 1.
NESTED PARTITIONS METHOD
2.
The Nested Partitions (NP) method has recently been proposed to solve global optimization problems (Shi and ´ ´ ´ Olafsson 2000a, Shi and Olafsson 2000b, Shi and Olafsson ´ 2008). Shi and Olafsson (2007) concentrates on the deterministic setting (see also Ladson and Pint´er 2007 for additional discussion and references), whereas here the emphasis is on how it can be applied to the simulation setting, which we illustrate with the (s, S) inventory control example. The method can be briefly described as follows. In each iteration, a region considered most promising is assumed. We then partition this region into M subregions and aggregate the entire surrounding region into one. Therefore, within each iteration, we only look at M + 1 disjoint subsets that cover the feasible region. Each of these M + 1 regions is sampled using some random sampling scheme and the estimated performance function values at randomly selected points are used to approximate a so-called promising index for each region. This index determines which region becomes the most promising one in the next iteration. The
3.
33
Partitioning. The first step is to partition the current most promising region into several sub-regions and aggregate the surrounding region into one. The partitioning strategy imposes a structure on the feasible region and is therefore important for the rate of convergence of the algorithm. If the partitioning is such that most of the good solutions tend to be clustered together in the same subregions, it is likely that the algorithm quickly concentrates the search in these subsets of the feasible region. If the partitioning is completely unrelated to the performance function, then it is called generic partitioning. The advantage of generic partitioning is that the partitioning tree is usually predictable in terms of branching degrees and searching depths. More efficient partitions could be constructed if the performance function is considered. This type of partitioning technique is called Knowledge-Based Clustered partitioning. For detailed discussion on ´ both partitions, see Shi, Olafsson, and Sun (1999). Random Sampling. The next step of the algorithm is to randomly sample from each of the subregions and from the aggregated surrounding region. This can be done in almost any fashion, provided that each solution in a given sampling region should be selected with a positive probability. Although uniform sampling can always be used, it may often be worthwhile to incorporate special structures into the sampling procedure so that the sampling quality can be improved, e.g., some kind of weighted sampling scheme. Calculation of Promising Index and Determination of the Most Promising Region. Once each region has been sampled, the next step is to use the sample points to calculate the promising index of each region and then determine the most promising region based on the promising indices. It should be noted that the determination is based on order comparison of the indices. In terms of the implication for simulation optimization, the key thing to note is that an accurate estimation of the promising
Fu, Chen, and Shi
4.
index value for each region is not critical, i.e, the relative order of promising indices, or the relative order of the considered solutions, is more essential than the value of the promising index itself. This is an ideal situation for the use of ordinal optimization (Ho et al. 1992, Ho et al. 2000). Again the NP methodology offers a great deal of flexibility. The only requirement imposed on a promising index is that it should agree with the original performance function on singleton regions. Further Partition or Backtracking. If one of the subregions has the best promising index, the algorithm moves to this region and considers it to be the most promising region in the next iteration. If the surrounding region has the best promising index the algorithm backtracks to a larger region. The NP method described here can be applied, in its generic form, to a wide range of problems. The method is also capable of taking advantage of special structures by incorporating them into the partitioning, sampling, and promising index steps. The partitioning approach also makes the algorithm compatible with emerging parallel computing capabilities. Each region can be treated independently and in parallel, with only a minor coordination overhead. The method also uniquely combines global search through partitioning and sampling and local search through estimation of the promising index.
Figure 4: Partitioning of the (s, S) inventory problem example.
exist many partitions. For example, we could also have divided Θ into three subregions initially by dividing the real-line interval for s into three different intervals (as in the third level in Figure 4). This partition would provide a completely different set of subregions. The second step is to use some sampling method to obtain a set of solutions from each region. This should be done in such a way that each point has a positive probability of being selected. It should be noted that many heuristics may be incorporated into the sampling step through a weighted sampling scheme, which we will demonstrate. The only requirement is that each point in a sampling region should have a positive probability of being selected. While uniform sampling scheme works well in most cases, from our experience, incorporation of a simple heuristic into the sampling scheme can drastically improve the sampling quality. For example, suppose the current sampling region has the form of {([0, R], q)}, meaning that the variable s could take any value between [0, R] and q could take any non-negative value. Generating a random sampling point in this sampling region means to randomly select on both values. However, assume we want to weight the probabilities for the numbers between 0 and 2 three times higher than values greater than 2. Such a weighted sampling scheme is illustrated in Figure 5 for R > 2. Of course, there are many other ways to assign the weights. Numerical results indicate that the NP method performs well using such simple heuristics. The third step is to rank and select the best from the set of sampled alternatives (solutions), comprising the union of all sampled solutions from each disjoint (sub)region. In the simulation setting, this step is connected to the previous step and the next step, because simulation must be used to estimate the performance (promising index) of each sampled solution. Clearly, the OCBA method is one way to carry this out more efficiently, and combining NP with OCBA in these steps is proposed in Shi and Chen (2000). The final step is to determine the most promising region for the next iteration. The subregion estimated to have the best promising index becomes the most promising region in
We use the (s, S) inventory example to illustrate how the NP method can be applied to this problem in simulation optimization. In the kth iteration we assume that there is a subregion of the feasible region that may be considered most promising. Initially we assume no knowledge about the most promising region and let it be the entire feasible region Θ. The first step is to partition the most promising region into disjoint subregions and aggregate the surrounding region (if any) into one. In the two-dimensional (s, S) inventory example, the partition can be done on one variable only or on both simultaneously. For example, in Figure 4, we first partition the solution space into two subregions based on the value of s, without any surrounding region. Next, if {(s < 10, q)} becomes the most promising region, we then partition it into two subregions, and the surrounding region is Θ \ {(s < 10, q)}. We can further partition each such subregion by subdividing the second variable into intervals or by further partitioning the variable s into subintervals as is done in the example shown in Figure 4. Assuming that s and q are discrete (e.g., integer-valued), this procedure can be repeated until the singleton region is reached, when all the s and q are fixed. It can be seen from Figure 4 that at the same level, each subregion contains a different number of feasible points. Given a solution space, there
34
Fu, Chen, and Shi ACKNOWLEDGMENTS This work has been supported in part by the National Science Foundation (NSF) under Grants IIS-0325074, DMI0540312, CMMI-0646697, and DMI-0323220, by NASA Ames Research Center under Grants NNA05CV26G, by the Federal Aviation Administration (FAA) under Grant 00G-016, and by the Air Force Office of Scientific Research (AFOSR) under Grants FA9550-07-1-0366 and FA9550-071-0390. We thank Matthew Reindorp and Andrew Hall for their comments and corrections.
Figure 5: Weighted sampling scheme for the (s, S) inventory problem example.
REFERENCES the next iteration. In the simulation setting, the estimation error comes from two sources: 1. 2.
Andrad´ottir, S. 1998. Simulation optimization. In Handbook of Simulation: Principles, Methodology, Advances, Applications, and Practice, ed. J. Banks, Chapter 9. John Wiley & Sons. Andrad´ottir, S. 2006. An overview of simulation optimization with random search. In Handbooks in Operations Research and Management Science: Simulation, ed. S. G. Henderson and B. L. Nelson, Chapter 20, 617– 632. Elsevier. Barton, R. R., and M. Meckesheimer. 2006. Metamodelbased simulation optimization. In Handbooks in Operations Research and Management Science: Simulation, ed. S. G. Henderson and B. L. Nelson, Chapter 18, 535–574. Elsevier. Bashyam, S., and M. C. Fu. 1994. Application of perturbation analysis to a class of periodic review (s, S) inventory systems. Naval Research Logistics 41 (1): 47–80. Bashyam, S., and M. C. Fu. 1998. Optimization of (s, S) inventory systems with random lead times and a service level constraint. Management Science 44 (12): S243– S256. Bechhofer, R. E., T. J. Santner, and D. M. Goldsman. 1995. Design and analysis of experiments for statistical selection, screening, and multiple comparisons. Wiley. Bertsekas, D. P., and J. N. Tsitsiklis. 1996. Neuro-dynamic programming. Athena Scientific. Birge, J. R., and F. Louveaux. 2000. Introduction to stochastic programming. 2nd ed. Springer-Verlag. Branke, J., S. E. Chick, and C. Schmidt. 2007. Selecting a selection procedure. Management Science 53:1916– 1932. Chang, H. S., M. C. Fu, J. Hu, and S. I. Marcus. 2007. Simulation-based algorithms for Markov decision processes. Springer. Chen, C. 1996. A lower bound for the correct subsetselection probability and its application to discrete event system simulations. IEEE Transactions on Automatic Control 41:1227–1231.
the error from possibly not sampling the entire subregion (except when they are singletons), and the error from simulation estimation of performance at a particular solution point.
The new most promising region is thus nested within the last. By extension, if the surrounding region is found to have the best promising index, the algorithm backtracks to a larger region that contains the best solution. The partitioning continues until singleton regions are obtained and no further partitioning is possible. 6
CONCLUDING REMARKS
Simulation optimization is an active research area, both in terms of research into new and improved algorithms and theoretical results, and in commercial software implementation. The most exciting developments are usually reported annually in the Winter Simulation Conference. Two of the most well-known pieces of optimization software for simulation are OptQuest and SimRunner, and the commercial vendors are regular attendees at the conference. Because the field of simulation optimization is so important and flourishing, an important step in helping researchers compare their algorithms and results is the building and maintaining of a testbed of simulation optimization problems (Pasupathy and Henderson 2006). Closely related to simulation optimization research is research in stochastic programming (Birge and Louveaux 2000), approximate (stochastic) dynamic programming (Powell 2007) (also known as reinforcement learning in the artificial intelligence community (Sutton and Barto 1998) and neuro-dynamic programming in the control community (Bertsekas and Tsitsiklis 1996)), and simulation-based approaches to Markov decision processes (Chang, Fu, Hu, and Marcus 2007). All of these areas are interested in finding ways of utilizing simulation efficiently and integrating simulation into the algorithms themselves.
35
Fu, Chen, and Shi Fu, M. C., and J. Q. Hu. 1994. (s, S) inventory systems with random lead times: Harris recurrence and its implications in sensitivity analysis. Probability in the Engineering and Informational Sciences 8 (3): 355– 376. Fu, M. C., and J. Q. Hu. 1997. Conditional Monte Carlo: Gradient estimation and optimization applications. Kluwer Academic Publishers. Fu, M. C., J. Q. Hu, C. H. Chen, and X. Xiong. 2004. Optimal computing budget allocation under correlated sampling. In Proceedings of the 2004 Winter Simulation Conference, 595–603. Piscataway, NJ: IEEE. Fu, M. C., J. Q. Hu, C. H. Chen, and X. Xiong. 2007. Simulation allocation for determining the best design in the presence of correlated sampling. INFORMS Journal on Computing 19 (1): 101–111. Glasserman, P. 1991. Gradient estimation via perturbation analysis. Kluwer Academic Publisher, Boston, Massachusetts. Glasserman, P. 2004. Monte Carlo methods in financial engineering. Springer, New York. Glynn, P., and S. Juneja. 2004. A large deviations perspective on ordinal optimization. In Proceedings of the 2004 Winter Simulation Conference, 577–585. Piscataway, NJ: IEEE. Glynn, P. W. 1987. Likelihood ratio gradient estimation: An overview. In Proceedings of the 1987 Winter Simulation Conference, 366–375. Piscataway, NJ: IEEE. He, D., S. E. Chick, and C. H. Chen. 2007. The opportunity cost and OCBA selection procedures in ordinal optimization. IEEE Transactions on Systems, Man, and Cybernetics–Part C 37:951–961. Ho, Y. C., and X. R. Cao. 1991. Perturbation analysis and discrete event dynamic systems. Kluwer Academic. Ho, Y. C., C. G. Cassandras, C.-H. Chen, and L. Dai. 2000. Ordinal optimization and simulation. Journal of Operations Research Society 21:490–500. Ho, Y. C., R. S. Sreenivas, and P. Vakili. 1992. Ordinal optimization of deds. Journal of Discrete Event Dynamic Systems 2 (2): 61–88. Homem-de-Mello, T., A. Shapiro, and M. L. Spearman. 1999. Finding optimal material release times using simulation-based optimization. Management Science 45:86–102. Kim, S.-H., and B. L. Nelson. 2006. Selecting the best system. In Handbooks in Operations Research and Management Science: Simulation, ed. S. G. Henderson and B. L. Nelson, Chapter 17, 501–534. Elsevier. Kleijnen, J. 2008. Design and analysis of simulation experiments. New York: Springer. Kleywegt, A., A. Shapiro, and T. Homem-de-Mello. 2001. The sample average approximation method for stochastic discrete optimization. SIAM Journal on Optimization 12:479–502.
Chen, C. H., M. C. Fu, and L. Shi. 2008. Simulation and optimization. Tutorials in Operations Research. in press. Chen, C. H., D. He, M. C. Fu, and L. H. Lee. 2008. Efficient simulation budget allocation for selecting an optimal subset. INFORMS Journal on Computing. accepted for publication. Chen, C. H., J. Lin, E. Yucesan, and S. E. Chick. 2000. Simulation budget allocation for further enhancing the efficiency of ordinal optimization. Discrete Event Dynamic Systems: Theory and Applications 10:251–270. Chen, C. H., and E. Y¨ucesan. 2005. An alternative simulation budget allocation scheme for efficient simulation. International Journal of Simulation and Process Modeling 1 (1/2): 49–57. Chen, H. C., C. H. Chen, L. Dai, and E. Y¨ucesan. 1997. New development of optimal computing budget allocation for discrete event simulation. In Proceedings of the 1997 Winter Simulation Conference, 334–341. Piscataway, NJ: IEEE. Chick, S. E., and K. Inoue. 2001a. New procedures to select the best simulated system using common random numbers. Management Science 47:1133–1149. Chick, S. E., and K. Inoue. 2001b. New two-stage and sequential procedures for selecting the best simulated system. Operations Research 49:732–743. Chick, S. E., and Y.-Z. Wu. 2005. Selection procedures with frequentist expected opportunity cost. Operations Research 53 (5): 867–878. Dudewicz, E. J., and S. R. Dalal. 1975. Allocation of observations in ranking and selection with unequal variances. Sankhya 37B:28–78. Fu, M. C. 1994a. Optimization via simulation: A review. Annals of Operations Research 53:199–248. Fu, M. C. 1994b. Sample path derivatives for (s, S) inventory systems. Operations Research 42 (2): 351–364. Fu, M. C. 2002. Optimization for simulation: Theory vs. practice (Feature Article). INFORMS Journal on Computing 14 (3): 192–215. Fu, M. C. 2006. Gradient estimation. In Handbooks in Operations Research and Management Science: Simulation, ed. S. G. Henderson and B. L. Nelson, Chapter 19, 575– 616. Elsevier. Fu, M. C. 2007. Are we there yet? the marriage between simulation & optimization. OR/MS Today June:16–17. Fu, M. C. 2008. What you should know about simulation and derivatives. Naval Research Logistics. forthcoming. Fu, M. C., and K. J. Healy. 1992. Simulation optimization of (s, S) inventory systems. In Proceedings of the 1992 Winter Simulation Conference, 506–514. Piscataway, NJ: IEEE. Fu, M. C., and K. J. Healy. 1997. Techniques for simulation optimization: An experimental study on an (s, S) inventory system. IIE Transactions 29 (3): 191–199.
36
Fu, Chen, and Shi ´ Shi, L., and S. Olafsson. 2008. Nested partitions optimization: Methodology and applications. Springer, New York. ´ Shi, L., S. Olafsson, and N. Sun. 1999. New parallel randomized algorithms for the traveling salesman problem. Computers and Operations Research 26:371–394. Spall, J. C. 1992. Multivariate stochastic approximation using simultaneous perturbation gradient approximation. IEEE Transactions on Automatic Control 37:332–341. Sutton, R. S., and A. G. Barto. 1998. Reinforcement learning: An introduction. MIT Press, Cambridge. Trailovic, L., and L. Y. Pao. 2004. Computing budget allocation for efficient ranking and selection of variances with application to target tracking algorithms. IEEE Transactions on Automatic Control (49): 58–67. Whitt, W. 2007. What you should know about queueing models to set staffing requirements in service systems. Naval Research Logistics 54:476–484. Zhang, H., and M. C. Fu. 2005. Sample path derivatives for (s, S) inventory systems with price determination. In The Next Wave in Computing, Optimization, and Decision Technologies, ed. E. A. W. Bruce L. Golden, S. Raghavan, 229–246. Kluwer Academic.
Kushner, H. J., and G. G. Yin. 2003. Stochastic approximation algorithms and applications. 2nd ed. SpringerVerlag. Ladson, L. S., and J. D. Pint´er. 2007. Computational global optimization. Tutorials in Operations Research:23–37. Law, A. M., and W. D. Kelton. 2000. Simulation modeling and analysis. 3rd ed. New York: McGraw-Hill. L’Ecuyer, P. 1990. A unified view of the IPA, SF, and LR gradient estimation techniques. Managament Science 36:1364–1383. Lee, L. H., E. P. Chew, S. Y. Teng, and D. Goldsman. 2004. Optimal computing budget allocation for multiobjective simulation models. In Proceedings of 2004 Winter Simulation Conference, 586–594. Piscataway, NJ: IEEE. ´ Olafsson, S. 2006. Metaheuristics. In Handbooks in Operations Research and Management Science: Simulation, ed. S. G. Henderson and B. L. Nelson, Chapter 21, 633–654. Elsevier. Pasupathy, R., and S. G. Henderson. 2006. A testbed of simulation-optimization problems. In Proceedings of the 2006 Winter Simulation Conference, ed. L. F. Perrone, F. P. Wieland, J. Liu, B. G. Lawson, D. M. Nicol, and R. M. Fujimoto, 255–263. Piscataway, NJ: IEEE. Pflug, G. C. 1989. Sampling derivatives of probabilities. Computing 42:315–328. Pflug, G. C. 1996. Optimization of stochastic models. Kluwer Academic. Pflug, G. C., and R. Y. Rubinstein. 2002. Inventory processes: Quasi-regenerative property, performance evaluation and sensitivity estimation via simulation. Stochastic Models 18:469–496. Powell, W. B. 2007. Approximate dynamic programming: Solving the curses of dimensionality. Wiley, New York, NY. Rinott, Y. 1978. On two-stage selection procedures and related probability inequalities. Communications in Statistics A7:799–811. Rubinstein, R. Y., and A. Shapiro. 1993. Discrete event systems: Sensitivity analysis and stochastic optimization by the score function method. John Wiley & Sons. Shi, L., and C. H. Chen. 2000. A new algorithm for stochastic discrete resource allocation optimization. Discrete Event Dynamic Systems: Theory and Applications 10:271– 294. ´ Shi, L., and S. Olafsson. 2000a. Nested partitions method for global optimization. Operations Research 48:390–407. ´ Shi, L., and S. Olafsson. 2000b. Nested partitions method for stochastic optimization. Methodology and Computing in Applied Probability 2:271–291. ´ Shi, L., and S. Olafsson. 2007. Nested partitions optimization. Tutorials in Operations Research:1–22.
AUTHOR BIOGRAPHIES MICHAEL C. FU is Ralph J. Tyser Professor of Management Science in the Robert H. Smith School of Business, with a joint appointment in the Institute for Systems Research and affiliate faculty appointment in the Department of Electrical and Computer Engineering, all at the University of Maryland. He received degrees in math and EE/CS from MIT, and an M.S. and Ph.D. in applied mathematics from Harvard University. His research interests include simulation optimization and applied probability, with applications in supply chain management and financial engineering. He has published four books: Conditional Monte Carlo: Gradient Estimation and Optimization Applications (1998 INFORMS Simulation Society Outstanding Publication Award), Simulation-based Algorithms for Markov Decision Processes; Perspectives in Operations Research; and Advances in Mathematical Finance. He currently serves as Stochastic Models and Simulation Department Editor for Management Science and was Simulation Area Editor of Operations Research 2000–2005. He is a Fellow of INFORMS and IEEE. His email address is . CHUN-HUNG CHEN is a Professor of Systems Engineering and Operations Research at George Mason University. He received his Ph.D. from Harvard University in 1994. His research interests are mainly in development of efficient methodologies for simulation and optimization, and its application to engineering design and air traffic
37
Fu, Chen, and Shi management. Dr. Chen has served as Co-Editor of the Proceedings of the 2002 Winter Simulation Conference, Program Co-Chair for 2007 Informs Simulation Society Workshop, and the Coordinator of Contributed Papers for 2008 Informs Annual Meeting. He is currently an associate editor of IEEE Transactions on Automatic Control, International Journal of Simulation and Process Modeling, and the Book Series on System Engineering and Operations Research for World Scientific Publishing Co. His email address is . LEYUAN SHI is a Professor with Department of Industrial and Systems Engineering at University of WisconsinMadison. She received her Ph.D. in Applied Mathematics from Harvard University in 1992, her M.S. in Engineering from Harvard University in 1990, her M.S. in Applied Mathematics from Tsinghua University in 1985, and her B.S. in Mathematics from Nanjing Normal University in 1982. Her research is devoted to the theory and development of large-scale optimization algorithms, discrete event simulation methodology, and modeling and analysis of discrete dynamic systems, with applications to complex systems such as supply chain networks, manufacturing systems, communication networks, and financial engineering. She has published two books: Nested Partitions Optimization: Methodology And Applications, which came out this year, and Modeling, Control and Optimization of Complex Systems (2002). She is currently an Associate Editor of Journal of Discrete Event Dynamic Systems, INFORMS Journal on Computing, and IEEE Transactions on Automation Science and Engineering. Dr. Shi is a member of INFORMS and IEEE. Her email address is .
38