Song/Instrumental Classification using Spectrogram Based Contextual Features Arijit Ghosal
CSE Department,
Rudrasis Chakraborty Bibhas Chandra Dhara Department of IT
Indian Statistical Institute Kolkata +919836698054
Institute of Tech. and Marine Engg. 24 Parganas (S), India
[email protected] +919433476991
[email protected]
ABSTRACT Music classification is a fundamental step in any music retrieval system. As the first step for this, we have proposed a scheme for discriminating music signal with voice (song) and without voice (instrumental). The task is important as song-instrument discrimination is of immense importance in the context of a multilingual country like India. Moreover, it enables the subsequent classification of instrumentals based on the type of instrument. Spectrogram image of an audio signal shows the significance of different frequency components over the time scale. It has been observed that spectrogram image of an instrumental signal shows more stable peaks persisting over time and it is not so for a song. It has motivated us to look for spectrogram image based features. Contextual features have been computed based on the occurrence pattern of the most significant frequency over the time scale and overall texture pattern revealed by the time-frequency distribution of signal intensity. RANSAC has been used to classify the signals. Experimental result indicates the effectiveness of the proposed scheme.
Categories and Subject Descriptors
H.5.5 [Sound and Music Computing]: Methodologies and techniques, Signal analysis, synthesis, and processing
General Terms
Design, Experimentation, Performance.
Keywords
Instrumental/song classification, spectrogram image, RANSAC
1. INTRODUCTION
The rapid growth of information technology has led to enormous growth in the data volume of various media data. Management of this huge data is a very crucial task. For efficient accessing and/or retrieving, we need to classify the data into different categories. An efficient audio classification system can serve as the foundation for Permission to make digital or hard copies of all or part of this work for personal or classroom use is granted without fee provided that copies are not made or distributed for profit or commercial advantage and that copies bear this notice and the full citation on the first page. To copy otherwise, or republish, to post on servers or to redistribute to lists, requires prior specific permission and/or a fee. CUBE 2012, September 3–5, 2012, Pune, Maharashtra, India. Copyright 2012 ACM 978-1-4503-1185-4/12/09…$10.00.
Sanjoy Kumar Saha Department of CSE
Jadavpur University
Jadavpur University
Kolkata, India
Kolkata, India
+919734835915
+919433526300
[email protected]
[email protected]
various applications like audio indexing, audio content description, content based audio retrieval [21], music genre classification [22]. In general an automatic audio classification system consists of two steps: computation of features from the signal and classification based on the extracted feature. In the context of music retrieval system, at first level it is necessary to classify a signal as music without voice i.e. instrumental and music with voice i.e. song. Such classification bears significant importance in the context of a retrieval system dealing with multi-lingual songs where for a heterogeneous audience an instrumental is preferred over music with voice. Different researchers have proposed different features to describe the audio content. Features are mainly categories as time domain and frequency domain features. Short time energy (STE) [18, 6, 11] and zero crossing rate (ZCR) [23, 5, 11] are very common time domain features. Mostly used frequency domain features are signal energy [1, 15, 24], fundamental frequency [27], mel-frequency cepstral co-efficients (MFCC) [7, 10, 12]. Perceptual features such as loudness, sharpness and spread incorporate the human hearing process [16, 31] to describe the sounds. A few works [2, 29, 26] have focused on song-music discrimination. Berenzweig et al. [2] have relied on the fact that song will have features of speech embedded in it and a speech-trained model is used to detect the song. But, the success of the scheme depends on the availability of suitable speech recognizer. Zhang et al. [29] have considered four features based on average ZCR and fundamental frequency. Threshold for each features are considered to characterize the music signals and finally the decision is taken based on heuristic approach. The success of the schemes heavily depend on the proper selection of thresholds. The time-frequency representation (TFR) of the audio signal often present interesting pattern in the visual domain [25]. Little attentions have been given to audio classification based on visual pattern. The time-frequency based (spectrogram) features can be used in audio classification in the analogous way of image classification [4, 25]. Spectrogram pattern occurs repeatedly and patterns are different for different source of sounds. Thus, one may classify the audio signals in the visual domain by considering their TFR as texture images [25].
21
For classification of the audio signals various techniques have been tried by the researchers. Threshold based techniques [18, 29], Neural Network [14], clustering [20] have been used for the music classification. A heuristic based approach has been proposed in [28]. k-nearest neighbour (k-NN) and GMM have been used in [22]. In [3], a SVM based audio classification has been proposed. Perceptually weighted Euclidean distance has been presented in [19] and finally relied on k-NN for classification. A fuzzy rule based classification scheme has been presented in [8]. Ren et al. [17] have presented a scheme combining string tokenization method and data mining technique. In this work, we have computed spectrogram image based cooccurrence features to discriminate songs and instrumental signals. To classify the signals we have employed RANdom Sample And Consensus (RANSAC) [9] method. The rest of the paper is organized as follows. The proposed methodology is described in section 2 where we have presented the feature computation and classification scheme. Section 3 presents the experimental results and the concluding remarks are put into section 4.
2. PROPOSED METHODOLOGY
In the present scheme we classify the audio signal as music without voice (instrumental) and music with voice (song). The scheme consists with two major stages: (i) feature computation and (ii) classification of the signal. In the present work, audio signals are represented by time-frequency representation and for this purpose spectrogram image is generated from the input signal. Then, contextual features have been computed based on the occurrence pattern of the most significant frequency over the time scale and overall texture pattern revealed by the time-frequency distribution of signal intensity. Finally, the data is classified using RANdom Sample And Consensus (RANSAC) [9]. The block diagram of the proposed scheme has been shown in Fig. 1. Fundamental steps of the proposed method: Computation of feature and Classification are described below.
2.1 Computation of Features Spectrogram of an instrumental signal reflects stable frequency peaks [29] i.e. a frequency with maximum spectral power persists for certain duration. Because of presence of voice, such stability is not observed in case of song signal. It has motivated us to work with time-frequency representation (TFR) of the music signal. In this work, we have used spectrogram image which contains the information of an audio signal in both spectral and temporal directions. The spectrogram image generation process and subsequent feature extraction process are detailed in the following subsections.
2.1.1 Spectrogram image formation
The steps for the formation of spectrogram image (SI) are shown as a part of Fig. 1. First, the input signal is segmented into fixed window of length N, say. Then, each segment{x(n) : 0 ≤ n ≤ N −1} is transformed into time-frequency domain by applying Fourier transform. The transformed signal is
Figure 1: Block diagram of the proposed music classification scheme.
for k = 0, 1, . . . , −N1 where ω(n) is the Hamming window function and k corresponds to the frequency f(k) = k.f s /N, where f s is the sampling frequency in Hertz. As human perception of sound is logarithmic, the log-spectrogram is used for SI. The logspectrogram of transformed signal X t (k) is defined as S log (k, t) = log 10 (|X t (k)|2). The time-frequency matrix, S log (k, t), is then normalized as [0,1] by
The normalized matrix is mapped to spectrogram image (SI). The SI of the different types of music are shown in Fig. 2 and 3.
2.1.2 Feature extraction
Few works [25, 4] have dealt with spectrogram based features. In [25], for various category of audio signal, representative blocks (B m ) of the log-spectrogram image are stored as their signature. B m is chosen based on degree of resemblance and a learning mechanism. To classify an input signal, B m is slided over the SI of input signal and a feature vector comprising of degree of
22
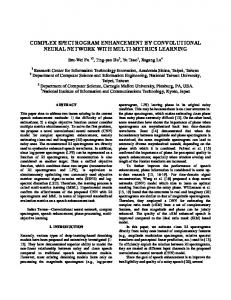
(a) Original signals
(a) Original signals
(b) Spectrogram images
(b) Spectrogram images
(c) Co-occurrence plot of major frequency Figure 2: Song signals with corresponding spectrogram image and co-occurrence plot of major frequency. resemblances is formed. Thus, for each category feature vector is obtained and used in subsequent classification. Dennis et al. [4] have used block based features to classify the audio signals. They partition the SI into 9 × 9 blocks and then for each block they have computed second order and third order central moments. These collections of moments are used as the feature vector. In our approach, we have tried to exploit the fundamental observation that unlike song, instrumental signal possesses more stable peaks in the spectrogram. In a signal, at different point of time, different frequency component dominates. We refer to the frequency corresponding to maximum spectral power at an instance as the major frequency at that point of time. The major frequency varies more frequently in case of song in comparison to an instrumental signal. The temporal variation pattern of major frequency is captured in the form of a co-occurrence matrix. Thus, it reflects the contextual information also. The concept of cooccurrence matrix is well utilized in measuring image texture [13]. In our case, an element in the matrix M(f 1 , f 2 ) stands for number of occurrences of major frequencies f1 and f2 in consecutive time instances. The elements of M are normalized and thus, it approximates the probability distribution of the occurrence of major frequency pairs. Based on the matrix, we compute entropy, homogeneity and contrast according to the formulation presented in [13]. The plots for co-occurrence matrices of song and instrumental signal are shown in Fig. 2 and 3. Along with the co-
(c) Co-occurrence plot of major frequency Figure 3: Instrument signals with corresponding spectrogram image and co-occurrence plot of major frequency. occurrence matrix based features, we also consider average and standard deviation of major frequencies to form five dimensional features. The intensity of a particular pixel in the spectrogram image denotes the strength of a particular frequency component at a particular time. Thus, it reflects the temporal variation of strength of all frequency components present in the signal. In order to capture the contextual information based on overall distribution of the strength, we have computed the intensity co-occurrence matrix and features are obtained similarly. Finally, 10-dimensional feature vector is generated.
2.2 Classification In the audio collection the variety of the data poses the major challenge in the audio classification. SVM or neural network based classification schemes are most popular. The variety of data for the same class is a big challenge for the neural based classifier. SVM based classifier is robust but the crucial task is the parameter tuning for optimal performance. It has motivated us to look for a robust estimator capable for handling the diversity of the data and cam model data satisfactorily. RANdom Sample And Consensus (RANSAC) [9] appears as a suitable alternative to fulfill the requirement. RANSAC is an iterative method to estimate the parameters of a
23
certain model from a set of data with large number of outliers. The main advantage of the RANSAC is that the estimation of the parameter is purely based on inliers. RANSAC can produce reasonably good model provided a data set contains a sizable amount of inliers. It may noted that RANSAC can work satisfactorily even with outliers amounting to 50% of entire data set [30]. Using a subset of each category of the data, model parameter are first estimated and then this model is used for the classification purpose. Given a feature vector, its class is taken as that of the most similar model. As it has been discussed that RANSAC estimates the model relying on the inliers, unlike other technique, it is less affected by the noisy data. Thus, RANSAC is well suited for our purpose.
3. EXPERIMENTAL RESULTS In order to carry out the experiment, we have prepared a music database consisting of 300 instrumental files and 300 song files. Each file contains audio of around 40-45 seconds duration. File are obtained from CD recording, recording of live programs and downloaded from various sites in Internet. Sampling frequency for the data is 22050 Hz. Samples are of 16-bits and of type mono. Data of different instruments like flute, piano guitar, drum have been stored. Songs also contains the varieties like classical, jazz, rock, Bhangra (north Indian genre). To compute the features, an audio file is divided into frames. Corresponding to each frame spectrogram image is obtained. Each frame consists of 256 samples of which there is an overlap of 128 samples between two consecutive frames. In this experiment, we test the performance of RANSAC on the computed feature set. We also compute the performance on neural network on the same feature set and found the performance of the RANSAC is much better than neural net. The comparative result is given Table 1. Table 1. Table captions should be placed above the table Classification Scheme Neural Network RANSAC
Instrumental
Song
Overall
85.00
80.33
82.67
97.00
93.00
95.00
5. ACKNOWLEDGMENTS
The work is partially supported by the facilities created under DST-PURSE program in Computer Science and Engineering Department of Jadavpur University.
6. REFERENCES
[1] H. Beigi, S. Maes, J. Sorensen, and U. Chaudhari. A hierarchical approach to large-scale speaker recognition. In Int. Computer Music Conference, 1999. [2] A. L. Berenzweig and D. P. W. Ellis. Locating singing voice segments within music signals. In IEEE Workshop on Appln. of Sig. Proc. to Audio and Acoustics, pages 119–122, 2001. [3] Y. M. G. Costa, L. S. Oliveira, A. L. Koreich, and F. Gouyon. Music genre recognition using spectrograms. In Intl. Conf. on Systems, Signal and Image Processing, pages 1–4, 2011. [4] J. Dennis, T. Dat, and H. Li. Spectrogram image feature for sound event classification in mismatched conditions. IEEE Signal Processing Letters, 18(2):130–133, 2011. [5] J. Downie. The scientific evaluation of music information retrieval systems: Foundations and future.Computer Music Journal, 28(2):12–33, 2004. [6] K. El-Maleh, M. Klein, G. Petrucci, and P. Kabal. Speech/music discriminator for multimedia application. In IEEE Conf. on Acoustics, Speech and Signal Processing, 2000. [7] A. Eronen and A. Klapuri. Musical instrument recognition using ceptral coefficients and temporal features. In IEEE Conf. on Acoustics, Speech and Signal Processing, pages 753–756, 2000. [8] F. Fernandez, F. Chavez, R. Alcala, and F. Herrera. Musical genre classification by means of fuzzy rule-based systems: A preliminary approach. In IEEE Congress on Evolutionery Computing, pages 2571–2577, 2011. [9] M. A. Fischler and R. C. Bolles. Random sample consensus: A paradigm for model for model fitting with applications to image analysis and automated cartography. ACM Communications, 24:381–395, 1981. [10] J. T. Foote. Content-based retrieval of music and audio. In SPIE, pages 138–147, 1997.
In this experiment, we have used 50% of each type of data as training set for determining the model and rest of the data have been used for testing. Once again, the experiment is done reversing the training and test data set. Average testing accuracy have been shown in Table 1.
[11] A. Ghosal, R. Chakraborty, R. Chakraborty, S. Haty, B. C. Dhara, and S. K. Saha. Speech/music classification using occurrence pattern of zcr and ste. In 3rd International Symposium on Intelligent Information Technology Application, pages 435–438, China, 2009. IEEE CS Press.
4. CONCLUSION
[12] A. Ghosal, R. Chakraborty, B. C. Dhara, and S. K. Saha. Instrumental/song classification of music signal using ransac. In 3rd Intl. Conf. on Electronic Computer Technology, India, 2011. IEEE CS Press.
In this work, we have proposed a scheme for classifying the music signal into two categories namely instrumental and song. We have used spectrogram image based co-occurrence features to classify the signals. For classification, we have relied on RANSAC based technique which is capable of handling a wide variety of data in a class. RANSAC generates model for each class and based on the derived model classification is done. Experimental result shows the performance of the scheme is quite satisfactory. In future, further subclassification of the data in the individual class may be carried out.
[13] R. M. Haralick and L. G. Shapiro. Computer and Robot Vision (Vol-I). Addision-Wesley, 1992. [14] B. Matityaho and M. Furst. Classification of music type by a multilayer neural network. Journal of the Acoustical Society of America, 95, 1994. [15] C. Mckay and I. Fujinaga. Automatic genre classification using large high-level musical feature sets. In Intl. Conf.on Music Information Retrieval, 2004.
24
[16] B. Moore, B. Glasberg, and T. Baer. A model for the prediction of thresholds, loudness and partial loudness. J. Audio Eng. Soc, 45(4):224–240, 1997. [17] J.-M. Ren, Z.-S. Chen, and J.-S. R. Jang. On the use of sequential patterns mining as temporal features for music genre classification. In IEEE Conf. on Acoustics, Speech and Signal Processing, pages 2294–2297, 2010. [18]
J. Saunders. Real-time discrimination of broadcast speech/music. In IEEE Conf. on Acoustics, Speech, Signal Processing, pages 993–996, 1996.
[19] U. Simsekli. Automatic music genre classification using bass lines. In Intl. Conf. on Pattern Recognition, pages 4137– 4140, 2010. [20] W.-H. Tsai and D.-F. Bao. Clustering music recordings based on genres. In Intl. Conf. on Information Science and Applications, pages 1–5, 2010. [21] Y. H. Tseng. Content-based retrieval for music classification. In ACM SIGIR Int. Conf. res. Develop. Inf. Retrieval, pages 176–182, 1999. [22] G. Tzanetakis and P. Cook. Music genre classification of audio signals. IEEE Trans. on Speech Audio Processing, 10(5):293–302, 2002.
[25] G. Yu and J.-J. Slotine. Audio classification from timefrequency texture. In IEEE International Conference on Acoustics, Speech and Signal Processing(ICASSP), pages 1677 – 1680, 2009. [26] T. Zhang. Semi-automatic approach for music classification. In SPIE Conf. on Internet Multimedia Management Systems, pages 81–91, 2003. [27] T. Zhang and C. C. J. Kuo. Content-based classification and retrieval of audio. In SPIE Conf. on Advanced Signal Processing Algorithms, Architectures and Implementations VIII, 1998. [28] T. Zhang and C. C. J. Kuo. Audio content analysis for online audiovisual data segmentation and classification. IEEE Trans. on Speech and Audio Processing, 3(4):27–36, 2001. [29] T. Zhang and C. C. J. Kuo. Content-based Audio Classification and Retrieval for Audiovisual Data Parsing. Kluwer Academic, 2001. [30] M. Zuliani, C. S. Kenney, and B. S. Manjunath. The multiransac algorithm and its application to detect planar homographies. In IEEE Conf. on Image Processing, 2005. [31] E. Zwicker and H. Fastl. Psychoacoustics: Facts and models. Springer Series on Infromation Science, 1999
[23] C. West and S. Cox. Features and classifiers for the automatic classification of musical audio signals. In Int. Conf. on Music Information Retrieval, pages 531–537, 2004. [24] C. West and S. Cox. Finding an optimal segmentation for audio genre classification. In Int. Sym. on Music Information Retrieval, 2005.
25