Jun 23, 2006 - Schafer developed a simple terminology for describing sounds within a ..... Emotional content was not confined to purely speech, 'pens.
Proceedings of the 12th International Conference on Auditory Display, London, UK, June 20-23, 2006
SOUND AND SOUNDSCAPE CLASSIFICATION: ESTABLISHING KEY AUDITORY DIMENSIONS AND THEIR RELATIVE IMPORTANCE Iain McGregor, Grégory Leplâtre, Alison Crerar and David Benyon School of Computing, Napier University, Edinburgh, UK. {i.mcgregor, g.leplatre, a.crerar, d.benyon}@napier.ac.uk ABSTRACT This paper investigates soundscape classification by using two different forms of data gathering and two different populations. The first method involves a questionnaire completed by 75 audio professionals. The second uses a speak-aloud experiment, during which 40 end users were asked to describe their audio environment. While both approaches are different and target a different audience, they provide an indication of key dimensions for the perception of soundscapes and their relative importance. Contrasts and similarities between the results of the questionnaire and speak-alouds are highlighted. Their implications with regards to the establishment of a set of common terms in order to aid future auditory designs are also discussed. 1.
INTRODUCTION
This paper reports upon two studies which try to establish dimensions for a future classification of inhabited soundscapes. This would aid the future design and evaluation of shared immersive auditory environments through the use of a shared language. The traditional differentiation between auditory professionals and end users, where the former is concerned with the quantitative soundfield, while the latter is only concerned with the qualitative soundscape is an artificial divide. All of us inhabit and contribute to soundscapes, and as such, nothing can ever be designed in isolation. What can be done, is to develop a method of better communicating the experience. Delage [1] points out that if end users have any chance of interpreting the meaning of new sounds then it has “to be in the range of what they already know”. Utilizing a classification system based upon end user descriptions of sound events within a soundscape can provide that insight, and also establish where there is a mismatch between the intended design and its final perception. The first study was a questionnaire targeted at audio professionals. This was originally to survey the knowledge and practice of a wide and heterogeneous community. The answers from 75 respondents were grouped into three categories (designers, acousticians and computer scientists) in order to provide a clear picture of a population that overlaps with the ICAD community. However, this paper is only concerned with a subset of the study that deals with what the respondents considered to be the most relevant dimensions of auditory environments. An attempt was made at establishing a consensus, which was subsequently compared to end users’ experiences. The second study involved 40 listeners, who were asked to describe verbally what they could hear while listening to an enclosed environment under four different conditions, with 10
participants per condition. Recordings were made of the responses, which were subsequently transcribed and coded. This revealed more about the relative importance of auditory dimensions to end users in an everyday listening context. The prioritization of these combined dimensions and their instances into a form of classification could be used to inform the design and evaluation of effective and meaningful sounds and soundscapes. 2.
SOUNDSCAPE CLASSIFICATION
Soundscape classification comes in a variety of forms, the most common are based around: speech and non-speech; or speech, music and other. A number of methods have been developed in order to classify sound events within soundscapes or even complete auditory environments, these can be split into psychoacoustics, semantics, aesthetics and environmental. 2.1. Psychoacoustics Gaver advocated an ecological approach to classifying sounds according to their “audible source attributes”. Sound events are generated by either solids, gasses or liquids and complex sounds can be described by either “temporal patterning, compound or hybrid sources” [2]. The results may be reproduced in map form in order to illustrate the qualitative nature of the sound events, which were heard. Gaver acknowledged that his classification was incomplete, citing the voice, electricity and fire as possible additional candidates of simple sonic events. He went on to say that any definitive classification of a source being “somewhat questionable” due the qualitative nature of listening. The alignment of the physical actions which generated sound events with everyday language did provide a form of eliciting psychoacoustical responses. There was a high degree of potential granularity when patterned, compound and hybrid events were included. 2.2. Semantics In 1998 Bernard Delage collaborated with Heleen Engelen to arrange a “Sound Design Day”, this was by invitation only, and involved architects, acousticians, computer scientists, composers, electroacousticians, scenographers, sound and visual designers all of whom had sound design experience [1]. Whilst debating the role of sound and ergonomy, specifically within the realm of auditory feedback provided by manual tools, the group developed a list for the interactive function of sounds. Examples included warning in terms of being careful, assisting with regards to memory and incitement in terms of readiness for use.
ICAD06 - 105
Proceedings of the 12th International Conference on Auditory Display, London, UK, June 20-23, 2006
Macaulay and Crerar [3] were frustrated by the lack of appropriate auditory models for the interaction designer. In the belief that sound reveals information by situating individual’s inside their soundscape, rather than light which presents information in front, they studied the work of Brewster [4], Feld [5], Gaver [2] and Truax [6] as a basis for formulating a soundscape classification more appropriate to the field of Human Computer Interaction (HCI). The resultant model provided interactive systems designers with a framework for classifying sounds, which was a preliminary step in the move away from contemporary visually saturated interfaces. Macaulay and Crerar proposed a method of classifying constituents of soundscapes based upon (i) sound type, (ii) information category and (iii) acoustical information. The sound type was broken down into music, speech, abstract and everyday. (Subsequently we have found that the ‘abstract’ and ‘everyday’ concepts are more readily described as ‘other known’ and ‘other unknown’. Moore [7] points out the Boolean nature of the perception of sound, as either being perceived as speech or not). The information categories were: visible, hidden, imagined, patterns of events, passing of time, emotions and position in Euclidean space, which allowed an insight into the information content provided to the soundscape inhabitant. Finally the model included acoustical information, (subsequently found to be the level of listening) which could be either foreground, contextual or background. Foreground sounds were those with which the listener actively engaged, contextual sounds provided an underpinning to the foreground, and background were all of the other ‘ambient’ sounds, often not attended to [8]. 2.3. Aesthetics Gabrielsson and Sjorgen [9] set out to establish psychophysical relationships between physical parameters such as frequency response and perceived sound quality. They argued that perceived sound quality should be able to be described through “separate perceptual dimensions”. These dimensions were ideal as a starting point for the aesthetic evaluation of sound events as well as of sound reproduction systems. About two hundred adjectives were given to forty sound engineers, thirty audiologists and one hundred and five people with hearing loss, each adjective was rated for appropriateness when describing the perceived sound quality of speakers and headphones in the case of the sound engineers, and hearing aids in the case of audiologists and people with hearing loss. This resulted in a list of around sixty adjectives being considered suitable. The next stage was to experiment with “normal hearing subjects” on adjective and similarity ratings as well as free descriptions where participants were asked to use their own vocabulary in order to describe the perceived sound quality of a variety of sound reproduction equipment. From this they found that there were predominately two to five dimensions which resulted from each of the experiments, with a final total of eight. The resultant dimensions were associated with clarity, emotional response, spatial cues, dynamics and spectrum. 2.4. Environmental Amphoux [10] was concerned with the interaction of the listener with the soundscape and developed an EMP model. E stood for environmental listening, M for milieu listening and P landscape listening. He argued that it is essential to consider all three forms of listening, each of which had three categories,
with three criteria and three dimensions. Spatio-temporal was the first of the three categories and was broken down into three criteria: scale, orientation and atemporality. Scale represented the comparison between physical space and perceived auditory space with orientation referring to the ability to follow a specific sound within the environment in three dimensions. The fourth dimension of time, being represented through atemporality. Semantic-cultural incorporated publicity, collective memory and naturality. Publicity referred to the overall impression or ‘voice’ that was presented, that of anonymity or congregation, whereas collective memory reflected local anomalies, which were site specific, regulating time or even suggesting a by-gone age. Naturality concerned the weighting of natural to ‘man-made’ sounds and whether there were any narrative elements. Finally sonic material referred to reverberation, sonic signature and metabolic structure. The reverberation incorporated the live-ness, intelligibility of reflections and the complexity of the reflections or echoes. The sonic identity was concerned with whether an area had unique sound such as an unusual bell, or it was stereotypical, and if it was unusual could it have represented a broader area such as a city or country in the manner of a postcard. The metabolic structure incorporated the grouping of sound sources, their relative clarity, as well as their complexity. Hellstrom [11] was also concerned with the concept of place in order to study the individual identities of city quarter soundscapes. He first broke these down into space and character, applying traditional elements of form to complex structures (sound groups): path, node, landmark, edge and district and his own classification of centre, distance, direction, tempo and rhythm for simple structures (individual sounds). Character was split into dynamic and static, static refers to a continuous sound from which no individual sources could be identified, such as an interval conversation at a concert hall where no individual conversation could be heard. Whereas dynamic denoted a widely changing soundscape where sounds rise and fall and are intelligible. Complex structures could be further classified through musical terminology: tonal-atonal, consonant-dissonant, homogeneous-transparent, strong-weak and rhythmicarhythmic, with simple structures having pitch, timbre, articulation, dynamism and duration applied. Hellstrom went on to apply a further set of five categories to each of the sounds identified within the overall soundscape. Each of the categories worked in terms of opposition: Man-made vs. natural, present vs. past, local vs. general, figure vs. ground, and order vs. chaos. Hellstrom applied this method to recordings he made around Klara, in Stockholm, assessing a fountain he found in terms of the character it possessed: a static sonic structure, and was harmonious with hard articulation and strong intensity. In terms of space it had space defining boundaries as well as being a local landmark. Finally he applied three of the five possible categories with the result that there were large variations over day and night and was found to be a ground object with exhibited order. Hellstrom hoped that this form of mediation would contribute to the future design of sonic environments. Under the banner of the World Soundscape Project, Schafer developed a simple terminology for describing sounds within a soundscape as well as terms for describing the clarity [12]. Keynote came directly from music, and was applied to sounds that were fundamental to an environment, like traffic on a road, or birds in a park. Signals were sounds which were actively listened to such as an announcement over a tannoy
ICAD06 - 106
Proceedings of the 12th International Conference on Auditory Display, London, UK, June 20-23, 2006
system. Soundmark was a derivation of landmark and denoted a sound unique to the environment such as Edinburgh’s one o’clock gun. Archetypal represented historical often “mysterious” sounds such as the creak of ancient wood as it settled down. Each sound could further be classified as either centripedal (gathering) or centrifugal (scattering) and the overall soundscape as either Hi-Fi (High Fidelity) or Lo-Fi (Low Fidelity). A Hi-Fi soundscape was one where sounds could be clearly heard against the background, and was usually accompanied by the ability to hear sounds from a distance. The Lo-Fi soundscape was normally associated with city life, where it was difficult to differentiate individual sounds unless they were amplified. Having realized that Schaeffer’s [13] sound object classification only works for “single musical objects” Schafer developed a greatly reduced system suitable for field notes, which he enhanced through additional information about the sound’s setting, estimating distance, intensity, distinctiveness, ambiance, occurrence, and environmental factors such as reverb or displacement. His two dimensional notation denotes attack, body and decay horizontally, and duration, frequency fluctuations and dynamics vertically. Schafer empirically generated a catalogue to record information about the evolution of the soundscape from ‘earwitness accounts’ contained within literature, which was expanded as necessary. From this he was able to track the gradual change from natural sounds to those associated with technology, including a reference to disliking saws by Cicero (c. 70BC). Sonnenschein adapted this work in order to propose a form of the classification suitable for the film industry, as there was no accepted standard [14]. 3.
SURVEY OF AUDIO PROFESSIONALS’ PRACTICE
In order to survey current practice a twenty-question questionnaire was e-mailed as an unsolicited word document to a wide variety of auditory professionals. This was continued until such time as twenty-five responses had been obtained from each of the professions in three areas judged as being the most significant: Acoustics, Computer Science and Design. Email addresses were gleaned from published papers, membership rolls, newsgroups, and web sites. The response rate was approximately four percent. 3.1. Participants Participants were placed into three equal sized groups for analysis according to their responses about their roles and responsibilities: Acoustics, Computer Science and Design. The acoustics group included practitioners in acoustics within a variety of fields, from building acoustics to psychoacoustics. The design group included practitioners generally more concerned with the design and delivery of audio rather than its measurement. It was found that the designers were rarely formally trained. The computing practitioners were generally involved with developing user interfaces incorporating audio, or writing software to manipulate audio. Academics formed the largest part of both the Acoustics and Computing group, while unsurprisingly, the Design group was essentially comprised of sound designers. The primary area of work in which respondents were involved were: Music (13%), Software Development (13%), Psychoacoustics (12%), HCI (9%), Architectural and Building Acoustics (7%), Noise and Vibration Acoustics (7%), Theatre
(7%), Games (5%). Other fields represented included Film, Multimedia, Neuroinformatics, Phonetics, Physics, Physiology, Technology Development, Television and Radio in descending order. Sixty one percent of the participants had been formally trained, while the remaining 39% attributed their expertise to industrial experience only. Acousticians had the highest instance of formal training (76%) with the highest ratio of PhDs (44%). Designers’ qualifications were predominantly in music performance or composition. 3.2. Noise Respondents were asked to provide “definitions of noise and rank them according to relevance to your [their] field”. A wide variety of definitions were provided which were subsequently classified, this provided three clear dimensions which were shared across all three groups: preference (47%), artefacts (40%) and spectral (28%). The most common definition was ‘unwanted sound’ (44%), but there was little consensus across the fields as to a common definition. 3.3. Soundscape All of the participants understood the concept of the soundscape, from either the natural or constructed perspective, but rarely both. One acoustician referenced Schafer [12], while none made reference to the importance of psychoacoustics when inhabiting the soundscape. One acoustician did refer to the importance of the point [of listening], and range of time. Eighty-eight percent had encountered the term soundscape with 43% defining it as a synthesized auditory environment, 33% as the auditory environment and 21% as the perceived auditory environment, which is defined in the literature as being the correct definition [12]. 3.4. Description of Audio The quantitative and qualitative elements of sound events were frequently confused, with classifications or descriptions cropping up in both formal and informal sections of the questionnaire. Participants’ educational background correlated positively with the number of quantitative methods used for measuring sound, as well as the use of formal methods for classifying sounds. Whilst this threw up a large number of measurements of sound, which had not been considered in the research so far, such as ‘coverage’, and ‘clarity’ or ‘intelligibility’, no new forms of classification have been necessary to date. The most common forms of visualizing sound were: waveform, spectrogram, time vs. frequency and musical notation. The participants employed a greater range of adjectives to describe sound events than to describe formal measurements, and these bore a closer relationship to the sounds themselves, specifically their aesthetics, than to the events that created them. Each participant was asked to list ten terms, which they were aware of for describing audio and then rank them according to their importance within their field. These were then classified into dimensions and cross-referenced with frequency and percentage response rate (table 1). Individual terms were later compared with those of the end users in order to develop a method of classification that was meaningful to each group. The three most commonly cited terms by professionals within dynamics were volume (45%),
ICAD06 - 107
Proceedings of the 12th International Conference on Auditory Display, London, UK, June 20-23, 2006
loudness (24%) and level (12%). In spectral it was pitch (17%), timbre (15%) and tone (12%). Aesthetics were brightness (17%), harshness (16%) and warmth (15%). Clarity was quality (11%), intelligibility (8%) and stereo definition (7%). Dimension Dynamics Spectral Aesthetics Clarity Architectural Acoustics Perceptual Type Temporal Reproduction Musical Interacting materials Onomatopoeia Hearing Abilities
Frequency 61 44 38 36 22 20 14 13 13 8 5 4 2
as the ‘soundscape’ and ‘noise’ have no standard accepted definitions, even within the same professional field. 4.
HOW END USERS DESCRIBE A SOUNDSCAPE
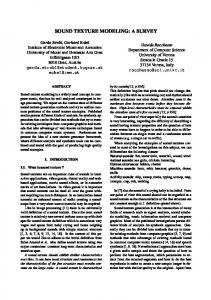
In order to establish how end users describe a soundscape a custom eight channel digital audio recording/replay system, was utilized in order to reproduce the soundfield of the Jack Kilby Computer Centre (JKCC, main computer lab at Napier University, 500 seats, 8000 cubic metres) during a typical afternoon (figure 1). The recording involved eight identical omni-directional tie-clip microphones, with subsequent speaker positioning matching the microphones in both floor position & height. These were positioned into an ellipse at approximately average ear-height when seated, in order to emulate the majority of the inhabitants’ positions. Omnidirectional microphones were chosen in order to maximize any natural reflections as well as to ensure that nothing was “offaxis” as would be the case with directional microphones.
Response 81% 59% 51% 48% 29% 27% 19% 17% 17% 11% 7% 5% 3%
Table 1: Dimensions which audio professionals were aware of for describing audio. 3.5. Description of room acoustics Room acoustics were only fully understood by the acousticians, and even then, there was a distinct variance. Non-acousticians often had picked up a few terms, most commonly ‘reverberation time’ and ‘frequency response’, but were not familiar with the scales upon which they were measured using more abstract terms. Sound designers were the least concerned with the room acoustics, but a couple were concerned with the reproduction quality of the audio hardware of end users. 3.6. Summary Overall there was found to be little overlap of terminology within the professional fields, except in the most general terms. There was also little evidence of a desire to notate, classify and visualize sound events, beyond the standard methods of waveform and spectrograph. There were specific exceptions within acoustics, but sound designers and computer scientists evidenced little need, despite a number of them working on the auralization of data. However, one of the computing technologists utilized a very simple, but effective, method of describing audio: sense of direction; sense of depth; sense of space; sense of movement; distance to events; broadness; naturalness; richness; tone colour and emphasis. Computing participants were comfortable with the term ‘sound event’, whereas sound designers preferred the terms ‘sound’ or ‘audio’, disassociating them from the source. The overall response to the research varied from not seeing the relevance, to requesting access to any published results. An acoustic phonetician suggested that the proposed methods would prove ideal for use within their field, which they felt that sound designers and engineers had traditionally ignored. None of the participants referred to any other researchers working in this area. The questionnaire has established the methods and terminologies audio professionals currently use when notating, classifying and visualizing sounds. It has confirmed that there is a wide range of skills and understanding across the fields closely associated with education, and that many concepts such
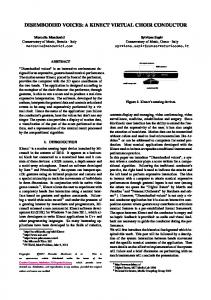
Figure 1. Picture of the 500 seat computing lab in which the soundfield was recorded. The recording was made in a single 30 minute pass onto eight separate channels, a separate eight channel microphone preamp was used to minimize distortion and ensure consistency in both dynamics and frequency. Each channel was recorded at 96kHz and 24 bits, which gave us an theoretical dynamic range of 144 dB and ensured that the full audible range was covered. Calibration between the physical soundfield and its subsequent reproduction was achieved utilizing a sound pressure level (SPL) meter. The meter was set to the C scale and recorded an average of 48dBC, the A scale would have rolled off too much bass, whereas the C scale more accurately represents the acoustic energy present during the recording. For reproduction eight compact monitors were supplemented by four sub bass units, whilst bass transmission can normally be considered omni-directional, the low SPL levels made accurate positioning of low frequency sounds, such as people walking on hollow resonant floors, difficult. The use of four sub bass units resolved this problem, achieving a more accurate representation, than that normally associated with a 5.1 or 7.1 system, where sub bass is normally located in front of the listener. This also compensated for the reduced frequency transmission range associated with compact monitors (Figure 2).
ICAD06 - 108
Proceedings of the 12th International Conference on Auditory Display, London, UK, June 20-23, 2006
experience an almost identical auditory environment, the sounds they generated themselves being the only variant. The physically present groups each experienced a completely unique environment, which extended the number of auditory events that could be described by participants. 4.2. Results Merleau-Ponty’s statement that “it is a matter of describing, not of explaining or analyzing” accurately represents the descriptions provided by participants while speaking aloud and in response to the questionnaire [15]. A number of the participants, who were unaware of where the recording took place, started by trying to establish what the space was they were listening to. This initially took the form of listing the individual sound events and then piecing them together in order to establish the type of environment. ‘Again the same sense of people in the distance doing something... sitting, chatting but all very distance from me say oh... say fifteen, twenty, thirty feet it does still feel that I'm still in a large open space but indoors definitely indoors’. This, then affected their decisions about what sounds they were listening to. 4.2.1.
Figure 2. Representation of the recording/playback system. 8 microphones were used for recording, 8 speakers and 4 subwoofers were used for playback. 4.1. Experimental protocol Forty participants were asked to describe the recorded or natural physical soundfield of the JKCC. Participants’ descriptions were recorded using a standard stereo tie-clip microphone onto a DAT recorder set to 48kHz 16 bit, this allowed an accurate stereo image in order to emulate the participant’s listening experience with reference to their own voice, as well as a source for later transcription. The 40 participants were divided into four groups according to the following conditions: • Condition 1: while physically present in the JKCC for 15 minutes participants were asked to speak-aloud what they could hear. • Condition 2: participants were blindfolded while physically present in the JKCC for 15 minutes and were asked to speak-aloud what they could hear. • Condition 3: participants were exposed to the recorded soundfield for 15 minutes. They were asked to speak-aloud what they could hear. • Condition 4: participants were blindfolded and exposed to the recorded soundfield for 15 minutes. They were asked to speak-aloud what they could hear. The study was conducted over a period of two consecutive weeks. The participants varied with respect to their age, sex and background. All participants took part in the study on a voluntary basis and all were required to have a high command of spoken English. The use of four different groups reduced the effect of bias by including subjects who could see sound sources, as well as those who could only hear them without any visible clues. The recording allowed half of the groups to
Themes
A variety of themes arose with the most prevalent being the source or the “sound of what?” [16], these varied from the vague ‘somebody’ to the more precise inclusion of gender and age in ‘young woman’ detailed by only two of the 40 participants. Vocalizations such as ‘speech’, ‘conversation’ and even ‘cough’ formed the largest detailed group, which corresponds with Cole’s description of children’s preference for speech over non-speech sounds [17]. Nationality and accents were identified, together with content, which was mostly generic ‘saying what’s what’ and ‘asking a question’. Emotional content was not confined to purely speech, ‘pens being clicked in frustration’ as well as ‘nervous juggling of coins in pocket’, four of the participant’s commented on the poor health of some of the inhabitants of the environment. When specifying the source of the sound event most participants were confident of the source even when being generic. A quarter of the respondents did come across sound events, which they could not identify, but this represented a very small amount of the total sound events compared to those, which they felt they could either estimate or identify. Comparisons were made, such as the air-conditioning being ‘like the sea coming from behind me’ or ‘a moving airstrip around me’, but the majority of sources were identified by single words. Materials where described as being ‘metal’ ‘paper’, ‘plastic’ ‘velcro’ or ‘wood’ with the mass described as either ‘heavy’ or ‘large’ but never light or small. Actions, which generated the sound source were then described such as ‘typing’ or the onomatopoeic ‘tapping’. Individual sound events were generally described only once until the event varied or a lack of new sources became evident, at which point the temporal aspect of whether it was ‘constant’ or had just ‘stopped’ were detailed. This varied when applied to vocalizations, which were mentioned mostly whenever heard, even from the same source, further reinforcing the appearance of a predilection for human speech. Physical properties such as dynamics and spectrum featured, with the former, despite being mentioned the most, being mostly confined to ‘loud’ which in turn was translated into the inferred force of the action such as “hitting the keyboard hard”. Silence was only mentioned by its absence,
ICAD06 - 109
Proceedings of the 12th International Conference on Auditory Display, London, UK, June 20-23, 2006
which as Cage discovered does not exist outside a vacuum, even in an anechoic chamber [18]. More interestingly, quiet sounds were rarely mentioned as being quiet, dynamics were mostly considered when they became ‘loud’. Spectral aspects referred mostly to voices with the limitations of ‘deep’ or ‘low’ and the less frequent ‘high’ or ‘higher’. Clarity was referred to in terms of ‘distinct’ or ‘muffled’ with participants not being able ‘make out’ the speech of the recordings, which a few found ‘annoying’. Differentiation between sound sources did occur but more by default rather than considered identification. Quantities of sound sources were identified with accuracy between one and four, otherwise it was a generic ‘few’ or ‘lots’. Only 10% of the participants referred to whom a sound was directed at, which in all instances was speech, with a single reference to masking ‘it drowns out the sound of people talking... well almost...’. Aesthetics were rarely mentioned those that were, being mostly negative such as ‘bland’, ‘drone’ and ‘monotonous’, with spectral aspects referred to as being ‘hard’ or ‘sharp’. The vast majority of sound source locations were described in relation to the participant. They were commonly detailed in terms of left, right front and back with occasional generic references to distance, ‘I'm starting to recognize the sounds constantly coming from the top right from my point of view somebody has just rolled over with their chair along rails in cluster one...’. A few participants specified height both in the physical environment and surprisingly on the recording ‘I'm getting some noise above me to the right...’, which had no height channel, although this is proposed a future series of experiments. Individuals were described as ‘walking up and down steps’ or ‘walking by’, or even moving from ‘left to right’. Whilst descriptions were always generic they illustrated an awareness of moving objects rather than a static auditory environment, ‘there is a bag of crisps flying around... it started on the front left and then went all the way to the back left...’. Context was occasionally described in some detail such as ‘I can tell you that someone is pressing the key... and I can imagine that by the rhythm of their fingers when they press return or press space’ or as a sequence of events ‘checking of keys in their pocket in their left pocket... a checking of a mobile phone... turning it on probably picking up of a bag... of papers stuffing them in... zipping up the bag’. The environment itself was described in terms of its size, ‘large’ ‘open plan space’ with two participants guessing the original location and the others going for either a computer lab or open plan office. When referring to the physical structure participants detailed: ‘door’, ‘floor’, ‘grating’, ‘rails’, ‘steps’ with one participant who experienced the unidentified recording describing a ‘high ceiling’ with ‘plaster walls’. Echoes were described when establishing the room size with sound ‘pinging off the pillars’. Privacy was only considered by a single participant ‘conversation private really...’, whereas pollution, in terms of distraction and annoyance was more evident ‘it's really quite annoying actually... I don't particularly like this environment.’ Five of the participants referred to sounds, which they generated themselves ‘I hear myself talking out loud...’ illustrating how they contribute to their own soundscapes. Immersion was detailed through comments such as ‘I’m really beginning to think that I am sitting in the office and not sitting in a dark room’ and ‘I think if I had eyes I would have turned around to have a look to see who it was’, which were made by participants blindfolded listening to the recorded soundfield.
4.2.2.
Dimensions
Each term was classified in the same manner as with the audio professionals, frequency and response rates were then established allowing a comparison with the results gleaned from the previous study. Source and actions were clearly the most common terms utilized when describing the sound events which the participants heard (table 2). These were both present in 100% of the responses, with source being mentioned more often than actions. Sources ranged from a specific reference to an individual by name through to the more generic ‘bloke’, which retained gender and quantity, ‘somebody’ was utilized the most for a single source and ‘people’ for sources which could not be separated. The use of generic sources such as ‘something’ or ‘keyboard were by far the greatest detailed, even by the group that could see what the sources were. Dimension Source Actions Spatial Dynamics Onomatopoeia Temporal Quantity Clarity Comparison Aesthetics Material Spectral Emotions Pollution Architectural Acoustics
Frequency 938 254 312 129 117 86 77 43 25 39 36 34 24 17 10
Response 100% 100% 88% 80% 75% 73% 68% 53% 48% 45% 40% 35% 35% 28% 20%
Table 2: Dimensions which end users utilized when describing what they could hear. Spatial dimensions were the third most common, with an 88% response rate, most sound sources being located ‘left’, ‘behind’, ‘right’ and finally ‘front’, with ‘behind’ being almost twice as common as ‘front’. Spatial aspects were less important for those who could see and most important for those who couldn’t, with both blindfolded groups having a 100% response rate compared to 70% and 78% for the sighted participants. Surprisingly dynamics such as ‘loud’ and ‘louder’ were slightly more common than onomatopoeia, here the sighted groups mentioned it more than the blindfolded, although it was only referred to a few times by each participant. There were a wide range of onomatopoeic words, with ‘creaking’ being the most common, with the blindfolded groups having referred to it more often than the sighted. Quantity and temporal dimensions were both very generic, with ‘lots’ and ‘continuous’ occurring the most. The remaining dimensions ‘clarity’, ‘material’, ‘spectral’, ‘emotions’, pollution and ‘arch acoustics’ were rarely referred to when compared to source and action typically by a factor of approximately 40:1. However the results do illustrate that some of the participants were aware of dimensions associated with musical listening as well as providing an insight into the terms used. Which in the case of ‘spectral’ were predominantly ‘low’, ‘deep’ or ‘high’. Technical terms such as kHz had no place in their responses with only a single participant referring to frequency, and even then only once. Material was not mentioned at all by the sighted group within the physical
ICAD06 - 110
Proceedings of the 12th International Conference on Auditory Display, London, UK, June 20-23, 2006
environment, and architectural acoustics were only referred to once by the same group. Only a single participant, who was listening to the recording blindfolded, mentioned all of the dimensions with two more detailing thirteen out of the fourteen. At the other end of the scale three participants only referred to source and actions with a third adding spatial references only. Otherwise participants averaged seven to eight dimensions. Source was more prevalent for each group over actions. The results clearly indicate the importance of source and action when describing sound, but they also show that participants are aware of other dimensions and have a broad vocabulary with which to describe them. The use of structured classification as used when mapping the soundscape should increase the response beyond the predominant source and action, with the speak-aloud transcription providing an insight into how the relevant categories can be expanded. Clarity, emotions and pollution had not been considered for mapping, but with a respective response rate of 53%, 35% and 28%, we are planning to incorporate them into future experiments. Interestingly, participants only referred to noise as unidentified sound sources, rather than as an unwanted sound source or as a sound event without an identifiable pitch. A trend was noticeable for actions and sounds to be described indifferently with onomatopoeia. For instance, ‘I heard a click’ may refer to a click sound or to the clicking action. This blur may be regarded as a language-dependant feature which, to the best of the author’s knowledge is quite sensitive in the English language in comparison to French, Spanish or Italian, for example. 4.3. Summary Overall responses varied dramatically in quantity and quality. The most basic was a series of sound events without sources or locations, ‘talking… walking… talking… talking… talking… walking…’. Whereas the other extreme provided rich detailed information about both the sound sources and their context, ‘Somebody is sitting in front of me and I can hear the typing quite clearly... he types quite strongly when he used the mouse I think ... the space on it.’ What is clear though, is that the information gathered reflects the experience of inhabiting a soundscape with each individual experiencing as a unique event, rather than a soundfield, which can only be recorded or quantified. The act of speaking aloud while inhabiting a soundscape gives an insight into what Rodaway refers to as ‘the relationship between sense and reality’ [19]. 5.
DISCUSSION AND CONCLUSION
The two studies presented in this paper involved two clearly distinct methods, and as such, comparisons between the results should be carried out with care. Yet, the differences between the way audio professionals conceptualize, communicate and represent sounds and the way end users describe it are worthy of discussion. Lessons can be learnt regarding the following points: (1) Communication with users about auditory interfaces. (2) Design of auditory interfaces. (3) Collection of feedback in user studies. Given the nature of the speak-aloud study, it was expected that participants would favor everyday listening when giving descriptions of their environment. However, what was unknown was the relative importance of auditory dimensions based on their descriptions and how this compares to the auditory dimensions reported by audio professionals (table 3).
Dimension Dynamics Spectral Aesthetics Clarity Architectural Acoustics Spatial Temporal Onomatopoeia Source Actions Quantity Comparison Material Emotions Pollution Perceptual Type Reproduction Musical Hearing Abilities
End User Response 80% 35% 45% 53% 20% 88% 73% 75% 100% 100% 68% 48% 40% 35% 28% N/A N/A N/A N/A N/A
Audio Pro Response 81% 59% 51% 48% 29% 27% 17% 5% N/A N/A N/A N/A N/A N/A N/A 27% 19% 17% 7% 3%
Table 3: Comparison of dimensions used by end users and audio professionals. Overall, if source and actions are discounted, then most common dimension for both groups was dynamics. The end users referred to this in terms of high or low whereas the professionals were more interested in the scale whether it was volume, loudness or level, when specific terms were used they mostly related to the upper end of the chosen scale. Spectral terms were detailed in the same manner, end users again using high or low, with the professionals concerned with pitch, timbre, tone and frequency, respectively. The audio professionals referred to noise as sounds with particular spectral properties, or related to artifacts, or unwanted sounds. This contrasts with the way end-users use the term noise: predominantly to refer to an unidentified source. Some interesting similarities were also noticed. Both groups predominantly made aesthetic judgments in negative terms. This is not surprising for the speak-aloud study, as the environment participants were asked to describe didn’t offer much to be aesthetically enthusiastic about. On the other hand, the fact that professionals submitted a majority of negatively aesthetic terms suggests that we are more used, or more effective at experiencing/or at least communicating negative experiences regarding our auditory environment than positive ones. Both groups also described room acoustics in similar terms, principally referring to reverberation or echo. No noticeable knowledge gap was noticed in this area. Clarity judgments were consistently made on a binary scale in both groups. For example, the professionals used terms such as rough, smooth, transparent, muffled, dirty, clean. The end users described events in similar fashion, without any moderating adverbs. Temporal aspects were referred to predominately in terms of pace and timing by the professionals, with the computing specialists being most concerned. Constancy concerned the end users, whether it continuous or intermittent. Both emotions and pollution were referred to by the non – professional group, but not by the audio pros, this is probably due to the nature of their work. Practitioners are usually
ICAD06 - 111
Proceedings of the 12th International Conference on Auditory Display, London, UK, June 20-23, 2006
working in acoustic isolation, a sound designer for an interface does not have to routinely consider the auditory environment into which their work will be experienced. In contrast endusers cannot easily isolate themselves to the same degree, even when using headphones. An understanding of the way in which end users experience sound pollution and what they class as pollution would benefit the greatly the design of auditory interfaces. Often it is only a small element of an overall design, which commonly can lead to the audio within a device to be disabled completely. Emotional responses are a mainstay in music and sound design for the entertainment industry. But are rarely formally analyzed, being confined to an individual’s experience. Emotional content was mentioned by 35% of the end users and included to varying degrees all of the six basic emotions: surprise, anger, sadness, disgust, fear and happiness. The predominant terms related to happiness, followed by fear. Currently effective auditory design is conducted in isolation to the end user, and if end user testing is conducted then trained users are usually preferred in order to communicate effectively the experience [20]. But when we all inhabit our soundscapes we don’t think in terms of the measurable soundfield, we resort to identifying what the source is and what the action was and where it is coming from. End users are aware of the dimensions which tax designers, such as clarity and aesthetics, but they come after the key dimensions of source and action have been established. The use of spatial cues is commonly shied away from during design, due to reproduction problems with accuracy and the existence of a “sweet spot” [21]. End users described a more blunt left, right, front, back orientation, which with the increasing use of HRTF headsets and 5.1 surround sound systems should encourage auditory professionals to worry less about the accuracy of reproduction, and experiment more, if only to increase the apparent clarity due to signal separation effects. Among things to investigate further are the differences between individuals who experienced most of the soundfield as coming from behind them. Film sound designers have been aware of this effect for some time and consequently make sparse use of the rear channels in film soundtracks, referring to a “sweet spot” after which the surround channels become “intrusive” [21]. Further study should also be made into the effect of the participant’s voice when speaking having different acoustic effects than the recorded soundfield. This can be rectified by passing the participant’s voice through an appropriate reverberation unit in order to recreate the effect of speaking in the environment under study. The results from this study will be utilized to create a method of classification for the design and evaluation of augmented auditory environments, through a technique called soundscape mapping. The auditory context of use can be studied by questioning current inhabitants about their perceived soundscape. This is achieved through classifying each sound event. The results, after visualization, are then passed on to the designer for reference purposes. During the design process the designer will consider what they want the end-user to experience, and in the process create their own map using the same classification process. Finally the auditory elements or interface are studied in situ. or within a simulated environment, with new maps being created. A comparison of the subsequent maps will illustrate where the expectations between designers and end-users match, and what impact the new elements have on the pre-existing inhabited shared auditory environment.
6.
REFERENCES
[1] B. Delage, "On Sound Design," presented at Hey, Listen!, Stockholm, Sweden, 1998. [2] W. Gaver, "What in the word do we hear?" Ecological Psychology, vol. 5, pp. 1-29, 1993. [3] C. Macaulay and A. Crerar, "'Observing' the workplace soundscape: Ethnography and auditory interface design," presented at ICAD 98, International Conference on Auditory Display, University of Glasgow, UK, 1998. [4] S. A. Brewster Providing a Structured Method for Integrating Non-Speech Audio into Human-Computer Interfaces, PhD thesis, Department of Computer Science. 1994, University of York: York. [5] S. Feld, Sound and Sentiment: Birds, Weeping, Poetics and Song in Kaluli Expression. 1990, Philadelphia: University of Pennsylvania Press. [6] B. Truax, Acoustic Communication. 2nd ed. 2001, Norwood: Ablex Publishing Corporation. [7] B. C. J. Moore, An Introduction to the Psychology of Hearing, 4th ed. ed. London: Academic Press, 1997. [8] McGregor, I.P., A. Crerar, D. Benyon, and C. Macaulay, Soundfields and Soundscapes: Reifying Auditory Communities. ICAD 2002, 2002: p. 290 - 294. [9] A. Gabrielsson and H. Sjogren, "Perceived sound quality of sound-reproducing systems," Journal of the Acoustical Society of America, vol. 65, pp. 1019-1033, 1979. [10] P. Amphoux, L'identité sonore des villes Européennes. Grenoble/Lausanne: Cresson/IREC, 1997. [11] B. Hellstrom, "The voice of the place: A case-study of the soundscape of the city quarter of Klara, Stockholm.," in Yearbook of Soundscape Studies 'Northern Soundscapes', vol. 1, R. M. Schafer and H. Jarviluoma, Eds. Tampere: University of Tampere, Department of Folk Tradition., 1998, pp. 25-42. [12] R. M. Schafer, The Tuning of the World. Toronto: McClelland and Stewart Limited, 1977. [13] P. Schaeffer, Traité Des Objets Musicaux. Paris: Éditions du Seuil, 1966. [14] D. Sonnenschein, Sound Design: The Expressive Power of Music, Voice and Sound Effects in Cinema: Michael Wiese Productions, 2001. [15] M. Merleau-Ponty, Phenomenology of Perception. London: Routledge, 1962. [16] C. Metz, "Aural Objects," in Film Sound: Theory and Practice, E. Weis and J. Belton, Eds. New York: Columbia University Press, 1985, pp. 154-161. [17] M. Cole, Cultural Psychology: A Once and Future Discipline. Cambridge, MA: The Belknap Press of Harvard University Press, 1996. [18] J. Cage, Silence: Middletown: Wesleyan University Press, 1961. [19] P. Rodaway, Sensuous Geographies: Body Sense and Place. London: Routledge, 1994. [20] Soderholm, M., Listening Test as a Tool in Sound Quality Work: Applied to Vacuum Cleaners, The Marcus Wallenberg Laboratory for Sound and Vibration Research, Department of Vehicle Engineering. 1998, Royal Institute of Technology: Stockholm. [21] W. Murch, "Touch of Silence," in Soundscape: The School of Sound Lectures 1998-2001, L. Sider, D. Freeman, and J. Sider, Eds. London: Wallflower Press, 2003, pp. 83-102.
ICAD06 - 112