Environ Sci Pollut Res (2011) 18:260–269 DOI 10.1007/s11356-010-0373-4
RESEARCH ARTICLE
Source apportionment of PM10 and PM2.5 at multiple sites in the strait of Gibraltar by PMF: impact of shipping emissions Marco Pandolfi & Yolanda Gonzalez-Castanedo & Andrés Alastuey & Jesus D. de la Rosa & Enrique Mantilla & A. Sanchez de la Campa & Xavier Querol & Jorge Pey & Fulvio Amato & Teresa Moreno
Received: 23 February 2010 / Accepted: 29 June 2010 / Published online: 11 July 2010 # Springer-Verlag 2010
Abstract Background The impact of shipping emissions on urban agglomerations close to major ports and vessel routes is probably one of the lesser understood aspects of anthropogenic air pollution. Little research has been done providing a satisfactory comprehension of the relationship between primary pollutant emissions, secondary aerosols formation and resulting air quality. Materials and methods In this study, multi-year (2003– 2007) ambient speciated PM10 and PM2.5 data collected at four strategic sampling locations around the Bay of
Responsible editor: Euripides Stephanou Electronic supplementary material The online version of this article (doi:10.1007/s11356-010-0373-4) contains supplementary material, which is available to authorized users. M. Pandolfi (*) : A. Alastuey : X. Querol : J. Pey : F. Amato : T. Moreno Institute of Environmental Assessment and Water Research (IDAEA)–CSIC, Barcelona 08034, Spain e-mail:
[email protected] Y. Gonzalez-Castanedo Department of Optics and Applied Physics, University of Valladolid, Valladolid 47071, Spain J. D. de la Rosa : A. S. de la Campa Geology Department, University of Huelva, University Campus El Carmen, Huelva 21071, Spain E. Mantilla Fundación Centro de Estudios Ambientales del Mediterráneo (CEAM), Valencia 46980, Spain
Algeciras (southern Spain), and positive matrix factorisation model were used to identify major PM sources with particular attention paid to the quantification of total shipping emissions. The impact of the emissions from both the harbour of Algeciras and vessel traffic at the Western entrance of Mediterranean Sea (Strait of Gibraltar) were quantified. Ambient levels of V, Ni, La and Ce were used as markers to estimate PM emitted by shipping. Results and discussion Shipping emissions were characterised by La/Ce ratios between 0.6 and 0.8 and V/Ni ratios around 3 for both PM10 and PM2.5. In contrast, elevated La/Ce values (1–5) are attributable to emissions from refinery zeolitic fluid catalytic converter plant, and low average V/Ni values (around 1) result mainly from contamination from stainless steel plant emissions. The direct contribution from shipping in the Bay of Algeciras was estimated at 1.4–2.6 μgPM10/m3 (3–7%) and 1.2–2.3 μgPM2.5/m3 (5–10%). The total contribution from shipping (primary emissions+secondary sulphate aerosol formation) reached 4.7 μgPM10/m3 (13%) and 4.1 μg PM2.5/m3 (17%). Keywords Particulate matter . Shipping emissions contribution . PMF . Vanadium . Nickel . Lanthanoids
1 Introduction The scientific evidence of respiratory and cardiovascular illnesses linked to atmospheric pollution has increased the demand for a more efficient control of pollutant emissions (Anderson 2000; Pope et al. 2002; Pope and Dockery 2006). The problem of air pollution is especially important where dense urban populations are exposed to anthropogenic emissions. In such areas, the identification of the
Environ Sci Pollut Res (2011) 18:260–269
261
pollutant sources and a reliable estimation of their contributions to ambient particulate matter (PM) levels are necessary to device air quality improvement strategies. Positive matrix factorization (PMF) model is one of the most commonly used receptor models for PM source identification and apportionment (Paatero and Tapper 1994). This approach has been successfully applied in many studies dealing with air pollution in urban and/or industrial areas (Lee et al. 1999, 2003; Maykut et al. 2003; Larsen and Baker 2003; Kim et al. 2004; Jaeckels et al. 2007; Kim and Hopke 2008; Pandolfi et al. 2008; Amato et al. 2009 among others). However, even though many major cities are coastal and include important port areas, there has been relatively little research on the impact of shipping emissions (Yuan et al. 2006; Kim and Hopke 2008; Minguillón et al. 2008; Viana et al. 2009) despite the growing concern over the effects of such emissions on air quality (Viana et al. 2008; Georgeva et al. 2007; Gariazzo et al. 2007). The marine transport sector is especially polluted due to the use of low-quality residual fuels containing high amounts of sulphur and heavy metals. It has been estimated that approximately 280 million tons of such fuel was consumed on a global level in 2001, a level of combustion which results in global primary PM emission factor of about 1.2–1.7 Tg per year (Eyring et al. 2005; Corbett and Koehler 2003; Corbett et al. 2007). Moreover, the models estimate that SO2, NOx and PM2.5 emissions from the maritime sector around Europe will increase by around 42%, 47% and 55%, respectively, by 2020 (Cofala et al. 2007). However, regulations governing shipping pollutants remain lax and primarily concerned only with
(a)
Urban agglomerate SAN ROQUE
Meteorological
Petrolchemical estate C5Industrial E. de Hostelería plant and oil port C4 Madrevieja E3 Colegio Carteya refinery
E6 E. de FFCC station San Roque
Industrial estate LOS BARRIOS
2003-2007
(b)
N NNW 20% 15% NW
Oil refinery IN TERQ UISA
Power plant LOS BARRIOS C6 Cortijillos S1 Colegio Metallurgic (LB) industry A3 Los Barrios ACERINOX
S3 Paso a nivel
the sulphur content of bunker fuel (2005/33EC Directive for EU ports). The lack of source apportionment studies on the shipping contribution to PM could at least in part account for the poor mitigation strategies adopted by this sector. However, a major potential problem with source apportionment studies is that the fingerprints of direct vessel emissions, mainly V and Ni, are emitted from all sources using fuel oil and that receptor models such as PMF are not able to clearly separate particulate sources with similar chemical tracers. In the literature, the source traced by V and Ni is frequently interpreted as residual/ fuel oil combustion from industrial processes, such as power plants and/or oil refineries (Viana et al. 2008). When industrial estates coexist with ports, the V–Ni source is likely to be interpreted as a mixed industrial/ shipping source (Amato et al. 2009). In recent studies performed in Hong Kong (Yuan et al. 2006) and Los Angeles (Minguillón et al. 2008), the ambient levels of V and Ni have been directly related to vessel emissions mainly because of the proximity of the measurement sites to the port despite the presence of petroleum refineries. Other studies have evaluated the contribution of shipping to ambient PM by combining receptor models and meteorological data (Kim and Hopke 2008; Viana et al. 2009). This study seeks to evaluate the sources of anthropogenic air pollutants around the Bay of Algeciras (Southern Spain), with special emphasis on the quantification of the contribution of shipping emissions to ambient PM levels. This area is noted for the high density of maritime traffic
PUENTE C2 Economato MAYORGA C1 Campamento
POLÍGONO PETROQUÍMICO
CTLB
WNW
43%10%
W
Paper mill
E7 El Zabal
E5 Palmones
LA LÍNEA DE LA CONCEPCIÓN
Bay of
40% ESE
SW SSW
A1 La Línea
SE SSE S
Algeciras Gibraltar
BAHÍA DE LA LINEA ALGECIRAS Port of (LL)
E4 Rinconcillo
Algeciras
N NNW NW
GIBRALTAR
imp1 ALGECIRAS ALGECIRAS
N
0
2.5
WNW
Gibraltar (UK)
(AL)
A2 Algeciras
W
15
m/s 10
NNE NE ENE
5
E
0
WSW
ESE
SW SSW
5 Km 0
E
0%
WSW
Bay of
CELUPAL
ENE
5%
(PMY)
C3 Guadarranque S8 Guadacorte
S2 Depósito
NNE NE
SE SSE S
1
2 km
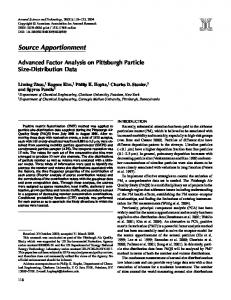
Fig. 1 a Area under study (Bay of Algeciras); b Frequency of occurrence (%) of hourly wind directions for the 2003–2007 period. Stars indicate the location of measurement sites
20 16 18 16 73 0.8 0.7 0.8 5
26 15 13 11 84 0.7 0.5 0.6 3
0.4 21 32 17
0.5 23 30 25
Cr Mn Ni Cu Zn As Se Rb Sr
17.1 2.6 1.0 1.0 0.2 2.0 2.9 0.3 0.3 0.5 3.7 3.0 1.0
40.9 4.8 1.0 1.6 0.3 2.3 2.2 0.4 0.5 0.5 6.0 4.0 1.3
PM TC Al2O3 Ca K Na Cl Mg Fe ssSO42− nssSO42− NO3− NH4+ ng/m3 Li P Ti V
SD
30 32 Mean
12 8 13 11 53 0.5 0.4 0.3 1
0.2 7 7 21
23.4 4.6 0.3 0.3 0.1 0.5 0.3 0.1 0.0 0.1 5.0 1.1 1.6
30 30 Mean
16 9 8 9 57 0.5 0.3 0.2 1
0.1 6 6 13
8.9 2.4 0.3 0.3 0.1 0.4 0.3 0.1 0.0 0.1 2.9 1.1 1.2
SD
PM2.5 (N=195)
PM10 (N=204)
EWD (%) WWD (%) μg/m3
Mar 2003– Dec 2007
Mar 2003– Dec 2007
Meas. periods
La Linea (LL)b
13 13 12 13 62 0.6 0.6 0.7 4
0.4 21 27 19
31.9 3.9 0.9 1.2 0.3 1.5 1.1 0.3 0.0 0.4 5.2 3.0 1.1
34 32 Mean
20 13 13 14 97 0.7 0.3 0.6 3
0.4 12 28 16
14.4 2.6 1.0 1.0 0.2 1.2 1.6 0.2 0.0 0.3 3.4 2.0 1.0
SD
PM10 (N=179)
Feb 2003– Dec 2007
Los Barrios (LB)
8 7 9 13 42 0.3 0.3 0.3 1
0.2 10 10 16
21.8 3.6 0.4 0.5 0.1 0.5 0.3 0.1 0.2 0.1 4.9 0.9 1.3
28 28 Mean
13 6 6 9 55 0.2 0.2 0.3 2
0.2 7 13 13
8.4 2.4 0.5 0.6 0.1 0.4 0.7 0.1 0.2 0.1 3.0 0.9 1.0
SD
PM2.5 (N=79)
Feb 2005– Dec 2007
6 8 11 23 39 0.5 0.5 0.6 4
0.4 18 31 25
37.2 7.0 0.8 1.1 0.3 1.6 1.6 0.3 0.0 0.4 4.6 3.5 1.4
27 38 Mean
8 9 9 12 42 0.4 0.3 1.0 5
0.8 17 66 23
19.2 3.4 1.6 1.0 0.3 1.0 1.3 0.2 0.0 0.3 3.2 2.5 1.2
SD
PM10 (N=79)
Aug 2003– Jul 2004
Algeciras (AL)b
Table 1 Mean PM10 and PM2.5 levels and chemical composition measured at LL, LB, AL and PMY
4 4 8 12 27 0.4 0.3 0.2 1
0.1 9 6 20
24.2 6.2 0.3 0.3 0.1 0.4 0.5 0.1 0.0 0.1 3.8 1.2 1.5
26 37 Mean
5 4 8 8 35 0.3 0.2 0.3 2
0.2 11 7 21
11.7 3.7 0.6 0.3 0.1 0.2 0.4 0.1 0.0 0.1 2.7 1.5 1.3
SD
PM2.5 (N=82)
Aug 2003– Jul 2004
18 21 24 27 78 0.7 0.6 0.8 5
0.5 28 31 32
40.5 4.7 1.2 1.6 0.3 2.1 1.6 0.4 0.0 0.4 7.0 3.7 1.3
25 25 Mean
PM10 (N=120)
Sep 2004– Dec 2007
0.3 14 19 38
12.2 2.6 0.8 1.0 0.1 1.4 2.0 0.2 0.0 0.5 2.9 2.1 0.9
33 20 27 17 147 0.7 0.3 0.5 2
SD
Puente Mayorga (PMY)
1.9–8.2 3.9–22.8 1.9–7.3 7.5–48.5 14.5–97.3 0.3–1.5 0.3–1.1 0.5–1.8 3.0–9.7
0.2–0.7 NA 17.6–82.9 2.0–15.3
27.8–49.2 3.9–11.3 0.6–1.9 0.7–2.9 0.3–0.5 0.4–3.9 0.5–1.2 0.1–0.7 0.3–1.0 NA 2.6–5.9 1.6–5.4 0.8–2.0
Min–max
PM10
Urban rangea
1.0–4.5 1.6–9.6 1.0–5.2 3.0–40.0 11.0–69.0 0.3–1.1 0.2–0.8 0.2–0.7 0.9–1.9
0.1–0.3 NA 6.0–26.0 1.5–9.5
NA NA NA NA NA NA NA NA NA NA NA NA NA
Min–max
PM2.5
262 Environ Sci Pollut Res (2011) 18:260–269
263
passing through the Gibraltar Strait and docking in the highly industrialised Bay of Algeciras which lies immediately west of Gibriltar itself (Fig. 1). The estimation of the pollutant sources and their contribution was obtained by applying the PMF model to both PM10 and PM2.5 speciation data collected over a period of 4 years at four monitoring sites around Algeciras Bay. Given the complexity of air pollution sources in the area, the contributions from shipping and specific industrial emissions were estimated by coupling PMF results, wind data, V and La ambient concentrations and V/Ni and La/Ce ratios.
2 Experimental section
Data for PM10, PM2.5 and chemical constituents at LL and AL for the period 2003–2004 have been also presented in Querol et al. (2007)
2.1 Study area
b
Range of mean annual concentrations of trace elements at urban site in Spain (from Querol et al. 2007). Grey bold concentrations are higher than the urban range. Non-sea salt sulphate (nssSO42−) calculated as in Mészáros (1999)
NA not available
a
0.5–3.7 0.5–4.3 0.1–0.2 0.1–0.5 5.5–40.3 0.5–4.4 0.9–10.8 0.2–0.6 0.4–1.3 6.9–57.1 1.3 1.2 2.1 0.9 9 1.0 0.7 0.2 0.3 6 0.9 0.6 0.2 0.2 6 1.7 1.2 0.4 0.7 7 1.8 1.5 0.4 0.5 8 0.4 1.0 0.3 0.3 4 0.5 0.5 0.2 0.3 5 0.8 0.7 0.5 0.5 9 0.8 0.7 0.5 0.6 8 0.8 0.5 0.2 0.2 10 0.9 0.5 0.2 0.2 9 1.2 1.0 0.5 0.5 11 1.4 1.2 0.5 0.7 12 Sn Sb La Ce Pb
PM10 (N=120) PM2.5 (N=82) PM10 (N=79) PM2.5 (N=79) PM10 (N=179) PM2.5 (N=195) PM10 (N=204)
Feb 2005– Dec 2007 Mar 2003– Dec 2007 Mar 2003– Dec 2007
Feb 2003– Dec 2007
Aug 2003– Jul 2004
Aug 2003– Jul 2004
Sep 2004– Dec 2007
1.2 0.9 2.9 0.6 9
PM10
PM2.5
Environ Sci Pollut Res (2011) 18:260–269
Algeciras Bay is located at the southern end of the Iberian Peninsula, is around 10 km long by 8 km wide, covers an area of approximately 75 km2 and opens to the south into the Strait of Gibraltar and the Mediterranean Sea (Fig. 1). The area hosts one of the largest industrial estates in the Autonomous Community of Andalusia (Southern Spain) and one of the most important ports in Spain. The heavy industry here includes the largest oil refinery in Spain with associated petrochemical installation, oil- and coal-fired power plant, and a stainless steel manufacturing plant. Surrounding these industries are urbanised agglomerations with a high population density. Algeciras is the largest town (115,000 inhabitants) and its port leads the field in marine traffic transport in Spain, attaining a total traffic of 74.8 million tons in 2008 with more than 20,000 registered ships (http://webserver.apba.es/apba/Memoria2008/index. html). Maritime traffic is particularly heavy in the Strait of Gibraltar given its location connecting the Atlantic Ocean to the Mediterranean Sea. 2.2 Wind measurement and meteorology The area around the Bay of Algeciras presents peculiar atmospheric dynamics favouring the development of two main wind patterns, namely easterly and westerly winds. The hourly wind data collected at a tower 15 m high, located close to the oil-fired power plant (Fig. 1a), were used as a reference for the whole area. The occurrence of hourly winds blowing from the east (E–SSE; 90°–157°) and the west (W–NNW; 270°–337°) was 40% and 43%, respectively, during the 2003–2007 period (Fig. 1b). Another important characteristic of the wind direction was its persistence, with little or no change observed over the 24-h period and with generally high velocities (6–12 m/s). Thus, the days characterised by constant easterly (east wind days, EWD) and westerly (west wind days, WWD) winds
264
accounted for about 30% and 40% of the entire wind dataset, respectively. The remaining 30% of the days were characterised by mixed hourly east and west wind directions. 2.3 PM sampling and analysis The PM monitoring stations selected for this study were located in four urbanised areas classified as urban/industrial background sites. The sites are (Fig. 1a): (1) Los Barrios (LB; 36°11′7.39″ N, 5°29′33.89″ W; 22,000 inhabitants); (2) La Linea (LL; 36°9′40.24″ N, 5°20′53.72″ W; 64,000 inhabitants); (3) Algeciras (AL; 36°7′47.21″ N, 5°26′51.71″ W; 115,000 inhabitants); and (4) Puente Mayorga (PMY; 36°10′54.60″ N, 5°23′8.32″ W; 2,000 inhabitants). PM sampling was carried out using high-volume samplers equipped with PM10 and PM2.5 inlets (TISCH or GrasebyAndersen, 68 m3 h−1) at a rate of one or two 24-h filters per week at all stations, except for PMY where only PM10 was sampled (Table 1). Particles were collected on quartzfibre filters and analysed following the procedure described by Querol et al. (2008) for total carbon (TC) by elemental analysis, major (Al, Ca, K, Mg, Fe, Ti, Mn, P, Na) and 46 trace elements by inductively coupled plasma atomic emission spectrometry (ICP-AES) and mass spectrometry (ICP-MS), respectively, NO3−, SO42− and Cl− by ion chromatography and NH4+ by specific ion electrode. For analysis control, reference material NIST 1633b was added to a fraction of a blank filter to check the accuracy of the analysis of the acidic digestions: detection limit and accuracy were estimated in 0.4 ng/m3 and 2% for ICP-AES and 0.02 ng/m3 and 3% for ICP-MS. For ion chromatography and specific ion electrode, the detection limit and accuracy were 0.4 μg/m3 and 10% and 0.3 μg/m3 and 2%, respectively.
3 Model The daily speciation data collected at the four stations were used within the PMF2 model (Paatero 1997) for source identification and apportionment. The PMF model is a factor analytical tool to calculate the contributions and chemical profiles of the sources affecting the receptor site using ambient species concentrations. PMF is based on the weighted least-squares method so that individual estimates of the uncertainty in each data value are needed. Detailed information about the PMF model theory can be found elsewhere in literature (Paatero and Tapper 1994; Paatero 1997; Paatero and Hopke 2003; Paatero et al. 2005). In the present study, individual uncertainties and detection limits were calculated as in Amato et al. (2009) and Escrig et al. (2009), taking into accounts the analytical uncertainties as well as the standard deviations of species concentrations in
Environ Sci Pollut Res (2011) 18:260–269
the blank filters. The number of species used within the PMF model was selected by looking at their signal-to-noise ratio (S/N) and, as proposed by Paatero and Hopke (2003), only species with S/N values higher than 2 were selected for the present study. The data matrix was uncensored, i.e. negative or below detection limit (BDL) values were included as such in the analyses without substituting them with BDL indicators to avoid a bias in the results (End user’s guide to multilinear engine applications from Pentti Paatero). PMF2 was run in robust mode (Paatero 1997), and rotational ambiguity was handled by means of the FPEAK parameter (Paatero et al. 2005). In the present work, the PM (PM10 or PM2.5) data from the four stations were combined into a single input matrix in order to maximise the capability of the model to identify stable sources. The four sites are located in a small area about 10 km apart (LL–AL), thus allowing the collected data to be considered as samples under the influence of the same set of sources. In addition, during the sampling period, no variation in the number or type of anthropogenic activities was recorded. Following this procedure, 582 PM10 samples (collected at LL, LB, AL and PMY) and 356 PM2.5 samples (collected at LL, LB and AL) were used within the PMF2 model.
4 Results and discussion 4.1 Chemistry of PM Table 1 gives the mean levels and standard deviations of PM10 and PM2.5 mass, major elements and trace elements. In this table, the concentrations recorded at the four sites are compared with the range of concentrations at urban background sites in Spain (Querol et al. 2007). The species reported in Table 1 are those used within the PMF model. The levels of PM10 and PM2.5 in Table 1 were similar at LL, AL and PMY. The lowest levels of PM were recorded at LB (31.9 μgPM10/m3 and 21.8 μgPM2.5/m3) mainly as a result of the small size of this urban agglomeration and its distance from the bay when compared with LL, AL and PMY. The levels of chloride (Cl−) and non-sea salt sulphate (nssSO42−) reported in Table 1 are the highest measured in Spain (Querol et al. 2008), with emissions from fuel oil combustion in the area accounting for the high levels of nssSO42−, as it will be shown later. The measured PM10 and PM2.5 elemental concentrations generally do not exceed the typical urban range for Spain, with the notable exceptions of V, Ni and Cr. The lowest concentration of Cr was recorded at AL in both PM10 and PM2.5, this being consistent with the location of Algeciras to the south of the metallurgical plant responsible for most of the Cr emissions around the Bay. Neither the dominant
Environ Sci Pollut Res (2011) 18:260–269
265
easterly nor westerly winds will bring Cr-rich plumes to Algeciras so that average annual Cr concentrations lie within the normal urban range for Spain. In contrast, levels of V and Ni at AL exceed the mean urban range and are comparable with those registered in LL, LB and PMY, the likely reason for this being discussed below. The highest concentrations of V and Ni in PM10 were recorded at PMY, the site that lies closest to the oil refinery and power plants, and it was here where the highest La levels were measured, reflecting emissions from the refinery zeolitic fluid catalytic converter plant (FCC; Moreno et al. 2008).
The contribution of ammonium sulphate to PM10 mass ranged from about 7 μg/m3 at AL and LB (19% and 22% of PM10, respectively) to 9 μg/m3 at PMY (23% of PM10), whilst for PM2.5, it ranged from 6.7 μg/m3 (30.5% of PM2.5) at LB to 7.7 μg/m3 at LL (33% of PM2.5). The highest contribution of the PM10 sodium nitrate factor was observed at LL and PMY with about 5.5 μg/m3 (13.8% and 13.2% of PM10, respectively), decreasing to 4.2 μg/m3 at LB (13% of PM10). The ammonium nitrate factor in the fine mode contributed 1.7 μg/m3 (7.6%), 1.9 μg/m3 (8.2%) and 2.0 μg/m3 (8.1%) at LB, LL and AL, respectively. The contributions of the industrial metallurgical source were estimated at 1.8, 2.0 and 1.5 μgPM10/m3 at LL, PMY and LB, respectively, and at 1.5 and 1.3 μgPM2.5/m3 at LL and LB, respectively. For both PM10 and PM2.5, this source contributed only 0.4 μg/m3 at AL, which, as already described, lies outside the prevalent wind corridor sourcing from the industrial estate (Fig. 1). The crustal source contribution ranged from about 7 μg/m3 (at AL and LB) to about 9 μg/m3 (at PMY) for PM10 and from 2 μg/m3 (AL and LL) to about 3 μg/m3 (LB) for PM2.5. The high crustal contribution at PMY for PM10 was probably due to the handling of dusty material and road dust resuspension by the high volume of truck traffic on the industrial estate. High contribution of the marine factor (about 4 μg/m3 and 10.3% of PM10 mass) was observed at LL, consistent with its position on a narrow isthmus (Fig. 1), as compared with lower contributions at AL and PMY (3.5 μg/m3, about 9% of PM10), and LB (2.6 μg/m3, 8% of PM10). For PM2.5, the contributions of the marine source ranged between 0.9 μg/ m3 at LL and 1.0 μg/m3 at AL and LB. The highest contribution of the traffic source was observed at AL (about 9 μgPM10/m3 and 8.5 μgPM2.5/m3), which accords with the fact that this is the most populated area around the Bay of Algeciras. High traffic contribution was also calculated
4.2 PMF source profiles and contributions Seven sources were selected for the final solution with the PMF model in both PM10 and PM2.5: (1) secondary sulphate (ammonium sulphate [(NH4)2SO4] in both fractions); (2) secondary nitrate (sodium nitrate [NaNO3] in PM10 and ammonium nitrate [NH4NO3] in PM2.5); (3) metallurgical (traced by Cr, Ni, Mn, Zn and Fe in both PM10 and PM2.5); (4) crustal (loaded with typical crustal elements such as Al, K, Ca, Fe, Li, Ti, Rb, Sr and Mg); (5) oil combustion (traced mainly by V and Ni); (6) marine (Na, Cl and Mg); and (7) road traffic (traced by nonmineral carbon from tailpipe and Cu, Sb and Sn from brake wear). In the eight-factor solution, the additional factor did not have a meaningful chemical profile. The chemical profiles of the estimated sources together with the species variation explained by each source are provided in Electronic supplementary material. The PM10 and PM2.5 mean source contributions calculated for the whole sampling periods (Table 1) at each site are shown in Fig. 2. Errors were calculated starting from one standard deviation of the factor scores (G-matrix) calculated by the PMF model. 12
LL
PM 10
10
LB
AL
PMY
0 12
LL
PM 2.5
10
LB
AL
1.7 2.5 2.7 2.2
20.0 19.6 24.9 17.2
10.3 8.0 9.2 8.5
22.9 22.8 19.6 23.5 6.5 6.3 7.0 7.9
2
4.5 4.7 1.1 4.9
4
13.8 22.2 13.2 13.2
6
20.4 22.2 18.9 22.5
8
PMY
27.8 24.5 35.9
Crustal
3.9 4.6 4.1
Ammonium Secondary Industrial Sulfate Nitrate
Oil Marine Combustion
Road Traffic
10.3 8.3 9.5
0
8.8 14.9 8.5
2
8.2 7.6 8.1
4
6.5 6.0 1.7
6
1.3 3.7 3.5
8 33.2 30.5 26.4
Fig. 2 PM10 and PM2.5 source contribution estimates at La Linea (LL), Los Barrios (LB), Algeciras (AL), and Puente Mayorga (PMY). Numbers within bars indicate per cent of mass
Unaccounted
266
Environ Sci Pollut Res (2011) 18:260–269
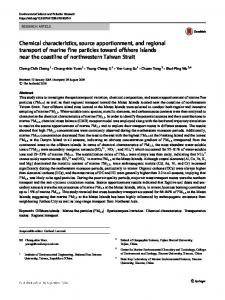
at PMY (about 7 μg/m3 in PM10), presumably as a result of high-duty vehicle movement within the industrial area. Finally, the contribution of the fuel oil combustion source to PM10 and PM2.5 at LL, LB and AL was about 2–2.6 and 1.8–2.4 μg/m3, respectively. On average, the highest contribution of this source was observed at PMY (3.2 μg/m3 in PM10) mainly as a result of the proximity of this site to the oil power station, oil refinery and petrochemical plant. 4.3 Shipping contribution estimate As already discussed, the main limitation of receptor models, such as PMF, is that they cannot separate particulate sources with similar chemical tracers. In the case of our study, the calculated oil combustion source accounts for all the V/Nibearing sources in the area, i.e. fuel oil power plant, petrochemical complex and shipping. However, we can refine our analysis by considering meteorological data, noting specifically the differences in ambient V/Ni and La/Ce ratios on EWD and WWD at each site (Fig. 3). In Fig. 3, the correlation analysis is presented for PM10. The values of the V/Ni and La/Ce ratios and corresponding correlation coefficients (R2) for the PM2.5 fractions are reported within brackets. The temporal trends of the PM10 V/Ni and La/Ce ratios during the whole sampling periods at each station are reported in the inset graphs of Fig. 4. La/Ce values around 0.5–0.6 are typical of natural crustal composition, with higher La/Ce being attributed to the emissions of La from whole sampling period 120 100 80 60 40
whole sampling period
WWD
EWD
V/Ni = 2.7±0.8 R2 = 0.91
refinery FCC. Clear evidence for this is provided by the fact that the highest mean La/Ce values (which reach close to 5) were observed at PMY on WWD (Fig. 3) when oil refinery plant emissions lie directly upwind. Similarly, detectable enrichments in La were observed at LL for WWD (La/Ce= 1.1–1.3) and at LB for EWD (La/Ce=1.4–1.7). The weakest La enrichments (La/Ce around 0.6–0.8) were observed at AL (on both WWD and EWD), LB (WWD), PMY and LL (EWD) when the monitoring sites were being least affected by FCC emissions. Interestingly, under these same meteorological scenarios, V/Ni values were at their highest, lying between 2.1 and 3.1. The lowest values of the V/Ni ratios, between 0.9 and 1.9, were instead recorded at PMY and LL on WWD and LB on EWD when La/Ce values were higher. This observed decrease of the V/Ni values was due to the emissions of Ni from the stainless steel plant, increasing the levels of this element in the atmosphere. Consequently, we interpret the negative correlation between V/Ni and La/Ce ratios as due to contrasting source contributions from, on the one hand, the industrial estate and, on the other hand, from shipping. From the foregoing discussion, it follows that AL station was not affected by pollution plumes directly arriving from the industrial estate lying NNE. Figure 3 shows that only at AL, among the four monitoring stations, were the V–Ni and La–Ce pairs strongly correlated (R2 >0.88) on both EWD and WWD. This high correlation confirms that the high levels of V and Ni measured at AL, with V/Ni ratio of about 3, were due to the shipping emissions, i.e. to a single
V/Ni = 3.0±0.7 R2 = 0.94
4
V/Ni = 2.6±1.2 R2 = 0.88
3
(3.1±0.6) (R 2 = 0.93)
20
(2.7±1.2) (R 2 = 0.88)
V/Ni = 1.8±1.0 R2 = 0.14
0 4
100 80
V/Ni = 1.0±0.7 R2 = 0.01
V/Ni = 2.9±0.7 R2 = 0.78
(1.2±0.8) (R 2 = 0.08)
(2.8±1.0) (R 2 = 0.75)
0
120 100 80
V/Ni = 1.9±0.8 R2 = 0.69
V/Ni = 1.7±0.8 R2 = 0.28
(1.9±1.1) (R 2 = 0.49)
(1.9±1.0) (R 2 = 0.29)
V/Ni = 2.1±2.0 R2 = 0.60
LB
60 40 20
(1.7±0.9) (R 2 = 0.55)
120
V/Ni = 1.7±0.9 R2 = 0.19
100 80
V/Ni = 0.9±0.5 R2 = 0.35
V/Ni = 2.4±1.8 R2 = 0.79
PMY
60 40 20 0
0
20
40
60
80
20
40
60
Ni [ng/m3]
80
20
40
60
80
La/Ce = 0.6±0.1 R2 = 0.93
La/Ce = 1.1±0.7 R2 = 0.35
LL (0.7±0.3) (R 2 = 0.89)
(1.0±0.6) (R 2 = 0.42)
1 0 4
(1.3±1.0) (R 2 = 0.30) La/Ce = 0.7±0.3 R2 = 0.80
La/Ce = 1.4±0.8 R2 = 0.32
La/Ce = 1.1±0.7 R2 = 0.48
3
LB
2 (1.7±0.3) (R 2 = 0.29)
(1.2±0.8) (R 2 = 0.45)
1
0
(0.8±0.3) (R 2 = 0.88)
2
La [ng/m3]
(1.8±0.9) (R 2 = 0.19)
20
(0.8±0.3) (R 2 = 0.89)
La/Ce = 0.9±0.5 R2 = 0.40
3
LL
60 40
La/Ce = 0.7±0.2 R2 = 0.89
AL (0.7±0.3) (R 2 = 0.89)
1
0
120
La/Ce = 0.7±0.2 R2 = 0.93
2
AL (2.8±0.8) (R 2 = 0.90)
WWD
EWD
La/Ce = 0.7±0.2 R2 = 0.91
0 14 12 10 8 6 4 2 0
La/Ce = 2.2±2.6 R2 = 0.24
(0.7±0.2) (R2 = 0.82) La/Ce = 4.9±1.4 R2 = 0.27
La/Ce = 0.7±0.2 R2 = 0.91
PMY
0
1
2
3
4
5
1
2
3
4
5
1
2
3
4
5
Ce [ng/m3]
Fig. 3 Correlation analysis between V–Ni and La–Ce pairs at AL, LL, LB and PMY. Data are reported for PM10. The V/Ni and La/Ce ratios and correlation coefficients (R2) for PM2.5 reported within brackets
Environ Sci Pollut Res (2011) 18:260–269
267
PM10 Fuel oil combustion source contribution [µg/m3]
20 15
8
AL
La/Ce
2.6 µgPM10/m3
V/Ni
3
2.6 µgPM10/m3
10
8
0.6 0
0
5 0 20 15
8
LL
2.7 µgPM10/m3
10
1.4 µg/m3: shipping (EWD)
La/Ce
8
V/Ni
3 0.6 0
0
5 0 20 15
8
LB
La/Ce
8
V/Ni
3 0.6 0
10
0
5 0 20 15
12
PMY
La/Ce
8
V/Ni
3 0.6 0
10
0
5 0
09/01/03
28/07/03
13/02/04
31/08/04
19/03/05
05/10/05
23/04/06
09/11/06
28/05/07
14/12/07
Fig. 4 Temporal series of the fuel oil source contributions in PM10 at AL, LL, LB and PMY. The temporal trends of the PM10 V/Ni and La/ Ce ratios during the whole sampling periods at each station are
reported in the inset graphs on the right. The grey area highlights contemporaneous measurements at AL and LL
source, and not related with the industrial estate. Consequently, we have calculated that shipping oil combustion contributed around 2.6±0.6 μgPM10/m3 (7%) and 2.3± 0.5 μgPM2.5/m3 (9.5%) to ambient aerosol levels at AL site (Fig. 2). These contributions were obtained by averaging the daily contributions of the fuel oil source from PMF over the whole sampling period at AL. The EWD and WWD were used so that the 24-h chemical data matched alternatively one of the two dominant wind directions, thus allowing the location of the fuel oil sources. However, the remaining days were characterised by mixed hourly easterly and westerly winds, both directions preventing the transport of plumes from the industrial estate to AL. This is confirmed by the high correlation (R2 =0.91) observed between the V–Ni and La–Ce pairs over the whole measurement period at AL (Fig. 3). The calculated shipping contribution at AL was due both to proximal emissions from the port of Algeciras as well as from vessels outside of the Bay crossing the Strait of Gibraltar. An attempt can be made to estimate the effect of these more distant emissions from maritime traffic outside of the Bay by taking LL station as reference. Figure 4 shows the temporal series of the fuel oil source contributions in PM10 at each station. The contribution of the fuel oil source at AL and LL during the same period (grey area in Fig. 4) was calculated in 2.6 and 2.7 μgPM10/m3, respectively. The similarity between the La/Ce and V/Ni
values at LL and AL on EWD (Fig. 3) is consistent with LL being affected by shipping emissions occurring outside the Bay on EWD. On these days, the mean shipping contribution at LL was calculated as 1.4 μg/m3 (Fig. 4). By subtracting this value from the total contribution at AL, the contribution of the port was quantified as 1.2 μg/m3. Similarly, in the PM2.5 fraction, the contributions from the port of Algeciras and the vessel traffic in the open sea were estimated to be around 1.1 and 1.2 μgPM2.5/m3, respectively. Table 2 shows the contributions to PM of primary shipping emissions obtained in our study, taking AL and LL as a reference, compared with the relatively few earlier estimates that have been made using receptor models. The shipping contributions estimated from our present work are on average higher with respect to these other studies, as seen in the high levels of V and Ni measured in the Bay of Algeciras, when compared with the available V and Ni measurements in the cited works. Lower contributions were recorded at the Melilla African mainland monitoring site, another busy port lying 240 km to the SE of Gibraltar (Viana et al. (2009), mainly because the lower number of ships recorded annually at the Melilla port (1,500–2,000) compared with the harbour of Algeciras (>20,000). An additional contribution of around 1.2 μgPM2.5/m3 made by shipping emissions to the average background of aerosols present in the open sea is not trivial. At rural background
268
Environ Sci Pollut Res (2011) 18:260–269
Table 2 Comparison between primary shipping source contribution estimates from literature Measurement site
Model
Shipping emissions contributions (μg/m3)
Mean V levels (ng/m3)
Bay of Algeciras (Spain; present study)
PMF
Los Angeles (CA, USA; Minguillón et al. 2008) Seattle (WA, USA; Kim and Hopke, 2008) Melilla (Spain; Viana et al. 2009) Hong Kong (PRC; Yuan et al. 2006)
CMB PMF PMF UNMIX PMF ME2
1.4–2.6 (PM10) 1.2–2.3 (PM2.5) 0.18–0.42 (PM2.5) 0.39–0.47 (PM2.5) 0.8 (PM10) 1.0 (PM10) 0.27 (PM10) 2.1 (PM10)
19–32 (PM10) 16–21 (PM2.5) 7–15 (PM2.5)a 7 (PM2.5)b NA NA
1.8 (PM2.5)
8 (PM2.5)
Barcelona (Spain; Amato et al. 2009)c
11 (PM10)
NA not available a
From Arhami et al. (2009)
b
From Maykut et al. (2003)
c
Shipping+industrial
sites within inland Spain, for example, such levels are comparable to ambient contributions from crustal mineral matter or marine aerosols (Querol et al. 2008). Furthermore, shipping fuel combustion emissions are dominated by very fine, respirable-sized particles which are highly metalliferous in nature. Given the fact that this atmospheric contamination will be present not only in the open seas, but will add significantly to the aerosol burden of coastal towns and cites around the Mediterranean, the incentive for enhanced mitigation of this commonly overlooked pollution source could not be clearer. Moreover, as described by Kim and Hopke (2008), it is possible to calculate the contribution of primary shipping emissions to the levels of secondary sulphate particles by plotting the daily contributions from the primary shipping source with those from the secondary aerosol source calculated by PMF at AL station (Fig. 5). It can be seen that there is a relationship between the secondary sulphate 14
AL
1:1.25
12 10 8 6 4 2 0
0
5
10
15
20
25
Secondary sulfate particles [µg/m3] Fig. 5 Contributions (μg/m3) of the V/Ni-bearing particles from shipping and secondary sulphate particles to PM10 obtained at AL by means of PMF model. 1:1.25 represent the slope of the edge line
particles and the primary shipping V/Ni-bearing oil combustion particles. The purpose of the solid line shown is simply to separate the area of the graph where data points occur and where no data points exist. From the obtained slope of this edge line, it was estimated that about 0.8 μg/m3 of sulphate particles were produced for every 1 μg/m3 of fuel oil burned by shipping at AL. This result is similar to the value (0.83 μg/m3) reported in the study of Kim and Hopke (2008). A good correlation (R2 =0.62) was also observed between ambient nssSO42− concentrations and the shipping contributions at AL, confirming the high contribution of shipping emissions to sulphate aerosols. Consequently, in the case of our work, primary shipping emissions of 2.6 μgPM10/m3 and 2.3 μgPM2.5/m3 produced about 2.1 μgPM10/m3 and 1.8 μgPM2.5/m3 of sulphate particles. Given the high sulphur content of the fuel oil burned by ships, the calculated sulphate is likely to represent direct SO3 emissions that appear as particulate sulphate at the monitoring site after condensation (Schneider and Bogdan, 2003). Similar conclusions were reported by Kim and Hopke (2008) and Amato et al. (2009). By adding the calculated sulphate contribution to the primary shipping emissions, the total contributions from shipping to ambient PM at AL rise to about 4.7 μgPM10/m3 (13%) and 4.1 μg PM2.5/m3 (17%). It may therefore be concluded that shipping is a pollutant source with an important impact on ambient PM levels and air quality, with emissions that may be of the same magnitude or even higher than the punctual industrial emissions. Acknowledgements This work was supported by research projects from the Spanish Ministry of Environment (GRACCIE-CSD200700067 and CALIOPE, 441/2006/3-12.1), the Spanish Ministry of Education and Sciences (DOASUR CGL2007-62505/CLI) and by the Junta de Andalucia. Finally, we would like express our gratitude to Jesús Parga and David Monje for their technical support.
Environ Sci Pollut Res (2011) 18:260–269
References Amato F, Pandolfi M, Escrig A, Querol X, Alastuey A, Pey J, Perez N, Hopke PK (2009) Quantifying road dust resuspension in urban environment by multilinear engine: a comparison with PMF2. Atmos Environ 43:2770–2780 Anderson HR (2000) Differential epidemiology of ambient aerosols. Philos Trans R Soc London, Series A Math & Phys Sci 1775:2771–2785 Arhami M, Sillanpää M, Hu S, Olson MR, Schauer JJ, Sioutas C (2009) Size-segregated inorganic and organic components of PM in the communities of the Los Angeles Harbor. Aerosol Sci Technol 43(2):145–160 Cofala J, Amann M, Heyes C, Wagner F, Klimont Z, Posch M, Schöpp W, Tarasson L, Jonson JE, Whall C, Stavrakaki A (2007) Analysis of policy measures to reduce ship emissions in the context of the revision of the national emissions ceilings directive. Final report submitted to the European Commission, DG Environment, Unit ENV/C1 Contract No. 070501/2005/ 419589/MAR/C1 Corbett JJ, Koehler HW (2003) Updated emissions from ocean shipping. J Geophys Res D Atmos 108(D20):4650–4666 Corbett JJ, Winebrake JJ, Green EH, Kasibhatla P, Eyring V, Lauer A (2007) Mortality from ship emissions: a global assessment. Environ Sci Technol 41:8512–8518 Escrig A, Monfort E, Celades I, Querol X, Amato F, Minguillón MC, Hopke PK (2009) Application of optimally scaled target factor analysis for assessing source contribution of ambient PM10. J Air & Waste Manage 59:1296–1307, ISSN 1047-3289 Eyring V, Köhler HW, van Aardenne J, Lauer A (2005) Emissions from international shipping: 1. The last 50 years. Journal of Geophysical Research 110:D17305. doi:0.1029/2004JD005619 Gariazzo C, Papaleo V, Pelliccioni A, Calori G, Radice P, Tinarelli G (2007) Application of a Lagrangian particle model to assess the impact of harbour, industrial and urban activities on air quality in the Taranto area, Italy. Atmos Environ 41:6432–6444 Georgeva E, Canepa E, Builtjes P (2007) Harbours and air quality. Atmos environ 41:6319–6321 Jaeckels JM, Bae MS, Schauer JJ (2007) Positive matrix factorization (PMF) analysis of molecular marker measurements to quantify the sources of organic aerosols. Environ Sci Technol 41:5763–5769 Kim E, Hopke PK (2008) Source characterization of ambient fine particles at multiple sites in the Seattle area. Atmos Environ 42:6047–6056 Kim E, Hopke PK, Larson T, Maykut N, Lewtas J (2004) Factor analysis of Seattle fine particles. Aerosol Sci Technol 38:724–738 Larsen RK, Baker JE (2003) Source apportionment of polycyclic aromatic hydrocarbons in the urban atmosphere: a comparison of three methods. Environ Sci Technol 37:1873–1881 Lee E, Chan CK, Paatero P (1999) Application of positive matrix factorization in source apportionment of particulate pollutants in Hong Kong. Atmos Environ 33:3201–3212 Lee PKH, Brook JR, Dabek-Alotorzynska E, Mabury SA (2003) Identification of the major sources contributing to PM2.5 observed in Toronto. Environ Sci Technol 37:4831–4840
269 Maykut NN, Lewtas J, Kim E, Larson TV (2003) Source apportionment of PM2.5 at an urban improve site in Seattle, WA. Environ Sci Technol 37(22):5135–5142 Mészáros E (1999) Fundamentals of atmospheric aerosol chemistry. Akadémiai Kiado, Budapest Minguillón MC, Arhami M, Schauer JJ, Sioutas C (2008) Seasonal and spatial variations of sources of fine and quasi-ultrafine particulate matter in neighborhoods near the Los Angeles–Long Beach harbour. Atmos Environ 42:7317–7328 Moreno T, Querol X, Alastuey A, Gibbons W (2008) Identification of FCC refinery atmospheric pollution events using lanthanoid- and vanadium-bearing aerosols. Atmos Environ 42:7851–7861 Paatero P (1997) Least square formulation of robuste non-negative factor analysis. Chemometr Intell Lab Syst 3:23–35 Paatero P, Hopke PK (2003) Discarding or downweighting high-noise variables in factor analytic models. Anal Chim Acta 490:277– 289 Paatero P, Tapper U (1994) Positive matrix factorization: a nonnegative factor model with optimal utilization of error estimates of data values. Environmetrics 5:111–126 Paatero P, Hopke PK, Begum BA, Biswas SK (2005) A graphical diagnostic method for assessing the rotation in factor analytical models of atmospheric pollution. Atmos Environ 39:193–201 Pandolfi M, Viana M, Minguillón MC, Querol X, Alastuey A, Amato F, Celades I, Escrig A, Monfort E (2008) Receptor models application to multi-year ambient PM10 measurements in an industrialized ceramic area: comparison of source apportionment results. Atmos Environ 42:9007–9017 Pope C, Dockery W (2006) Health effects of fine particulate air pollution: lines that connect. J Air Waste Manage Assoc 56:709– 742 Pope CA, Burnett RT, Thun MJ, Calle EE, Krewski D, Ito K, Thurston GD (2002) Lung cancer, cardiopulmonary mortality, and long-term exposure to fine particulate air pollution. JAMA 287:1132–1141 Querol X, Viana M, Alastuey A, Amato F, Moreno T et al (2007) Source origin of trace elements in PM from regional background, urban and industrial sites of Spain. Atmos Environ 41:7219– 7231 Querol X, Alastuey A, Moreno T, Viana MM et al (2008) Spatial and temporal variations in airborne particulate matter (PM10 and PM2.5) across Spain 1999–2005. Atmos Environ 42:3964–3979 Schneider DR, Bogdan Z (2003) Modelling of SO3 formation in the flame of a heavy-oil fired furnace. Chem Biochem Eng Q 17 (3):175–181 Viana M, Kuhlbusch TAJ, Querolr X, Alastuey A, Harrison RM, Hopke PK et al (2008) Source apportionment of particulate matter in Europe: a review of methods and results. J Aerosol Sci 39:827–849 Viana M, Amato F, Alastuey A, Querol X, Saúl G, Herce-Garraleta D, Fernandez-Patier R (2009) Chemical tracers of particulate emissions from commercial shipping. Environ Sci Technol 43 (19):7472–7477 Yuan Z, Lau AKH, Zhang H, Yu JZ, Louie PKK, Fung JCH (2006) Identification and spatiotemporal variations of dominant PM10 sources over Hong Kong. Atmos Environ 40:1803–1815