Ecography 38: 1090–1100, 2015 doi: 10.1111/ecog.01212 © 2015 The Authors. Ecography © 2015 Nordic Society Oikos Subject Editor: Hector Arita. Editor-in-Chief: Miguel Araújo. Accepted 6 January 2015
Using multiple-source occurrence data to identify patterns and drivers of decline in arid-dwelling Australian marsupials Peter J. McDonald, Gary W. Luck, Chris R. Dickman, Simon J. Ward and Mathew S. Crowther P. J. McDonald (
[email protected]), C. R. Dickman and M. S. Crowther, Desert Ecology Research Group, School of Biological Sciences, Univ. of Sydney, NSW 2006, Australia. Present address of PJM: c/o Flora and Fauna Division, PO Box 1120, Alice Springs, NT 0871, Australia. – S. J. Ward and PJM, Flora and Fauna Division, Dept of Land Resource Management, Alice Springs, NT 0870, Australia. – G. W. Luck, Inst. for Land, Water and Society, Charles Sturt Univ., Albury, NSW 2640, Australia.
Many of the world’s terrestrial mammal species are imperilled, but recent extinctions and declines have been most severe in Australia. In particular, arid-dwelling marsupials in a critical weight range (35–5500 g) have declined dramatically following European settlement. In the absence of long-term monitoring, documenting these declines or distribution shifts and their causes often relies on occurrence data from multiple sources. Using atlas records, we compared the distributions of all currently extant marsupials in the critical weight range in Australia’s arid Northern Territory pre- and post-1975. For taxa with evidence of range contraction, we evaluated alternative hypotheses to explain this contraction (i.e. competition, predation, productivity, climate) using several techniques to improve our confidence in the results. Despite a substantial increase in the number of mammal records across the study region post-1975, the bilby Macrotis lagotis and desert form of the common brushtail possum Trichosurus vulpecula appear to have contracted in distribution by 25 and 40%, respectively. These changes in distribution were best explained by hypotheses of competition and climate-change, respectively. Macrotis lagotis was more likely to occur on land without a history of cattle grazing and with low rabbit densities, while T. vulpecula has contracted to parts of its distribution that experience cooler maximum temperatures over the hottest months of the year. For five other taxa (including the vulnerable black-footed rock-wallaby Petrogale lateralis) we recorded increases in distribution post-1975, probably reflecting increased survey effort rather than actual range expansion. We conclude that models using multiple-source occurrence data can provide key insights into the patterns and drivers of contemporary species’ declines, and represent useful tools for conservation.
Many of the world’s terrestrial mammals have undergone contemporary range contractions and are imperilled with extinction (Ceballos and Ehrlich 2002). Twenty-seven percent of land mammal species are classified as threatened, with 3.5% of these critically endangered and facing a high probability of imminent extinction (Schipper et al. 2008). The dominant threats to land mammals are habitat loss or degradation and hunting (Schipper et al. 2008), although invasive species are also an important threat, particularly for smaller mammals that occur on islands (Clavero and Garcia-Berthou 2005, Fisher and Blomberg 2011). Australia has seen the most dramatic of recent terrestrial mammal declines, losing up to 29 species since European colonisation in 1788, including several taxa from offshore islands (Woinarski et al. 2014). At least 39 of the country’s remaining mammal species occupy small fractions of their original distribution, and eight are now restricted to offshore islands (Burbidge et al. 2008). Within Australia, mammal declines have been most pronounced in the arid regions, with arid endemics comprising the majority of extinct taxa (Short and Smith 1994, McKenzie et al. 2007). Although the drivers of Australia’s contemporary mammal declines have not been conclusively established, the 1090
vulnerability of mammals in a ‘critical weight range’ (CWR) of 35–5500 g is well established (Burbidge and McKenzie 1989, Chisholm and Taylor 2007). The CWR applies particularly to terrestrial arid-dwelling species and may not extend into closed forest environments or Australia’s tropical north (Johnson and Isaac 2009, Fisher et al. 2014). The loss of CWR species supports the hypothesis that predation by the introduced domestic cat Felis catus and red fox Vulpes vulpes is a factor contributing to the declines. The cat and fox are important predators of mammals, and the upper end of the CWR coincides with the upper limit of prey taken by V. vulpes (Dickman 1996). Further support for the predation hypothesis includes the observation that arboreal and rock-dwelling mammals within the CWR have been more resilient to decline, with their favoured habitats probably affording some level of protection from predation (McKenzie et al. 2007, Johnson and Isaac 2009). In arid Australia, another major factor implicated in the decline of endemic terrestrial mammals is a reduction in habitat suitability and productivity associated with the introduction of livestock (sheep and cattle) and European rabbits Oryctolagus cuniculus (Burbidge and McKenzie 1989, Morton 1990). In a framework for arid Australian ecology,
Stafford-Smith and Morton (1990) proposed that mediumsized native mammals were largely restricted to more productive landforms and, because these areas are also typically favoured by rabbits and for livestock production, they are the most degraded environments in arid regions. Although the broad applicability of this framework has been criticised (Southgate et al. 2007), subsequent continent-scale studies have found that environmental change associated with livestock and rabbits was important in explaining variation in the attrition of Australian mammals, with increased attrition correlating with grazing by livestock and higher rabbit densities (Johnson et al. 2007, McKenzie et al. 2007). Another factor sometimes implicated in the demise of Australia’s mammals is altered fire regimes (Burbidge and McKenzie 1989, Burbidge et al. 2008), although there is little evidence in support of this (Clarke 2008). Climate change also has been implicated, but evidence again is speculative (Letnic and Dickman 2006). An important reason why the drivers of mammal declines in Australia remain uncertain is that long-term monitoring data are scant, a situation mirrored in many locations worldwide (Magurran et al. 2010, Lindenmayer et al. 2012). In the arid zone, the longest-running mammal monitoring programs were established following the most recent extinction events and are located within a single biome, the hummock grasslands (Dickman 2013). Although these programs have produced substantial insight into arid-zone ecology and mammal population dynamics (Dickman 2013), many arid-dwelling taxa occur outside the hummock grasslands and there are limits on the inferences that can be made beyond this biome. Information on changes in the distribution of mammals can be obtained from museum collections and multiple-source occurrence databases (Shaffer et al. 1998, Griffioen and Clarke 2002, Luck et al. 2010). Such databases contain errors (e.g. geographic bias, observer and spatial errors), although many of these can be accounted for and minimised (McCarthy 1998, Ponder et al. 2001, Aizpurua et al. 2015). Importantly, because these databases are frequently the only sources of records spanning the timeframes and geographic extent required to characterise temporal and spatial changes in species’ distributions, they are currently the best means of potentially uncovering the drivers of these trends (Shaffer et al. 1998). Here, we focus on arid Australian marsupials in the CWR and use a multiple-source occurrence fauna database to: 1) determine whether any species have undergone recent contractions in distribution or range shifts, and 2) identify the broad-scale drivers of any contractions or shifts. Our work includes occurrence records spanning 11 decades from 1901 to 2013, and draws on long-term occurrence data to examine contemporary mammal declines. The results have implications for land management, especially livestock grazing in arid regions, and uncover potentially negative impacts of climate change for a particular mammal species.
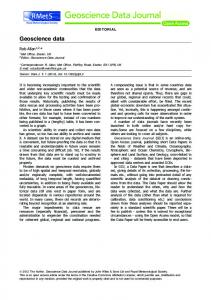
Methods Study region and atlas data We used the 993 729 km2 arid area of Australia’s Northern Territory (NT) as our study region (Fig. 1a). We follow the
‘arid zone’ definition of Williams and Calaby (1985), which includes areas that receive 250 mm of annual rainfall in the south and 500 mm in the north, where rainfall is highly seasonal. We chose the NT because it encompasses all major landform types within Australia’s arid zone (Morton et al. 2011) and includes the core areas of distribution for several threatened marsupials in the CWR, including the bilby Macrotis lagotis, the desert form of the common brushtail possum Trichosurus vulpecula vulpecula (hereafter referred to as Trichosurus vulpecula), and the black-footed rock-wallaby Petrogale lateralis (Kerle et al. 1992, Gibson 2000, Southgate et al. 2007). The NT also has a government-administered, multiple-source, occurrence fauna database, the NT Fauna Atlas, comprising vertebrate fauna records from museum collections, government departments, ecological consultants, community groups, and the public (). Records are vetted for reliability by experienced NT government ecologists before being added to the database. The database contains 903 291 fauna records dating back to the mid-1800s that documents the occurrence of 984 vertebrate animal species. It is the only source of information for long-terms trends in mammal distribution in the region. Evaluating range contraction, and data preparation We included marsupial occurrence records dating back to 1901 in our analysis. These records were split between pre-1975 (including the year 1975) and post-1975 (Fig. 1b). We used 1975 as a cut-off point for comparing the historical and recent distributions of marsupials because 1975 just precedes the last of arid Australia’s contemporary mammal extinctions (Burbidge et al. 1988), coincides with a shift towards increasing temperatures across much of arid Australia (Collins et al. 2000, Hughes 2003) and is just after publication of the first checklist of terrestrial mammals for the Northern Territory that brought together much of the information on known locations of species at the time (Parker 1973). Further, the date is close to 1974 which equalises time averaging (1956) and median sampling effort (1992). Seven marsupial species in the CWR are currently extant in the arid NT (Table 2). Occurrence data for the two mulgara species (Dasycercus blythi and D. cristicauda) were pooled due to the taxonomic uncertainty of many of the records (Pavey et al. 2012, Woolley et al. 2013). For all species, we summed the number of records pre-1975 and post-1975 and estimated the minimum extent of occurrence for each species in ArcMAP 10.2 by creating a polygon encompassing all records, using the Convex Hull in the Minimum Bounding Geometry tool. Polygons were projected to Lamberts GDA94 prior to area calculation and all subsequent spatial work was in this datum. We undertook further analysis individually on any species whose distribution covered less area (contraction) or more area (expansion) area post-1975 compared with pre-1975, applying a minimum threshold of 10%. We produced a grid layer of the arid NT with each grid square covering 625 km2. This resolution was used to overcome finer-scale location errors present in the fauna atlas (e.g. location estimates 1091
Figure 1. (a) Location of the study area, the arid Northern Territory (grey), in relation to major roads and towns, and (b) the change in the total number of mammal records in the arid NT between the periods pre- and post-1975.
from historical accounts, pre-GPS records) and because we were interested in the broad-scale drivers of range contraction (Table 1). Grid cells were assigned the binary form ‘present’ (1) or ‘absent’ (0). Present was defined as any grid cell within which the species was recorded post-1975. Absent was defined as any cell within which the species was recorded pre-1975 but was not recorded in the same cell post-1975. To improve our confidence in assigning a species as absent from a grid cell, we summed records of ‘background’ fauna recorded in both time periods (Table 1). These included records of those species likely to be detected with the same methods used to target the focal species (Supplementary material Appendix 1, 2; Ponder et al. 2001). For range contraction a focal species was considered absent from a cell post-1975 when the number of records of background species post-1975 equalled or exceeded the number of records pre-1975, but the focal species was not recorded. For range expansion, a focal species was considered absent from a cell pre-1975 when the number of records of background species pre-1975 equalled or exceeded the number of records post-1975, but the focal species was not recorded. We also assigned two levels of confidence for designating a species as absent from a grid cell (Table 1). For range contraction, the ‘lower’ confidence level comprised those cells with an equal or greater number of records of background species post-1975 than pre-1975, and the ‘higher’ confidence level was as per the lower confidence level but with a minimum of five background records post-1975. For range expansion, the ‘lower’ confidence level comprised those cells with an 1092
equal or greater number of records of background species pre-1975 than post-1975, and the ‘higher’ confidence level was as per the lower confidence level but with a minimum of five background records pre-1975. We applied a threshold whereby a minimum of 15 grid cells had to meet our requirements for ‘lower’ confidence data. If data did not meet this threshold for a species, then we interpreted the change in distribution as a potential artefact of differences in sampling effort between the two periods. On reviewing the literature on mammal declines in arid Australia, we developed six hypotheses to explain changes in distributions pre- versus post-1975: productivity refuge, predation refuge, competition refuge, climate refuge, predation–productivity interaction refuge, and competition– productivity interaction refuge (Table 3). The productivity refuge relates to early hypotheses for arid Australian mammal decline that predict species will contract or shift to the most productive parts of their distributions, with higher fecundity and fitness buffering losses, particularly through drought (Morton 1990, Stafford-Smith and Morton 1990). We estimated productivity using a normalised difference vegetation index (NDVI) variable, with the median value calculated for each cell from 250 m resolution MODIS satellite imagery (Table 3). The predation refuge predicts that native mammals will contract or shift to places where there are either fewer introduced predators or where habitat affords some level of protection from these predators (Johnson et al. 2007, Letnic et al. 2009). We used predator indices and a ruggedness index to evaluate this hypothesis. The predator indices
Table 1. Methods of dealing with data uncertainty in the NT Fauna Atlas used for modelling drivers of range contraction or expansion. Issue Fine-scale accuracy errors Type I errors (false positive post or pre-1975) Type II error (false negative post or pre-1975)
Method used to reduce uncertainty – – – –
Use database with a high level of quality control (e.g. vetted by biologists). Convert point occurrence data to binary presence/absence using a coarse 25 25 km resolution. Use database with a high level of quality control (e.g. vetted by biologists). Sample randomly from all ‘presence’ cells (e.g. 10) and run separate models with each set of random samples. This works for our data where the presence cells outnumber the absence cells. In other situations this could be achieved by randomly sampling a subset of presence or absence cells. – For modelling range contraction, only assign cells as absent post-1975 and present pre-1975 where there are records of ‘background’ fauna (likely to be detected when targeting the focal species) post-1975. – For modelling range expansion, only assign cells as present post-1975 and absent pre-1975 where there are records of ‘background’ fauna (likely to be detected when targeting the focal species) pre-1975. – Use two levels of confidence; lower 1–4 records, higher 5 records.
were calculated as the % of records that feral cats, red fox and dingo comprise of the total fauna records in each cell (Table 3). The ruggedness index was calculated as the standard deviation of mean elevation in each cell using a 250 m resolution digital elevation model (Table 3). The competition refuge predicts that native mammals will contract or shift to areas of their distribution that are less degraded by introduced herbivores (Morton 1990, McKenzie et al. 2007). We used a land tenure variable and rabbit abundance index to evaluate this hypothesis (Table 3). For land tenure we used a categorical variable with land designated as either cattle production or ‘other’. Cattle production represents cells where the dominant tenure has been cattle production at any stage prior to 1975. Because cattle leases were all established in the period 1901–1975, and mostly in the second half of that period, we consider it an appropriate variable for assessing the influence of the cumulative and interactive effects of grazing pre- versus post-1975. The ‘other’ land tenure primarily consists of Aboriginal freehold, government reserve or vacant crown land. The rabbit abundance variable was calculated as per the predator indices. The climate refuge hypothesis is based on the global trend of species to shift or contract to cooler areas, particularly along elevation gradients, in response to increases in global surface temperature or extreme heatwaves (Moritz et al. 2008). To evaluate this hypothesis we used a modern temperature layer, calculating the median value in each cell from mean maximum summer (December–January) temperature (°C) on an interpolated 2 km grid (Table 3). A contraction or shift towards areas that experience more benign maximum temperatures in the hottest months of the year would be considered support for our hypothesis. Because the impacts of disturbance may interact with other factors such as habitat quality (Anson et al. 2014), we also modelled for interactions between predation and productivity and competition and productivity (Table 3). Data analysis All analyses were run in R (ver. 3.0.3) unless otherwise stated. In order to compare estimates of model parameters, we standardised predictor variables to have a mean of 0 and a standard deviation of 1. We assessed the predictor variables for pairwise correlations using Spearman’s coefficient and for multi-collinearity by calculating variance inflation factors, produced by regressing each variable against all others (Neter
et al. 1996). We removed one of a pair of variables where the correlation coefficient was 0.6 or where the variance inflation factors were 4. A variable was retained if it had a low AICc (from a univariate logistic regression model using all presence and absence grids) and/or were biologically more meaningful (see Results). To test for spatial autocorrelation, we ran a saturated binary logistic regression model for each species (presence 1, absence 0), which included all non-interaction variables that were used in the final models. We used the deviance residuals from these models and the datapoint x and y coordinates to plot correlograms using the R package ‘ape’ (Paradis et al. 2014). We also used ArcMAP 10.2 to calculate a global measure of autocorrelation using the spatial autocorrelation (Moran’s I) tool. Where spatial autocorrelation was detected, through inspection of the correlogram and a significant Moran’s I (p 0.05), we created an autologistic variable that was added to all models included in the final set (Dormann et al. 2007). A criticism of autologistic regression is that the effect size of other predictor variables may be underestimated, particularly where covariates are highly correlated with the autologistic variable (Dormann 2007). However, since our objective was to compare the relative parsimony of several alternative explanatory models, rather than to produce species distribution models, we believe that autologistic regression was appropriate for accounting for spatial autocorrelation. We also screened for pairwise correlations between the autocovariate variable and the other predictor variables using Spearman’s correlation. Because there were typically more presence than absence cells, and in order to reduce the likelihood of false positives (use of erroneous presence records), we randomly sampled from all presence cells to match the number of absence cells (Table 1). This was repeated 10 times for both the lower and higher confidence sets of absence cells (i.e. 10 sets of randomly sampled presence cells matched in turn against the two sets of absence cells). We then ran binary logistic regression models for each of the 10 randomly selected lots of presence cells (1), matched against the absence cells (0). Models were ranked in each set using an information theoretic approach with Akaike’s information criterion (manually adjusted for small sample size; AICc) (Burnham and Anderson 2002). We calculated the difference in criterion values between the best ranked model and model i(Δi), where the model with the smallest AICc has a Δi value of 0. For subsequent models, Δi AICci – AICcmin, where AICci is the AICc of the model being compared with the best ranked model. Models with Δi 1093
2 were considered to have substantial empirical support, values of 2 to 4 to have some support, and values 4 to have little support from the models considered (Burnham and Anderson 2002). We also calculated Akaike weights (wi) to indicate the probability that a model is the best given the available data (Burnham and Anderson 2002). We present all models in at least one of the ten 95% confidence sets (summed wi across models 0.95) and include the modelaveraged coefficient estimate and standard error values for all variables, the number of times the model was present in a 95% confidence set, as well as median values for AICc, Δi and wi. We also present the median Nagelkerke R2 model fit for each model, using the R package ‘rms’ (Harrell 2014).
Results Evaluating range change For all CWR marsupial species in the arid NT, there was an increase in the number of records post-1975 versus pre-1975 and, for at least five species, an increase in the minimum extent of occurrence (Table 2). However, the data for these five species did not meet the minimum confidence requirements for modelling colonisation of cells (15 ‘lower’ confidence absence cells); with 10 of 123 cells for the mulgaras Dasycercus spp., 7 of 164 cells for spectacled hare-wallaby Lagorchestes conspicillatus, 4 of 80 cells for black-footed rock-wallaby Petrogale lateralis, and 1 of 27 cells for Itjarijari Notoryctes typhlops having an equal or greater number of background records pre- versus post-1975. The minimum extent of occurrence of the greater bilby Macrotis lagotis and common brushtail possum Trichosurus vulpecula decreased by 25.8 and 38.4%, respectively (Table 2). The data for both species met our minimum requirements for modelling range contraction with 15 absence cells having an equal or greater number of background records pre- versus post-1975. Drivers of range contraction in the bilby and common brushtail possum Both M. lagotis and T. vulpecula occurred widely across the arid NT prior to 1975 (Fig. 2). After 1975, records of M. lagotis were restricted largely to an area in the north
western arid zone, mostly within the Tanami Desert (Fig. 2a), and records of T. vulpecula were limited to the desert uplands in the southern parts of the study area (Fig. 2b). Our best models for M. lagotis supported the competition refuge hypothesis positing that cattle grazing was associated with the post-1975 contraction in distribution. We also found some support for the role of higher rabbit densities in their decline. There was spatial autocorrelation in the M. lagotis data (Moran’s I 0.29, z 4.13, p 0.001), so we ran all models with and without an autologistic variable (neighbourhood size 4 decimal degrees) (Dormann et al. 2007), as well as a univariate model with just the autologistic variable (Table 4). There were no high correlations ( 0.6) between the autologistic variable and the other predictors. Although the autologistic variable was in all the 95% confidence set models, the addition of other variables, particularly ‘land tenure’ (TENURE), substantially improved model performance (Table 3). Macrotis lagotis was less likely to occur in grid cells where the dominant tenure was cattle grazing (Fig. 2a). This variable was present in all 95% confidence sets of the lower and higher confidence data, and was the only one present in the autologistic model with the lowest median AICc (71.88 or 47.03 for the lower and higher confidence data, respectively), median Δi (0.00 or 0.00), highest median wi (0.47 or 0.34) and second highest median R2 (0.734 or 0.755) (Table 4). The only other autologistic model present in all 95% confidence sets of lower and higher confidence data included also the variable ‘rabbit abundance’ (RABBIT; Table 4). The occurrence of M. lagotis was related negatively to rabbit abundance, although high standard errors relative to model coefficient estimates suggest uncertainty in the strength of the effect (Table 4). This model had a slightly higher median AICc (73.61 or 47.74 for lower and higher confidence data, respectively) median Δi (1.74 or 0.70), a lower or marginally lower median wi (0.21 or 0.28) and a marginally improved median R2 (0.737 or 0.766), compared with the higher ranked model. Two other models were present in more than half the 95% confidence sets of the lower and higher confidence data, including an autologistic model with an interaction term (land tenure: productivity; TENURE:NDVI) and an autologistic model with NDVI (Table 4). Macrotis lagotis occurrence was related negatively to productivity (Table 4). The interaction term received more support than the productivity-alone model, with a lower median Δi (3.39
Table 2. Comparisons of the number of records and known areas of the distributions of all extant mammals in the critical weight range in the arid Northern Territory pre- and post-1975.
Species
Weight (g)
Brush-tailed and crest-tailed mulgara 60–185 Dasycercus blythi and D. cristicauda Greater bilby Macrotis lagotis 800–2500 Common brushtail possum Trichosurus 1200–4500 vulpecula vulpecula Spectacled hare-wallaby Lagorchestes 1600–4750 conspicillatus Black-footed rock-wallaby Petrogale 2800–5200 lateralis Itjaritjari Notoryctes typhlops 40–70
1094
No. fauna No. fauna atlas records atlas records pre-1975 post-1975
Recorded extent of occurrence pre-1975 (km2)
Recorded extent of occurrence post-1975 (km2)
Change in recorded extent of occurrence (%)
169
743
417 394
575 216
37.8
232 89
797 253
702 629 516 391
521 483 317 953
–25.8 –38.4
36
430
340 531
580 470
70.5
119
672
280 881
370 065
31.8
77
83
124 345
330 381
165.7
Table 3. Hypotheses and model variables used to explain the contraction or shifts in the distribution of marsupials in the arid Northern Territory.
Hypothesis 1. Productivity refuge
2. Predation refuge
Predictor variable code and description (median, percentage or dominant categorical value calculated within each 25 25 km grid scale).
Theoretical basis Due to a combination of stresses, species will contract or shift to the most productive parts of their distributions, with higher fecundity and fitness buffering losses, particularly through periods of drought (Morton 1990, StaffordSmith and Morton 1990). Predation by introduced predators is the primary driver of range contraction and species will contract or shift to places with fewer predators or where dingoes (apex predator) or habitat (e.g. ruggedness) afford protection (Johnson et al. 2007, Letnic et al. 2009).
3. Competition refuge
Competition and habitat degradation associated with introduced herbivores are the primary drivers of range contraction or shifts (Morton 1990, McKenzie et al. 2007).
4. Climate refuge
Consistent with global warming, species will contract or shift to the cooler parts of their distribution due to increased stresses associated with higher temperatures (Burbidge et al. 2008). Species will contract or shift to the more productive parts of their distribution where there is protection from predation
5. Predation–productivity refuge
6. Competition–productivity refuge
Species will contract or shift to the more productive parts of their distribution where there is less competition from introduced herbivores
NDVI1: Median of average greenness 2000–2007 (MODIS 250 m resolution using 16-d normalised vegetation index mean)
CAT2: % feral cat Felis catus records from total fauna records FOX2: % red fox Vulpes vulpes records from total fauna records DINGO2: % dingo Canis dingo records from total fauna records RUGGED3: Ruggedness index calculated as the standard deviation of mean elevation from Australia-wide 9 second (approx. 250 m resolution) Digital Elevation Model (DEM) TENURE4: Categorical value indicating dominant land-tenure of grid cell retrieved from cadastre layer. Category 1 various not cattle production (e.g. Aboriginal land, reserve), category 2 cattle production (including any time in last 50 yr) RABBIT2: % European rabbit Oryctolagus cuniculus records from total fauna records SUM_TEMP1: Median of mean maximum daily surface temperature (°C) for December–February averaged over the period 1980–1999. Australian Bureau of Meteorology data, interpolated to daily time step and spatial grid of approx. 2 km NDVI.CAT: Interaction term NDVI.FOX: Interaction term NDVI.DINGO: Interaction term NDVI.RUGGED: Interaction term NDVI.TENURE: Interaction term NDVI.RABBIT: Interaction term
1 Australian
Natural Resource Data Library ( http://asdd.ga.gov.au/asdd/tech/node/brs-4.html ). Fauna Atlas ( www.lrm.nt.gov.au/plants-and-animals/information-and-publications/nt-fauna-observations ). 3National Elevation Data Framework Portal ( http://nedf.ga.gov.au/geoportal/ ). 4Cadastre layer available to NT Government staff ( http://lrm.nt.gov.au/lrm ). 2NT
versus 3.82 and 1.23 versus 4.63 for the lower and higher confidence data, respectively), higher median wi (0.08 versus 0.04 and 0.17 versus 0.04), and improved median R2 (0.702 versus 0.670 and 0.738 versus 0.726) (Table 4). Our best models for T. vulpecula supported the climate refuge hypothesis with a post-1975 contraction in distribution to the cooler parts of its distribution. In analyses for T. vulpecula, ‘summer temperature’ (SUM_TEMP) and ‘ruggedness’ (RUGGED) were highly correlated (Spearman’s r –0.729) and we removed the latter due to it having a higher AICc in a univariate logistic regression (86.81 versus 71.87), as well as it being one of several variables in the predation hypothesis, while summer temperature was the only variable in the climate change hypothesis (Table 3). There was no evidence of spatial autocorrelation (Moran’s I 0.08, z 1.45, p 0.15) so we did not include an autologistic variable in our modelling for this species. Only the summer temperature variable was present in the 95% confidence set of models for the lower and higher confidence data, and T. vulpecula occurrence was related negatively to mean maximum summer temperature (Table 4; Fig. 2b).
Although predator variables were largely absent from the best-ranked models (Table 4), we note that records for the three mammalian predators were relatively patchy across our study area. In the Macrotis lagotis data (total n cells used for modelling 287) there were Felis catus records in 148 cells, Canis lupus records in 110 cells, and Vulpes vulpes records in 46 cells. In the T. vulpecula data (total n cells used for modelling 83) there were F. catus records in 41 cells, C. lupus records in 43 cells, and Vulpes vulpes records in 16 cells.
Discussion Using fauna records from a multiple-source occurrence database, we identified substantial recent contractions in the distribution of two arid-dwelling CWR marsupial species across a vast region of arid Australia. We also produced robust models that offer insights into the drivers of these declines and we take confidence in the similarity of our results between the low and high confidence sets of data. Our results highlight the potential utility of multiple-source 1095
Table 4. Summary of the 95% confidence sets of models explaining the contraction in distribution of Macrotis lagotis and Trichosurus vulpecula in the arid Northern Territory.
Species
Model1
No. times model present in 95% confidence set (from 10 sets)
Median AICc
Median Δi
Median Akaike weight (wi)
Median Nagelkerke R2
10 10
71.88 73.61
0.00 1.74
0.47 0.21
0.734 0.737
6 6 4 4 2 2 2
80.01 83.31 82.77 89.13 87.31 89.47 81.835
3.39 3.82 4.13 6.94 4.18 5.54 6.42
0.08 0.04 0.06 0.02 0.05 0.03 0.02
0.702 0.670 0.673 0.634 0.579 0.630 0.691
1 1
75.98 81.32
1.58 6.92
0.16 0.01
0.667 0.694
1 1
98.48 100.19 155.27
5.02 6.72
0.03 0.01
0.574 0.547
10 10
47.03 47.74
0 0.70
0.34 0.28
0.755 0.766
7 7 6 6 3 2 2 1 1 1
49.16 50.76 51.28 52.36 51.90 55.98 60.97 44.44 54.40 62.24
1.23 4.63 2.31 4.27 4.46 5.87 6.03 4.46 6.47 7.30
0.17 0.04 0.09 0.04 0.03 0.02 0.02 0.03 0.01 0.01
0.738 0.726 0.721 0.712 0.650 0.680 0.615 0.775 0.693 0.643
Macrotis lagotis Lower confidence set (112 data points) AUTO (1.72; 0.37) TENURE (–0.99; 0.30) AUTO (1.65; 0.38) TENURE (–1.02; 0.30) RABBIT (–0.16; 0.33) AUTO (2.19; 0.35) TENURE:NDVI (–0.50; 0.21) AUTO (2.17; 0.35) NDVI (–0.60; 0.26) AUTO (1.68; 0.33) TEMP (0.92; 0.37) AUTO (1.62; 0.28) CAT (1.93; 1.80) AUTO (1.68; 0.28) DINGO:NDVI (1.10; 0.51) AUTO (1.86; 0.32) FOX (2.04; 1.14) AUTO (1.90; 0.34) CAT (1.47; 1.33) FOX (1.82; 1.24) AUTO (2.05; 0.35) RABBIT (–0.08; 0.36) AUTO (2.13; 0.38) FOX (2.47; 1.22) DINGO (0.07; 0.30) AUTO (1.61; 0.27) RABBIT:NDVI (1.46; 0.86) AUTO (1.58; 0.26) null model (–2ll) Higher confidence set (74 data points) AUTO (1.62; 0.46) TENURE (–1.39; 0.39) AUTO (1.40; 0.47) TENURE (–1.49; 0.41) RABBIT (–0.91; 1.81) AUTO (2.50; 0.52) TENURE:NDVI (–0.78; 0.31) AUTO (2.3; 0.47) NDVI (–0.97; 0.41) AUTO (1.79; 0.47) TEMP (2.16; 0.51) AUTO (2.18; 0.47) RABBIT:NDVI (2.69; 1.27) AUTO (2.26; 0.49) DINGO:NDVI (1.14; 0.59) AUTO (1.76; 0.38) CAT (2.15; 1.65) AUTO (1.92; 0.40) AUTO (2.60; 0.55) FOX:NDVI (4.30; 1.67) AUTO (2.26; 0.48) CAT:NDVI (0.80; 0.54) AUTO (1.55; 0.33) CAT (1.94; 1.49) DINGO (0.15; 0.44) null model (–2ll)
102.59
Trichosurus vulpecula Lower confidence set (76 data points) SUM_TEMP (–1.76; 0.44) null model Higher confidence set (58 data points) SUM_TEMP (–1.75; 0.46) null model 1 See
10
68.91 91.495
0.00
1.00
0.450
10
57.54 80.405
0.00
1.00
0.495
Table 2 for variable definitions.
occurrence databases for documenting and understanding mammal declines and distribution shifts, particularly where there are no alternative long-term datasets. Our approach is similar to that in previous studies using occurrence data from natural history collections (Pergams and Nyberg 2001, Jeppsson et al. 2010, Pyke and Ehrlich 2010). Although collection databases may have fewer errors than occurrence data from multiple sources (e.g. misidentifications), by using multiple-source data we were able to draw on more occurrence records collected over a larger area. For example, had we relied on museum collection data for M. lagotis, we would have had 23 records post-1975 rather than the 797 records from multiple sources. The chance of misidentifying highly distinctive species such as M. lagotis 1096
and T. vulpecula also is probably very low, further enhancing confidence in our use of multiple-source data. With increased restrictions on collecting vertebrate specimens (Remsen 1995), we argue that multiple-source occurrence databases will become an increasingly important source for documenting faunal distribution shifts. Further, we suggest our extension of the use of background records to assign multiple levels of confidence is an effective way to improve the inferential value of models using multiple-source occurrence data. The apparent increase in extent of occurrence we recorded for five CWR marsupials post-1975 is likely associated with increases in human population density and biological survey effort in the study region in that period, rather than
Figure 2. (a) Locations in the Northern Territory of pre- and post-1975 records of Macrotis lagotis in relation to history of cattle production, and (b) location of pre- and post-1975 records of Trichosurus vulpecula in relation to maximum summer temperature.
representing actual range expansions. This is reflected in the substantially higher number of records for most species post-1975 and the lack of background records to indicate equal or greater sampling effort pre-1975. In this context, the contractions in distribution of M. lagotis and T. vulpecula likely reflect actual declines, and are consistent with anecdotal reports of the disappearance of these species from sites throughout the study region (Burbidge et al. 1988, Kerle et al. 1992). Although we acknowledge the potential influence of increased sampling effort post-1975, no reduction in distribution was recorded for five of the other CWR marsupials. For four of the five other species, we suggest that this demonstrates relative resilience and that this may be explained though aspects of their ecology and life-history. The two carnivorous Dasycercus species are the only CWR marsupials in the study region known to enter torpor, and the ability to substantially reduce energy expenditure may be an important factor in their persistence (Geiser and Masters 1994, Masters and Dickman 2012). Rock-dwelling mammal species, such as the macropod Petrogale lateralis, may be more resilient than ground-dwelling species (McKenzie et al. 2007, Johnson and Isaac 2009). This is attributed to greater habitat complexity in rocky areas providing more benign microclimates and greater protection from predation. Notoryctes typhlops and the closely related N. caurinus are Australia’s only truly fossorial mammals and, although they have been recorded in the diets of both the cat and fox (Paltridge 2002), their underground habits prob-
ably improve their resilience to above-ground threats. The ground-dwelling macropod Lagorchestes conspicillatus has fared better than its congeners, all of which are extinct in the wild, but it may have suffered a more recent decline than our analysis would have detected (Burbidge and Johnson 2008). Although the contraction of M. lagotis to the Tanami Desert region of the NT has been reported previously (Southgate 1990), the potential drivers of this contraction had not been explored. We found that the decline of this species was consistent with a shift away from areas used for cattle production and possibly also from areas of high rabbit density. These results support the competition-refuge hypothesis, with competition for food and shelter occurring with the arrival of cattle and rabbits to the arid NT in the first half of the 20th century. The results are consistent also with correlative studies showing a relationship between CWR mammal decline and environmental change (Burbidge and McKenzie 1989, Johnson et al. 2007, McKenzie et al. 2007), as well as with studies from Australia’s tropical north and semi-arid South Africa, which demonstrate negative impacts on terrestrial mammal species in association with a reduction in vegetation cover and food resources from livestock grazing (Eccard et al. 2000, Legge et al. 2011). We acknowledge that our competition variables may be correlated with additional unrecorded factors and that alternative or interactive mechanisms may have driven range contraction. For example, cattle grazing and the loss of grass cover can improve the hunting efficiency of feral cats (McGregor et al. 2014), while fire suppression on cattle stations may have 1097
reduced the availability of grass seeds favoured by M. lagotis (Southgate and Carthew 2006). Only field experiments controlling for alternative mechanisms would clarify the role of competition in the persistence of M. lagotis (see below). The uncertainty in the strength of the effect of rabbit abundance on M. lagotis may be a consequence of the patchy nature of rabbit occurrence across the arid NT. Although there is a general north-south shift from low to high rabbit abundance in the atlas data, there were many grid cells in the south without any rabbit records, and vice versa, presumably reflecting variation in sampling effort. This is not surprising given the absence of roads in many areas and the generally low human population density across the arid NT. This is a significant problem when attempting to derive predictor variables from multiple-source occurrence databases. In this context, the relative unimportance of predator variables in the M. lagotis and T. vulpecula models must be viewed with caution. In particular, red fox records were extremely patchy across our grid cells. Predation by this species should not be discounted as a potential driver of the northward contraction of M. lagotis (Southgate 1990), particularly given the positive correlation between rabbit and red fox records in the bilby data (Spearman’s r 0.34) and elsewhere in Australia (Read and Bowen 2001, Johnson et al. 2007). An alternative to deriving our own predator and rabbit indices would have been to source species distribution model (SDM) layers for these taxa. However, such layers are currently not available for large areas of Australia (Newsome et al. 2013) and we note the challenges associated with quantifying the occurrence or density of cats, foxes and dingoes (Hayward and Marlow 2014). Given the highly clustered M. lagotis occurrences post-1975, it was not surprising that model residuals were spatially autocorrelated. The Tanami Desert is a vast sandy region characterised by relatively homogenous landforms and vegetation types (Southgate et al. 2006). Therefore, it seems likely that the spatial autocorrelation was the product of an additional environmental determinant(s) inherent to this region (Dormann et al. 2007). Southgate et al. (2007) modelled the factors determining habitat suitability for M. lagotis across the Tanami Desert and found a positive relationship with mean annual rainfall, substrate type (including laterite/rock features) and probability of dingo occurrence. The authors conceded that there were probably additional ecological processes that were not accounted for in the models, and this was evident in the weak predictive performance of the independent evaluation data. We found a negative relationship between bilby occurrence and NDVI (itself highly correlated with rainfall across the study region) and a weak positive relationship between bilby occurrence and dingo records; finer-scale substrate variables could not be accounted for in our analysis. Regardless, we suggest that none of these variables adequately differentiate the Tanami Desert from other regions with few or no records post-1975. The refuge status of the Tanami may reflect its vast area, contiguous suitable habitat, low rabbit densities, absence of cattle grazing in most areas, lower fox densities than in areas further south, and potential fox-suppressive effects by the large dingo populations in certain parts of the region (Newsome et al. 2013). Further, substantial portions of the northern and southern Tanami Desert are reserved in Indigenous Protected Areas and managed by Indigenous rangers. 1098
The distribution of T. vulpecula appears to have contracted to the cooler, higher elevation regions of the arid NT, consistent with our climate change hypothesis. Global surface temperatures have increased by 0.85°C and there has been a global trend of increasing monthly heat records, both attributed to anthropogenic climate change (Coumou and Rahmstorf 2012, IPCC 2013). In Australia the magnitude of increasing temperatures has been highest in inland areas, with median annual temperatures in Alice Springs (the major population centre in the south of the study region) increasing by up to 2°C since the 1970s (Hughes 2003, Davis et al. 2013). There has also been an overall positive trend in the number of hot days ( 40°C) across arid Australia (Collins et al. 2000). With a predominately temperate distribution (Kerle and How 2008), arid-dwelling T. vulpecula may already have been on the edge of its thermal limits. Some support for this hypothesis includes an observation of substantial mortality of T. vulpecula during a recent heatwave in a temperate region of South Australia (Bird 2009). Given the genetic similarity between T. vulpecula from arid central Australia and temperate South Australia (Foulkes 2001), it is plausible that arid-dwelling populations are also vulnerable to extreme weather events. As well as causing direct mortality, increasing temperatures may reduce the availability of suitable den sites for arid T. vulpecula. In the tropical north, T. v. arnhemensis preferentially selected cooler tree hollows among potential den sites (Isaac et al. 2008). Arid-dwelling T. vulpecula is now known to occur only at sites without tree hollows where the only available den sites are rock crevices. These crevices offer a stable thermal buffer against extreme temperature fluctuations (Geiser and Pavey 2007) and are likely to provide a superior buffer than tree hollows (Isaac et al. 2008). Given that temperature and ruggedness were highly correlated in the T. vulpecula dataset, ruggedness should be considered an alternative factor in explaining the persistence of the species in the desert uplands. Rugged rocky areas may offer increased protection from predation by cats, foxes and dingoes, with rock-dwelling mammals having been more resilient than terrestrial species across Australia (McKenzie et al. 2007, Johnson and Isaac 2009). However, treedwelling species have also fared better than terrestrial species and thus the hypothesis does not neatly explain the apparent disappearance of T. vulpecula from tree-lined watercourses and alluvial woodlands, where there are many opportunities to forage above ground or to climb to evade terrestrial predators (Kerle et al. 1992). It may now be too late to further explore the factors driving the contraction in distribution of T. vulpecula. The species appears to have continued to decline in distribution over the last two decades and in the arid zone is now known only from a handful of sites in a restricted area of mountainous terrain west of Alice Springs (McDonald et al. unpubl.). Our results for M. lagotis suggest that competition with cattle may have been a factor contributing to the species’ retraction from productive rangeland areas. However, it is unclear whether removal of cattle could improve habitat suitability to the point that these areas could support M. lagotis again. Experimental removal of cattle from properties neighbouring the Tanami Desert would allow testing of the role of competition on habitat suitability, but would need to account for potential confounding differences in
vegetation type (e.g. spinifex grasslands versus tussock grasslands), predator density and interactions between the two factors. However, given the importance of beef production to the economy of the NT, together with the complex potential interactions between competition and predation, the immediate objective for the conservation of M. lagotis should be to ensure its continued persistence in the Tanami Desert. This will require an improved understanding of the factors driving population or occupancy dynamics within this region, and is likely to be best achieved through a systematic monitoring program with appropriate intervention points for management actions. Our data on Macrotis lagotis range contraction support the species’ current listing as vulnerable under National (EPBC) and Territory (TPWCA) legislation. Although any intervention may be too late for arid-dwelling T. v. vulpecula, which now likely qualifies as critically endangered in the NT (under IUCN Red List criteria), there is an urgent need to better understand how increased temperatures will affect the persistence of this species across Australia. This is important given the ongoing declines observed both for this subspecies in other parts of its distribution and for T. v. arnhemensis in the Top End of the NT (Kerle and How 2008, Woinarski et al. 2011). In addition to undertaking physiological experiments, the experimental release of T. vulpecula into predator-free areas of arid Australia (e.g. predator-proof enclosures) would help to establish the role of increasing temperatures on its survival in the absence of predation pressure. Our results for T. vulpecula demonstrate the importance of thinking beyond the ‘typical’ factors when attempting to understand drivers of decline. Recent investigations into the decline of Australia’s mammals have ignored climate change as a potential driver (McKenzie et al. 2007, Woinarski et al. 2011, Fisher et al. 2014), although Burbidge et al. (2008) predicted future climate-driven range shifts for Australia’s terrestrial mammals. This is despite temperature-driven range contractions already having occurred along an elevation gradient in the USA (Moritz et al. 2008). Our results suggest that climate change and its interactive effects should be considered among other hypotheses for recent and ongoing mammal declines in Australia. We conclude that models using multiple-source occurrence data can provide important new insights into the patterns and drivers of species’ declines and assist in directing experimental management aimed at ameliorating these drivers. Acknowledgements – CRD was supported by grants from the Australian Research Council.
References Aizpurua, O. et al. 2015. Optimising long-term monitoring projects for species distribution modelling: how atlas data may help. – Ecography 38: 29–40. Anson, J. R. et al. 2014. Effects of multiple disturbance processes on arboreal vertebrates in eastern Australia: implications for management. – Ecography 37: 357–366. Bird, P. 2009. Heatwave mammal deaths. – Mammal Soc. Newslett. Oct. 2009: 22. Burbidge, A. A. and McKenzie, N. L. 1989. Patterns in the modern decline of Western Australia’s vertebrate fauna: causes and conservation implications. – Biol. Conserv. 50: 143–198.
Burbidge, A. A. and Johnson, P. M. 2008. Spectacled hare-wallaby. – In: Van Dyck, S. and Strahan, R. (eds), The mammals of Australia, 3rd ed. New Holland Publishers, pp. 314–316. Burbidge, A. A. et al. 1988. Aboriginal knowledge of the mammals of the Central Deserts of Australia. – Aust. Wildl. Res. 15: 9–39. Burbidge, A. A. et al. 2008. Conservation status and biogeography of Australia’s terrestrial mammals. – Aust. J. Zool. 56: 411–422. Burnham, K. P. and Anderson, D. 2002. Model selection and multimodel inference: a practical information-theoretic approach, 2nd ed. – Springer. Ceballos, G. and Ehrlich, P. R. 2002. Mammal population losses and the extinction crisis. – Science 296: 904–907. Chisholm, R. and Taylor, R. 2007. Null hypothesis testing and the critical weight range for Australian mammals. – Conserv. Biol. 21: 1641–1645. Clarke, M. F. 2008. Catering for the needs of fauna in fire management: science or just wishful thinking? – Wildl. Res. 35: 385–394. Clavero, M. and Garcia-Berthou, E. 2005. Invasive species are a leading cause of animal extinctions. – Trends Ecol. Evol. 20: 110. Collins, D. A. et al. 2000. Trends in annual frequencies of extreme temperature events in Australia. – Aust. Meteorol. Mag. 49: 277–292. Coumou, D. and Rahmstorf, S. 2012. A decade of weather extremes. – Nat. Clim. Change 2: 491–496. Davis, J. et al. 2013. Evolutionary refugia and ecological refuges: key concepts for conserving Australian arid zone freshwater biodiversity under climate change. – Global Change Biol. 19: 1970–1984. Dickman, C. R. 1996. Impact of exotic generalist predators on the native fauna of Australia. –Wildl. Biol. 2: 185–195. Dickman, C. R. 2013. Long-haul research: benefits for conserving and managing biodiversity. – Pac. Conserv. Biol. 19: 10–17. Dormann, C. F. 2007. Effects of incorporating spatial autocorrelation into the analysis of species distribution data. – Global Ecol. Biogeogr. 16: 129–138. Dormann, C. F. et al. 2007. Methods to account for spatial autocorrelation in the analysis of species distributional data: a review. – Ecography 30: 609–628. Eccard, J. A. et al. 2000. How livestock affects vegetation structures and small mammal distribution in the semi-arid Karoo. – J. Arid Environ. 46: 103–106. Fisher, D. O. and Blomberg, S. P. 2011. Correlates of rediscovery and the detectability of extinction in mammals. – Proc. R. Soc. B 278: 1090–1097. Fisher, D. O. et al. 2014. The current decline of tropical marsupials in Australia: is history repeating? – Global Ecol. Biogeogr. 23: 181–190. Foulkes, J. N. 2001. The ecology and management of the common brushtail possum Trichosurus vulpecula in central Australia. – Unpubl. PhD thesis, Univ. of Canberra, Canberra. Geiser, F. and Masters, P. 1994. Torpor in relation to reproduction in the mulgara, Dasycercus cristicauda (Dasyuridae: Marsupialia). – J. Thermal Biol. 19: 33–40. Geiser, F. and Pavey, C. R. 2007. Basking and torpor in a rock-dwelling desert marsupial: survival strategies in a resourcepoor environment. – J. Comp. Physiol. 177: 885–892. Gibson, D. F. 2000. Distribution and conservation status of the black-footed rock-wallaby, Petrogale lateralis (MacDonnell Ranges race), in the Northern Territory. – Aust. Mammal. 21: 213–236. Griffioen, P. A. and Clarke, M. F. 2002. Large-scale bird-movement patterns evident in eastern Australian atlas data. – Emu 102: 99–125. Harrell, F. E. 2014. Package ‘rms’ v 4.2-0. – R package, http:// cran.r-project.org/web/packages/rms/index.html .
1099
Hayward, M. W. and Marlow, N. 2014. Will dingoes really conserve wildlife and can our methods tell? – J. Appl. Ecol. 51: 835–838. Hughes, L. 2003. Climate change and Australia: trends, projections and impacts. – Austral Ecol. 28: 423–443. IPCC 2013. Climate change 2013: the physical science basis. Contribution of Working Group I to the Fifth Assessment Report of the Intergovernmental Panel on Climate Change. – Cambridge Univ. Press. Isaac, J. L. et al. 2008. Microclimate of daytime den sites in a tropical possum: implications for the conservation of tropical marsupials. – Anim. Conserv. 11: 281–287. Jeppsson, T. et al. 2010. The use of historical collections to estimate population trends: a case study using Swedish longhorn beetles (Coleoptera: Cerambycidae). – Biol Conserv. 143: 1940–1950. Johnson, C. N. and Isaac, J. L. 2009. Body mass and extinction risk in Australian marsupials: the ‘Critical Weight Range’ revisited. – Austral Ecol. 34: 35–40. Johnson, C. N. et al. 2007. Rarity of a top predator triggers continent-wide collapse of mammal prey: dingoes and marsupials in Australia. – Proc. R. Soc. B 274: 341–346. Kerle, J. A. and How, R. A. 2008. Common brushtail possum. – In: Van Dyck, S. and Strahan, R. (eds), The mammals of Australia, 3rd ed. New Holland Publishers, pp. 274–276. Kerle, J. A. et al. 1992. The decline of the brushtail possum, Trichosurus vulpecula (Kerr 1798), in arid Australia. – Rangeland J. 14: 107–127. Legge, S. et al. 2011. Rapid recovery of mammal fauna in the central Kimberley, northern Australia, following the removal of introduced herbivores. – Austral Ecol. 36: 791–799. Letnic, M. and Dickman, C. R. 2006. Boom means bust: interactions between the El Niño/Southern Oscillation (ENSO), rainfall and the processes threatening mammal species in arid Australia. – Biodivers. Conserv. 15: 3847–3880. Letnic, M. et al. 2009. Does a top-predator provide an endangered rodent with refuge from an invasive mesopredator? – Animal Conserv. 12: 302–312. Lindenmayer, D. B. et al. 2012. Improving biodiversity monitoring. – Austral Ecol. 37: 285–294. Luck, G. W. et al. 2010. What drives the positive correlation between human population density and bird species richness in Australia? – Global Ecol. Biogeogr. 19: 673–683. Magurran, A. E. et al. 2010. Long-term datasets in biodiversity research and monitoring: assessing change in ecological communities through time. – Trends Ecol. Evol. 25: 574–582. Masters, P. and Dickman, C. R. 2012. Population dynamics of Dasycercus blythi (Marsupialia: Dasyuridae) in central Australia: how does the mulgara persist? – Wildl. Res. 39: 419–428. McCarthy, M. A. 1998. Identifying declining and threatened species with museum data. – Biol. Conserv. 83: 9–17. McGregor, H. W. et al. 2014. Landscape management of fire and grazing regimes alters the fine-scale habitat utilisation by feral cats. – PLoS One 9: e109097. McKenzie, N. L. et al. 2007. Analysis of the factors implicated in the recent decline of Australia’s mammal fauna. – J. Biogeogr. 34: 597–611. Moritz, C. et al. 2008. Impact of a century of climate change in small-mammal communities in Yosemite National Park, USA. – Science 322: 261–264. Morton, S. R. 1990. The impact of European settlement on the vertebrate animals of arid Australia: a conceptual model. – Proc. Ecol. Soc. Aust. 16: 201–213. Morton, S. R. et al. 2011. A fresh framework for the ecology of arid Australia. – J. Arid Environ. 75: 313–329. Neter, J. et al. 1996. Applied linear statistical models, 4th ed. – Irwin. Newsome, T. M. et al. 2013. Anthropogenic resource subsidies determine space use by Australian arid zone dingoes: an
Supplementary material (Appendix ECOG-01212 at www.ecography.org/readers/appendix ). Appendix 1–2. 1100
improved resource selection modelling approach. – PLoS One 8: e63931. Paltridge, R. 2002. The diets of cats, foxes and dingoes in relation to prey availability in the Tanami Desert, Northern Territory. – Wildl. Res. 29: 389–403. Paradis, E. et al. 2014. Package ‘ape’ v3.1. – R package, http:// cran.r-project.org/web/packages/ape/index.html . Parker, S. A. 1973. An annotated checklist of the native land mammals of the Northern Territory. – Rec. S. Aust. Mus. 16: 1–57. Pavey, C. R. et al. 2012. Habitat use, population dynamics and species identification of mulgara, Dasycercus blythi and D. cristicauda, in a zone of sympatry in central Australia. – Aust. J. Zool. 59: 156–169. Pergams, O. R. and Nyberg, D. 2001. Museum collections of mammals corroborate the exceptional decline of prairie habitat in the Chicago region. – J. Mammal. 82: 984–992. Ponder, W. F. et al. 2001. Evaluation of museum collection data for use in biodiversity assessment. – Conserv. Biol. 15: 648–657. Pyke, G. H. and Ehrlich, P. R. 2010. Biological collections and ecological/environmental research: a review, some observations and a look to the future. – Biol. Rev. 85: 247–266. Read, J. and Bowen, Z. 2001. Population dynamics, diet and aspects of the biology of feral cats and foxes in arid South Australia. – Wildl. Res. 28: 195–203. Remsen, J. V. 1995. The importance of continued collecting of bird specimens to ornithology and bird conservation. – Bird Conserv. Int. 5: 145–180. Schipper, J. et al. 2008. The status of the world’s land and marine mammals: diversity, threat, and knowledge. – Science 322: 225–230. Shaffer, H. B. et al. 1998. The role of natural history collections in documenting species declines. – Trends Ecol. Evol. 13: 27–30. Short, J. and Smith, A. 1994. Mammal decline and recovery in Australia. – J. Mammal. 75: 288–297. Southgate, R. I. 1990. Distribution and abundance of the greater bilby Macrotis lagotis Reid (Marsupialia: Peramelidae). – In: Seebeck, J. H. et al. (eds), Bandicoots and bilbies. Surrey Beatty and Sons, pp. 293–302. Southgate, R. and Carthew, S. M. 2006. Diet of the bilby (Macrotis lagotis) in relation to substrate, fire and rainfall characteristics in the Tanami Desert. – Wildl. Res. 33: 507–519. Southgate, R. et al. 2006. An examination of the Stafford Smith-Morton ecological model: a case study in the Tanami Desert, Australia. – Rangeland J. 28: 197–210. Southgate, R. et al. 2007. Bilby distribution and fire: a test of alternative models of habitat suitability in the Tanami Desert, Australia. – Ecography 30: 759–776. Stafford-Smith, D. M. and Morton, S. R. 1990. A framework for the ecology of arid Australia. – J. Arid Environ. 16: 255–278. Williams, O. B. and Calaby, J. H. 1985. The hot deserts of Australia. – In: Evenari, M. et al. (eds), Hot deserts and arid shrublands. Elsevier, pp. 269–312. Woinarski, J. C. Z. et al. 2011. The disappearing mammal fauna of northern Australia: context, cause, and response. – Conserv. Lett. 4: 192–201. Woinarski, J. C. Z. et al. 2014. The action plan for Australian mammals 2012. – CSIRO Publishing. Woolley, P. A. et al. 2013. Past and present distribution of Dasycercus: toward a better understanding of the identity of specimens in cave deposits and the conservation status of the currently recognised species D. blythi and D. cristicauda (Marsupialia: Dasyuridae). – Aust. J. Zool. 61: 281–290.