Published online July 25, 2006
Soybean Maturity Groups, Environments, and Their Interaction Define Mega-environments for Seed Composition in Argentina Julio L. Dardanelli,* Mo´nica Balzarini, Maria Jose´ Martı´nez, Martha Cuniberti, Silvia Resnik, Silvina F. Ramunda, Rosana Herrero, and Hector Baigorri
Maria Jose´ Martı´nez, Julio L. Dardanelli, and Silvina F. Ramunda, INTA Estacio´n Experimental Manfredi. 5988 Manfredi, Co´rdoba, Argentina; Martha Cuniberti, Rosana Herrero, and Hector Baigorri, INTA Estacio´n Experimental Marcos Jua´rez, 2580 Marcos Jua´rez, Co´rdoba, Argentina; Mo´nica Balzarini, Facultad de Ciencias Agropecuarias. Avda. Valparaı´so s/n, Ciudad Universitaria. 5000 Co´rdoba, Argentina, and Consejo Nacional de Investigaciones Cientı´ficas y Te´cnicas; and Silvia Resnik, Facultad de Ciencias Exactas y Naturales, Universidad de Buenos Aires, and Comisio´n de Investigaciones de la Provincia de Buenos Aires. Received 15 Dec. 2005. *Corresponding author (
[email protected]).
(www.usda.gov/oce/commodity/wasde/latest.pdf; verified 30 May 2006). At present, soybean represents the country’s main production making up 25% of Argentine total exports (Rossi, 2004). Soybean crop covers a wide ecological area of Argentina within the 238 and 398 southern latitudes, which represents a remarkably wide range of climatic conditions. In this area different maturity groups ranging from II through IX find suitable environments with many planting dates that range from September to February (Baigorri et al., 2002). The long period for soybean growth in Argentina and its wide geographical range mean that crops in rainfed land can grow under very different environmental conditions, in terms of rainfall, radiation, and temperature. Since 1980, multi-environment trials have been conducted annually throughout the Soybean Network of the National Institute of Agricultural Technology (INTA). Usually data are analyzed for grain yield across different locations (Baigorri, 1997). However, soybean is produced for oil and protein, which are of economic importance (Wilcox and Shibles, 2001). The high concentration of protein in soybean meal makes the meal a valuable commodity for export. Environmental conditions during reproductive growth of soybean may cause differences in the quality of seed (Wilson, 2004). Previous studies in Argentina related to grain oil and protein concentrations in soybean suggested considerable variation across cultivars (Maestri et al., 1998; Herrero et al., 1999; Cuniberti et al., 2004). Since the list of cultivars annually tested in MET, vary from year to year because new commercial cultivars are introduced every year and others are withdrawn, it is not simple to evaluate the consistency of results across years. The interest here is to conclude about MG, rather than variety effects. This will permit the analysis of a wider range of environmental conditions each year and the repeatability from year to year. Interactions between MG and environments can be agronomically exploited if their magnitude is enough to create ME. Here, ME have been interpreted as a set of environments that causes some MG to perform similarly regarding their seed constituents. This paper presents an application of GGE biplot methodology to evaluate ME for soybean seed traits. The objective of this paper was to evaluate consistency across years of patterns related to MG 1 MG 3 E effects from MET analyses, first to investigate if different mega-environments for oil, protein, and oil 1 protein
Published in Crop Sci. 46:1939–1947 (2006). Forage & Grazinglands doi:10.2135/cropsci2005.12-0480 ª Crop Science Society of America 677 S. Segoe Rd., Madison, WI 53711 USA
Abbreviations: E, environment; ME, mega-environments; MET, multi-environment trial; MG, maturity group; MG 3 E, maturity group by environment interaction; PC, principal component; pp-ETP, precipitation minus potential evapotranspiration.
Reproduced from Crop Science. Published by Crop Science Society of America. All copyrights reserved.
ABSTRACT Argentina is the largest soybean [Glycine max (L.) Merrill] meal and oil exporter in the world, with crops covering a 23° to 39° S latitude range, allowing the presence of genotypes from different maturity groups (MG). Multi-environment yield trials (MET) for commercial cultivars are conducted each year across the crop area. The aim of this paper was to evaluate the consistency of MG effects and its interaction with environments (E), first to investigate if different mega-environments (ME) for oil, protein, and oil 1 protein exist in Argentina, and second to identify superior MG regarding these traits. We analyzed a 3-yr series of oil and protein data from MET involving six MG and more than 14 E per year. Statistical analysis was based on ANOVA and graphical displays from E-centered biplots to explore MG-related effects and to identify ME. No ME were identified for oil content because of MG II, III, and IV showed higher content than other groups in every E. Two or three ME (depending on the growing season) were identified for protein and oil 1 protein contents; in one of them MG VI cultivars had the highest value of these compounds whereas in the other set of E, higher yielding cultivars were from MG II–III. The oil variations among E depended mainly on MG effects suggesting broad adaptations of short MG, whereas MG 3 E interaction effects for protein and oil 1 protein were higher than for oil, and enough to create opportunities for handling environment-specific adaptations.
A
is the third largest producer of grain soybean in the world and the largest exporter of soybean meal and soybean oil. The Argentine soybean oil industry has made important investments: increased mill capacity, improved port facilities, and enlarged storage facilities, and has the most modern extraction plants in the world, with modern technology to respond to the demand. Argentina has doubled its agricultural production from 35 million tons of grains, basically wheat (Triticum aestivum L.), corn (Zea mays L.), and sunflower (Helianthus annuus L.) in the 1980s, to 70 million tons, of which 35 million tons were soybean during 2002–2003 RGENTINA
1939
1940
CROP SCIENCE, VOL. 46, SEPTEMBER–OCTOBER 2006
exist in Argentina, and second to identify superior MG regarding these traits. MATERIALS AND METHODS
Reproduced from Crop Science. Published by Crop Science Society of America. All copyrights reserved.
Database Three independent data sets (crop years 2000–2001, 2001– 2002, and 2002–2003) were constructed from soybean MET conducted at the INTA Agricultural Experimental Stations across the Argentinean soybean crop area. These trials compared performance of commercial cultivars, via a randomized complete-block design with three blocks in each environment (here environments are defined as location and planting date combinations). Soils from experimental sites did not present any physical or nutritional constraints. Rainfed crops were managed according to recommended cultural practices. In this study, we composed a 300-g grain sample from the three replications of each cultivar at each environment. The total number of analyzed samples was 2938, corresponding to 189 cultivars. The protein and oil content (expressed as percentage on dry sample) was determined by near infrared reflectance using an Infratec 1241 following the method recommended by AACC (AACC, 2000), at the INTA Industrial Quality Laboratory, located at the INTA Agricultural Experimental Station in Marcos Jua´rez, Argentina.
Cultivars and environments in these MET varied across years, and not all genotypes were evaluated in all environments, which resulted in highly unbalanced variety 3 environment data. Cultivars were classified according to their MG to build MG 3 environment data tables for each crop year. The mean oil, protein, oil 1 protein, oil/(oil 1 protein) and protein/(oil 1 protein) values for each MG in each environment were used for statistical analyses. Complete MG data tables were built by combining MG II with MG III, and MG VIII with MG IX since there were few cultivars in MG II and MG IX in the MET. We selected environments for which the six MG (II–III, IV, V, VI, VII, VIII–IX) were simultaneously evaluated. A total of 14 environments from year 2000– 2001, plus 20 and 24 environments for years 2001–2002 and 2002–2003, were used in this analysis (Table 1). In addition to oil and protein values, temperature and precipitation minus potential evapotranspiration data were compiled from 1970 to 2003 climatic series for each location. Median values of these variables for the period from November to May are shown in Table 2.
Statistical Analysis Analyses of variance were conducted to investigate the relative contribution to total variability of MG, E, and MG 3 E interaction effects. To explore variability for oil, protein, oil 1
Table 1. Locations and planting dates involved in the multi-environment yield trials analysis for years 2000–2001 to 2002–2003. Location (latitude, longitude, altitude above mean sea level)†
Year
Sep.
Oct.
Nov.
Dec.
Jan.
Feb.
Day of month PA (31°449 S, 60°329 W, 384 m) RE (29°409 S, 59°129 W, 32 m) MA (31°499 S, 63°469 W, 292 m) RT (32°119 S, 64°69 W, 365 m) MJ (32°419 S, 62°69 W, 105 m) SA (24°479 S, 65°249 W, 1183 m) CU (32°299 S, 58°149 W, 3 m) RC (33°89 S, 64°219 W, 426 m) PE (33°549 S, 60°359 W, 57 m) FA (26°519 S, 65°109 W, 416 m) CO (27°469 S, 65° 349 W, 334 m) MC (31°209 S, 63°389 W, 339 m) SP (26°489 S, 60°279 W, 235 m) RA (31°109 S, 61°289 W, 91 m)
2000/2001 2001/2002 2002/2003 2000/2001 2001/2002 2002/2003 2000/2001 2001/2002 2002/2003 2000/2001 2001/2002 2002/2003 2000/2001 2001/2002 2002/2003 2000/2001 2001/2002 2002/2003 2000/2001 2001/2002 2002/2003 2000/2001 2001/2002 2002/2003 2000/2001 2001/2002 2002/2003 2000/2001 2001/2002 2002/2003 2000/2001 2001/2002 2002/2003 2000/2001 2001/2002 2002/2003 2000/2001 2001/2002 2002/2003 2000/2001 2001/2002 2002/2003
3 1 26 26
23 18 12
18 1
23
23
14 12 28
14 26 31
12
12 19 28 23 18 1
9
21 4–22 24 24
13
4
6
1
28
25
13 26 5 15 27 21 24
31
2 15 21 13
10 4
4
12 19 1 28 19
30
23
† PA, Parana´; RE, Reconquista; MA, Manfredi; RT, Rı´o Tercero; MJ, Marcos Jua´rez; SA, Salta; CU, C. del Uruguay; RC, Rı´o Cuarto; PE, Pergamino; FA, Famailla´; CO, La Cocha; MC, Monte Cristo; SP, R. Sa´enz Pen˜a; RA, Rafaela.
1941
DARDANELLI ET AL.: MEGA-ENVIRONMENTS FOR SOYBEAN
Table 2. Climatic variables at locations involved in soybean multienvironment yield trials. Median values for the period November to May from 1970 to 2003 meteorological series.
Reproduced from Crop Science. Published by Crop Science Society of America. All copyrights reserved.
Location† PA RE MA RT MJ SA CU RC PE FA CO MC SP RA
Tmax‡
Tmin§
26.7 28.2 26.4 27.3 26.7 25.2 26.9 25.5 26.1 27.4 27.4 26.3 30.3 27.4
°C 16.3 17.4 13.5 14.1 14.7 14.0 15.2 14.3 13.6 16.7 16.7 14.3 17.6 15.0
Tmean¶
pp#
pp-PET†† mm
21.5 22.7 19.9 20.6 20.8 19.6 21.0 20.0 19.9 22.1 22.1 20.4 24.0 21.2
791.2 1007.0 650.2 631.9 680.3 582.5 747.3 692.7 714.6 1185.5 574.5 710.2 883.3 759.7
292.2 156.3 2111.2 2184.2 2173.5 2122.9 2101.0 295.9 292.5 463.6 2144.0 2118.4 247.9 263.6
† PA, Parana´; RE, Reconquista; MA, Manfredi; RT, Rı´o Tercero; MJ, Marcos Jua´rez; SA, Salta; CU, C. del Uruguay; RC, Rı´o Cuarto; PE, Pergamino; FA, Famailla´; CO, La Cocha; MC, Monte Cristo; SP, R. Sa´enz Pen˜a; RA, Rafaela. ‡ Tmax, maximum temperature. § Tmin, minimum temperature. ¶ Tmean, average temperature. # pp, precipitation. †† pp-PET, precipitation minus potential evapotranspiration.
protein, oil/(oil 1 protein), and protein/(oil 1 protein) and to judge the presence or absence of ME for each trait, we used the GGE methodology (Yan et al., 2000). Here GGE should be understood as the sum of MG and MG 3 E effects. The graphical display was made by biplots constructed from the first two symmetrically scaled principal components (PC1 and PC2) derived from PC analysis of environment-centered data with an average environment coordinate and a polygon view (Yan and Kang, 2003). For each biplot, the most responsive MG in explaining MG and MG 3 E interactions were identified by drawing a convex polygon on vertex MG, which was sectored as suggested by Yan et al. (2001) to identify ME. All analyses were performed independently for each crop year data, and the consistencies and differences in the resulting GGE biplots were taken into account to infer the general pattern underlying these seed quality–MET data.
RESULTS Ranges for oil, protein, and oil 1 protein contents in individual samples across environments, are presented in Table 3 for each MG. The observed ranges from our study (oil 17.2–28.5%; protein 34.0–45.4%; oil 1 protein 56.0–68.1%) were higher than the ranges reported in a previous study involving a smaller crop area than the current one (Maestri et al., 1998). Table 4 shows the percentages of total variation in each trait accounted for Table 3. Seed oil, protein, and protein 1 oil contents. Ranges across environments in cultivars belonging to different soybean maturity groups (MG). MG II–III IV V VI VII VIII–IX
Oil†
Protein
19.1–26.4 19.4–28.5 17.2–26.8 17.6–26.2 17.2–25.3 17.2–24.4
% 34.9–44.7 34.0–43.9 34.7–43.6 36.0–45.4 35.0–44.1 35.4–44.7
† Percentage on dry sample.
Table 4. Percentage† of total variance in oil, protein, oil 1 protein, oil/(oil 1 protein), and protein/(oil 1 protein), accounted for by soybean maturity group (MG), environment (E), and maturity group by environment (MG 3 E) interaction effects. Trait
Year
Oil Protein Oil 1 protein Oil/(oil 1 protein) Protein/(oil 1 protein)
2000/2001 2001/2002 2002/2003 2000/2001 2001/2002 2002/2003 2000/2001 2001/2002 2002/2003 2000/2001 2001/2002 2002/2003 2000/2001 2001/2002 2002/2003
31 25 11 11 10 5 17 8 5 18 21 9 18 21 9
E
MG 3 E
Residual
17 44 51 24 41 45 24 47 62 25 42 42 24 43 41
% 16 12 11 15 21 13 14 23 11 16 13 13 16 14 13
36 19 27 50 28 37 45 22 22 41 24 36 42 22 37
† Percentage on total sums of squares.
by MG, E, and MG 3 E effects. For each trait, the relative contribution of MG effect allows broad-sense inference (i.e., general performance of genotypes belonging to different MG throughout the crop area), while MG 3 E interaction effects relate to narrow-sense inference suggesting environment specific adaptations. The percentage of total variation that is explained by each source of variation permits comparing magnitudes of MG and MG 3 E effects which are important to identify ME. In our study, all effects were a significant source of variation for all traits in the three analyzed crop years (P , 0.0001). Except for year 2000–2001, E was the most important source of variation for all traits, which is common in MET (Kang, 2002). Environmental effects explained more than 40% of the total variability. The smaller E effects in the year 2000–2001 with respect to the other years were associated with the smaller variation across locations for the difference between values of precipitation minus potential evapotranspiration (pp-ETP, Table 5). For oil content, variability due to MG 3 E interaction was not greater than the variability accounted for by MG main effect (Table 4). The relatively large contribution of MG effects indicated that, on average, cultivars from some soybean MG were higher yielding for oil than cultivars belonging to other MG, regardless of the environment in which they were grown, suggesting that probably a unique ME exists for Table 5. Coefficient of variation (CV) of several climatic variables across locations involved in the multi environment yield trials analysis for crop years 2000/2001 to 2002/2003. Crop Year Climatic variable
2000/2001 CV
2001/2002 CV
2002/2003 CV
4.2 10.5 5.9 21.1
% 2.9 7.8 4.1 74.6
4.3 8.8 5.6 80.1
Oil 1 protein 58.7–68.1 57.8–67.9 56.6–67.2 57.0–67.2 56.0–67.0 56.6–65.1
MG
Tmax† Tmin‡ Tmean§ pp-PET¶
† Maximum temperature. ‡ Minimum temperature. § Average temperature. ¶ Precipitation minus potential evapotranspiration.
Reproduced from Crop Science. Published by Crop Science Society of America. All copyrights reserved.
1942
CROP SCIENCE, VOL. 46, SEPTEMBER–OCTOBER 2006
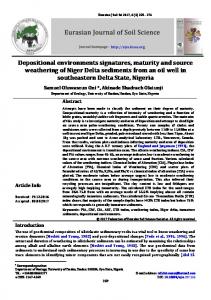
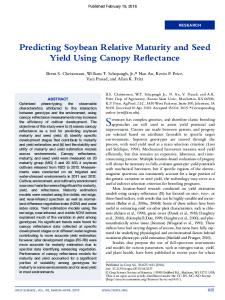
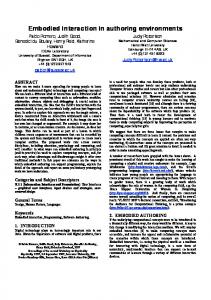
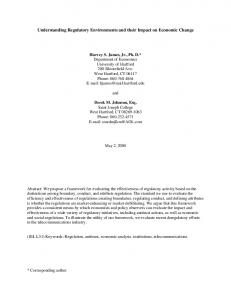
oil. However, for protein content, the MG main effect was lower than the MG 3 E interaction effect, indicating the opportunity to exploit narrow adaptations for this trait. A similar pattern was observed for oil 1 protein. The two ratios, oil/(oil 1 protein) and protein/(oil 1 protein), produced almost the same partition of total variability (Table 4). These ratios did not show more contribution of MG 3 E interaction than protein, or oil 1 protein contents, and for that reason they were not considered in the biplot analysis. The GGE biplots related to oil content (Fig. 1) explained 80% of the total MG 1 MG 3 E variation in the three multi-environment trials. Most of environmental PC1 scores took only positive values so that the genotypic PC1 scores were highly and positively correlated with MG (r 5 0.98, P 5 0.01). As all the environmental PC1 scores had positive sign, the PC1 in the biplot represents proportional oil differences among MG across environments. The MG 1 MG 3 E effects were also analyzed via defining an average environment coordinate, i.e., a virtual environment with PC scores equal to the average of PC1 and PC2 environment scores, and drawing its coordinate axes that pass through the origin (data not shown). Given that we just looked for a general environmental pattern and not for specific environments (they were not the same across years), the average environment coordinate view was no more informative than the polygon view where MG with large PC1 scores indicated large yielding ability and those with high absolute PC2 scores showed smaller stability across environments. The consistency in the biplot patterns across the three crop years suggested that the whole set of environments constituted a unique ME, mainly favorable for high oil content in cultivars belonging to MG II–III and IV (generally, indeterminate). Genotypes from MG II–III, and IV were high oil yielding in all environments. The MG IV showed higher oil content in 2000–2001 and 2001–2002, and it was close to being the MG with the best performance in 2002–2003. The markers of MG VI, VII, and VIII–IX were located far away from the markers of most environments (open circles). Only in planting dates 1 and 2 in Parana´ (PA) (Fig. 1, year 2001–2002) and planting dates 2 and 3 in Reconquista (RE) (Fig. 1, year 2002–2003), did cultivars belonging to MG VI to VIII–IX produce relatively more oil. Figure 2 illustrates the variation in seed oil content between cultivars of MG IV and MG VI with respect to the planting date for four locations. Oil contents were different between the two MG in all locations, decreasing from early to late planting dates as environmental temperatures of critical periods also decreased. Those differences among short and long MG were detected across different locations with contrasting average temperature (Fig. 3). Figure 4 corresponds to GGE biplots for protein ($70% of total variation explained by the first two PC), which also show a consistent pattern across crop years. The MG V was located far away from the environment markers, reflecting the fact that the cultivars in this MG yielded (protein) poorly in all environments. For several environments, cultivars belonging to MG VI showed
higher protein content, but another set of different environments where MG II–III yielded more than MG VI was identified by sectoring the polygon. The higher contribution of MG 3 E interaction for protein data compared to oil data, which was inferred from Table 4, is graphically expressed in Fig. 4 and suggested the existence of at least two different ME for protein
Fig. 1. GGE biplots based on seed oil content from three independent multi-environment yield trials data sets: 2000–2001, 2001–2002, and 2002–2003, respectively. Markers with roman numbers represent soybean maturity groups, and vectors represent environments.
Reproduced from Crop Science. Published by Crop Science Society of America. All copyrights reserved.
DARDANELLI ET AL.: MEGA-ENVIRONMENTS FOR SOYBEAN
1943
Fig. 2. Seed oil contents in soybean grain according to plantation date in four locations of the Argentinean crop region: (a) Reconquista, (b) Parana´, (c) Concepcio´n del Uruguay, and (d) Marcos Juarez, see Table 2. Maturity groups IV (open circles) and maturity group VI (closed squares).
concentration. Different ME were found each year, the best one being that for MG VI (which is composed of higher number of environments). In the first 2 yr MG VII delineated a different ME, but in the third one in many environments short cycle cultivars were the winners (MG IV and II–III). Therefore, for protein contents repeatability was not as high as for oil. In the GGE biplot for oil 1 protein (Fig. 5), the MG VIII–IX was located far away from all environment markers, reflecting the fact that the cultivars in this group yielded oil 1 protein content poorly in all the analyzed environments. In all years, many environments seemed to be favorable for MG II–III, but another ME could be identified where cultivars belonging to MG VI and VII yielded more oil 1 protein than cultivars from MG II–III. The statistical significance of MG mean differences for seed oil, protein, and oil 1 protein concentrations is presented in Table 6. Maturity group mean for oil and protein concentration ranged from 21.2 to 24.5% and from 38.8 to 41.2%, respectively. In all three analyzed MET datasets, oil content was statistically higher in cultivars of MG II–III (two seasons) and IV (three seasons). Both MG represent the winners in the unique ME found in this study for oil. The highest protein content corresponded to MG VI, which was the best group in most of the environments (Fig. 4), and the means of protein concentrations showed a decreasing
trend from MG VI toward extreme MG. For oil 1 protein the mean values were statistically higher for MG II–III which was the best group in most of the environments (Fig. 4) and lower for MG VIII–IX, which was located far away from all environment markers (Fig. 4), but the decrease was not progressive.
DISCUSSION This study showed a remarkable environmental variability of soybean seed oil and protein concentration in the Argentinean crop region. Cuniberti et al. (2000, 2004) also showed a significant effect of latitude (range between 298 and 388 S) on oil and protein content in a study including genotypes of maturity groups III to V. In our study, the ranges of these seed constituents (17–28% for oil and 34–45% for protein) were similar to those reported by Piper and Boote (1999) in uniform soybean tests conducted in USA (15–26% and 34–48%), involving locations ranging in latitude from 478 to 298 N (greater latitude range than that corresponding to the locations involved in this study, 258 to 348 S). The variation of these chemical compounds depended not only on the effect of the environment, but also on the effect of MG. The MG 3 E interaction was not of the same magnitude for oil as for protein contents. Our work differs from previous studies in the sense that published results (Piper and Boote, 1999; Cuniberti et al.,
Reproduced from Crop Science. Published by Crop Science Society of America. All copyrights reserved.
1944
CROP SCIENCE, VOL. 46, SEPTEMBER–OCTOBER 2006
Fig. 3. Averages and standard errors for seed oil content in cultivars of maturity group II–III, IV, and V (black bars) versus cultivars belonging to maturity group VI, VII, and VIII–IX (gray bars) in five locations of the Argentinean crop region: Salta (SA), Manfredi (MA), Marcos Jua´rez (MJ), Parana´ (PA), and Reconquista (RE). On the x axis is the historical average temperature (November to May) of each location.
2004; Maestri et al., 1998; Zhang et al., 2005) dealt with genotype (or cultivar) effects instead of MG effects. They usually compare cultivars within MG but not MG by themselves. Usually yield trials in the cooler environments include only the earliest MG whereas the warmest environments include only the latest MG. Yaklich et al. (2002) used oil and protein data of different MG from USA regional summaries, but compared the mean MG values between regions (southern and northern) instead of among several environments, as we created here by combining location and planting dates. Planting dates effects were not of direct interest since they are highly variable within location in Argentina. Yaklich et al. (2002) reported that mean oil and protein concentrations were higher in the southern region compared with the northern region of the U.S. crop area, and indicated that MG means for oil and protein concentration, for MG from II to VIII, ranged from 20.7 to 21.2% and 40.4 to 41.4%, respectively. Our study showed MG means for oil and protein ranging from 21.8 to 23.4% and 39.2 to 40.8%, respectively. The GGE biplot analysis suggested lower MG 3 E interaction for oil than for protein contents with most of the environments indicating that not different ME existed for oil. All the environments showed higher oil content values for short season MG (MG II–III and IV) than for long season ones (MG VI to VIII–IX). The MG II–III and IV had oil content statistically higher than others MG in the Argentinean crop region (Table 6), as well as in the regional U.S. summary reported by Yaklich et al. (2002). Temperature effects could explain the consistent pattern observed for oil content across seasons and
Fig. 4. GGE biplots based on seed protein content from three independent multi-environment yield trials data sets: 2000–2001, 2001–2002, and 2002–2003, respectively. Markers with roman numbers represent soybean maturity groups, and vectors represent environments.
environments, causing a similar performance of MG. Soybean seeds accumulate oil during the seed filling period, with a maximum rate occurring around 30 d after flowering (Wilson, 2004). Short-season MG tend to expose their seed filling period to higher temperatures than the long-season MG genotypes. Even in early planting dates (such as those of September or October, Table 1), photoperiodic control delayed the cycle length enough to match most of the short-season MG seed
1945
DARDANELLI ET AL.: MEGA-ENVIRONMENTS FOR SOYBEAN
Table 6. Average seed oil, protein, and oil 1 protein content in soybean cultivars from different maturity groups (MG) in three crop years. Crop year Trait %
Reproduced from Crop Science. Published by Crop Science Society of America. All copyrights reserved.
Oil
Protein
Oil 1 protein
MG
2000/2001
2001/2002
2002/2003
Mean
II–III IV V VI VII VIII–IX II–III IV V VI VII VIII–IX II–III IV V VI VII VIII–IX
23.63 b† 24.47 a 23.68 b 22.90 c 22.61 c 22.82 c 40.78 b 39.21 c 39.90 c 41.24 a 40.86 b 40.15 c 64.40 a 63.69 c 63.58 c 64.13 b 63.46 c 62.98 d
23.09 a 23.12 a 22.47 b 21.51 c 21.36 c 21.51 c 39.62 c 39.33 c 39.34 c 41.08 a 40.35 b 40.31 b 62.71 a 62.45 b 61.82 c 62.61 ab 61.73 c 61.84 c
22.86 a 22.74 a 22.41 b 21.55 c 21.48 c 21.19 d 39.41 b 39.21 b 38.79 c 40.05 a 39.87 b 39.18 c 62.26 a 61.95 b 61.23 d 61.61 c 61.36 d 60.37 d
23.19 23.44 22.85 21.99 21.82 21.84 39.94 39.25 39.34 40.79 40.36 39.88 63.12 62.70 62.21 62.78 62.18 61.73
† By column, different letters indicate statistically significant differences (P , 0.05, LSD test).
Fig. 5. GGE biplots based on seed oil 1 protein contents from three independent multi-environment yield trials data sets: 2000–2001, 2001–2002, and 2002–2003, respectively. Markers with roman numbers represent soybean maturity groups, and vectors represent environments.
filling period beyond the end of December, when temperatures reach their maximum values. Long-season MG had longer cycle duration matching their critical period for oil accumulation always with lower temperatures. In Fig. 2, we have shown that the difference in oil content between short-season and long-season MG was consistent and that the oil content decreased with planting dates, mirroring decreases in temperatures. Our results are similar to previous findings by Cuniberti
and Pe´rez (1997) who found that low latitude areas, where the seed filling period occurs under high temperatures, the oil quantity was higher than in the central and southern region of Argentine. Cuniberti et al. (2004) analyzing oil contents for planting dates from November to January at one location of the Argentinean Central Region, also reported that oil content decreased from 22.4 to 19.9%. Yaklich and Vinyard (2004) also found higher oil concentration under higher temperatures, indicating that the sum of minimum temperatures and the growing degree days of a single month in the seed filling period might have predictive value for oil. Moreover, Wilson (2004) showed, under controlled conditions (from 15 to 288C), that oil percentage increased consistently from 19 to 25% in response to mean daily temperature. Piper and Boote (1999) showed that oil content consistently increased from 14 to 248C. In our study, measured temperatures during the seed filling period are not shown, but in the Argentinean soybean area temperature decreases consistently from midJanuary (Hall et al., 1992). Even if soybeans are planted at the end of September (the earliest planting dates presented in this study, Table 1), short season MG expose their seed filling period after mid-January while long season MG might present later seed filling period in every location included in this study. Therefore, short season MG have higher oil content at any location, season and planting date (according to mean temperature during the filling period). Management decisions seem to be simple for this trait, if an acceptable yield is guaranteed. According to the strong linear inverse relationship between protein and oil documented by several authors (Sakla and Ghali, 1988; Wilcox and Shibles, 2001; Wilson, 2004), we expected high oil yielding environments being those with smaller protein contents or vice versa, and consequently similar magnitude for oil and protein interaction effects. However, for protein, a higher MG 3 E interaction effect than for oil was found,
Reproduced from Crop Science. Published by Crop Science Society of America. All copyrights reserved.
1946
CROP SCIENCE, VOL. 46, SEPTEMBER–OCTOBER 2006
and two or three ME were identified in all crop seasons. These ME indicate the opportunity to exploit narrow adaptations for this trait. Yaklich et al. (2002), demonstrated that the protein and oil did not always have an inverse relationship. In areas of lower latitudes in Argentina this relationship was not observed, with high values of oil and protein at the same time being 22.5 and 43%, respectively. Piper and Boote (1999), reported that the functional relationship that marked the influence of temperature on protein content was different than the function relating oil with temperature. They reported a quadratic relationship between protein and mean daily temperature during seed filling, which shows low protein content between 20 and 258C, but higher protein concentrations for temperatures lower than 208C, or greater than 258C. Thus, under high temperatures it could be expected that both protein and oil contents could be simultaneously high as reported by Cuniberti et al. (2004), and probably resulting from drought stress enhancing temperature (Dorrnbos and Mullen, 1992; Gibson and Mullen, 1996; Piper and Boote, 1999). Thus, the differences among MG effects, for protein, were attenuated since they depended on the range of temperature under which the genotypes developed their seed filling period. Under 208C they will respond to the inverse oil–protein relationship, whereas if they are exposed to temperatures higher than 208C, protein is not increased (from 20 to 258C) nor oil reaches its maximum (higher than 258C). The environments where the long-season MG may have more protein than the short ones probably are those with mean daily temperatures during seed filling lower than 208C, but in the environments with higher temperature the MG II–III found a niche for relatively higher protein contents, as shown in Fig. 4. Such phenomenon possibly could explain the higher number of ME for protein than for oil found in this investigation. Moreover, temperature does not account for much of the variation in protein concentration (Piper and Boote, 1999), but other environmental variables become critical. In fact, for soybean genotypes of early MG, average to high protein contents were found in years with high temperature and moderate rates of rainfall, whereas seed protein was reduced in seasons of insufficient N fixation or higher amount of precipitation during the seed filling period (Vollmann et al., 2000). Under rainfed conditions, drought stress patterns are not as clear as temperature patterns. The Argentine soybean area accounts for high year to year rainfall variability (Hall et al., 1992). The environments included in our study had an important variability in water availability conditions among locations and seasons, reflected in the variation of pp-ETP (Tables 2 and 5). Therefore higher MG 3 E interaction for protein could be associated with pp-ETP. This behavior could explain that for similar locations and planting dates, across crop years, short MG performed better for protein than long MG or vice versa, depending on the crop season. This behavior allows the exploration of narrow adaptations for this trait. However, further studies are needed to better assess causes affecting the MG 3 E interaction patterns. Currently, we
are collecting actual values of environmental variables during the filling grain period of soybean crops from different MG at several environments to obtain a deeper analysis of causal effects. Oil 1 protein showed similar interaction magnitudes than protein (Table 4). The importance of temperature seems to be greater for oil 1 protein than for protein but lower than for oil. According to Piper and Boote (1999) the slope of oil versus temperature was 0.53% 8C21, whereas oil 1 protein increased 0.44% 8C21. Yaklich and Vinyard (2004) also found that oil 1 protein content increased with temperature. The range of temperatures involved in those publications is frequent during the seed filling period in Argentina. Then the question is: Why is the oil 1 protein interaction pattern similar to that described for protein and not similar to that described for oil? It seems that variations in protein concentration lead oil 1 protein variation. However, in some environments short-season MG performed relatively better for oil 1 protein as they did for oil (Fig. 5), making MG II–III with the highest values in the three growing seasons (Table 6). Besides that, the existence of more than one ME can also be exploited by handling narrow adaptations for this economically important trait.
CONCLUSIONS A unique ME was identified for oil content in the Argentina crop area; maturity groups II–III and IV showed higher content than other groups in all of the environments (combinations of locations and planting dates). Two or three ME (depending on the growing season), were identified for protein and oil 1 protein contents. In one of them, cultivars belonging to MG VI had the highest value of these compounds whereas in other set of environments higher yielding cultivars were from MG II–III. Our results showed that oil content variation depended mainly on maturity group effects related to broad adaptations of short MG, whereas MG 3 E interaction effects for protein and oil 1 protein are enough to create opportunities for handling environment-specific adaptations. ACKNOWLEDGMENTS This work was made possible through the funds provided by the Agencia Nacional de Promocio´n Cientı´fica y Tecnolo´gica, Argentina (FONCYT-PICTO 08-12949), Comisio´n de Investigaciones Cientı´ficas de la Provincia de Buenos Aires, Universidad de Buenos Aires, Consejo Nacional de Investigaciones Cientı´ficas y Te´cnicas (CONICET) and the Instituto Nacional de Tecnologı´a Agropecuaria (INTA), Argentina. We sincerely thank INTA Soybean Network (RECSO) for providing the grain samples, specially the Researchers: Rau´l Vicentini, Hugo Peltzer, Miguel Galva´n, Rube´n Parra, Federico Piatti, Heraldo Troncoso, Francisco Fuentes, Juan Grecco, Emilce Gardenal, Santiago Meira, Norma Arias, Juan Jose´ De Batista, Liliana Iriarte, Marcela Lizondo, Hugo Robinet, Hugo Mirasso´n, Mario Mondino, Oscar Peterlin, Jorge Villar, Florencia Gutheim, Hugo Catalani, Isidro Cettour, Miguel Gardiol, and Manuel De Dios. We also thank Graciela Cazenave and Rafael Rodrı´guez for providing
DARDANELLI ET AL.: MEGA-ENVIRONMENTS FOR SOYBEAN
monthly meteorological data from the Instituto de Clima y Agua del Centro de Recursos Naturales CNIA INTA.
Reproduced from Crop Science. Published by Crop Science Society of America. All copyrights reserved.
REFERENCES AACC. 2000. Approved methods of the AACC. 10th ed. Am. Assoc. Cereal Chemists, St. Paul, MN. Baigorri, H.E. 1997. Eleccio´n de cultivares. (In Spanish.) p. 106–122. In H. Baigorri y L. Giorda (ed.) El cultivo de la soja en Argentina. INTA, Centro Regional Co´rdoba, Argentina. Baigorri, H.E., C. Ghida Daza, M. Cuniberti, R. Herrero, J. Arago´n, S. Vallone, L. Salines, E. Guillı´n, A. Kloster, M. Dı´az Zorita, R. Melchiori, A. Perticari, M. Bragachini, A. Von Martini, and A. Me´ndez. 2002. Evolucio´n y perspectivas de la produccio´n y de la investigacio´n en soja en Argentina. (In Spanish, with English abstract.) p. 84–95. In Anais do II Congresso Brasileiro de Soja e Mercosoja, Foz do Iguaçu PR Brasil. 2–6 June 2002. EMBRAPA (Ed.) Londrina, PR Brazil. Cuniberti, M., and A. Pe´rez. 1997. Interaccio´n genotipo-ambiente del contenido de proteı´na y aceite en cultivares de soja de GM V, VI y VII. (In Spanish.) p. 25–50. In Informe Te´cnico No. 126. INTAEEA Marcos Jua´rez, Argentina. Cuniberti, M., R. Herrero, H. Baigorri, D. Croato, B. Masiero, R. Parra, R. Vicentini, and F. Piatti. 2000. p. 108–109.In K. Saio (ed.) Proc. of the Third Int. Soybean Processing and Utilization Conf., Tsukuba, Ibaraki, Japan. 15–20 Oct. 2000. Korin Publishing Co. Ltd., Tokyo. Cuniberti, M., R. Herrero, S. Vallone, and H. Baigorri. 2001. Calidad Industrial, rendimiento y sanidad de la soja en la regio´n central del pais-Campan˜a 2000/01. (In Spanish.) p. 84–86. In F. Moscardi et al. (ed.) Soja. Informacio´n para Extensio´n no. 69 INTA EEA Marcos Juarez, Co´rdoba, Argentina. Cuniberti, M., R. Rossi, R. Herrero, and B. Ferrari. 2004. Industrial quality of soybean in Argentina. p. 961–970 In Proc. of the VII World Soybean Res. Conf., IV Int. Soybean Processing and Utilization Conf. y III Congreso Mundial de Soja, Foz de Iguazu´Brasil. 1–5 Mar. 2004. Embrapa Londrina PR Brazil. Dorrnbos, D.L., Jr., and R.E. Mullen. 1992. Soybean seed oil and oil contents and fatty acid composition adjustments by drought and temperature. J. Am. Oil Chem. Soc. 69:228–231. Gibson, L.R., and R.E. Mullen. 1996. Soybean seed composition under high day and night growth temperatures. J. Am. Oil Chem. Soc. 73:733–737. Hall, A.J., C.M. Rebella, C.M. Ghersa, and J.P. Culot. 1992. Field-crop systems of the Pampas. p. 413–449. In C.J. Pearson, ed. Ecosystems of the world: Field crop ecosystems. Elsevier, Amsterdam. Herrero, R.M., M. Cuniberti, and B. Masiero. 1999. Effect of planting
1947
date on the industrial quality of soybean. p. 668–669. In H.E. Kauffman (ed.) Proc. World Soybean Res. Conf. VI, Chicago. 4–7 Aug. 1999. Kang, M.S. 2002. Genotype-environment interaction: Progress and prospects. CABI Publishing, New York. Maestri, D.M., D.O. Labuckas, J.M. Meriles, A. Lamarque, J.A. Zygadlo, and C.A. Guzma´n. 1998. Seed composition of soybean cultivars evaluated in different environmental regions. J. Sci. Food Agric. 77:494–498. Piper, E.L., and K.J. Boote. 1999. Temperature and cultivar effects on soybean seed oil and protein concentrations. J. Am. Oil Chem. Soc. 76:1233–1241. Rossi, R.L. 2004. Aporte del mejoramiento gene´tico al cultivo de la soja en la Argentina actual y de expansio´n futura. (In Spanish.) p. 26–30. In Libro de Conferencias, Soja, 18 Agro Jornada del Centro del Paı´s. Co´rdoba, Argentina. Sakla, A.B., and Y. Ghali. 1988. The effects of environmental conditions on the chemical composition of soybean seeds: Relationship between the protein, oil, carbohydrate and trypsin inhibitor content. Food Chem. 29:221–231. Vollmann, J., C.N. Fritz, H. Wagentristi, and P. Ruckenbauer. 2000. Environmental and genetic variation of soybean seed protein content under central European growing conditions. J. Sci. Food Agric. 80:1300–1306. Wilcox, J.R., and R.M. Shibles. 2001. Interrelationships among seed quality attributes in soybean. Crop Sci. 41:11–14. Wilson, R. 2004. Seed composition. p. 621–677. In B.A. Stewart and D.R. Nielsen (ed.) Soybeans: Improvement, production and uses. 3rd ed. Agronomy Monograph 16. ASSA, CSSA, and SSSA, Madison, WI. Yan, W., L.A. Hunt, Q. Sheng, and Z. Szlavnics. 2000. Cultivar evaluation and mega-environment investigation based on the GGE biplot. Crop Sci. 40:597–605. Yan, W., P.L. Cornelius, J. Crossa, and L.A. Hunt. 2001. Two types of GGE biplots for analyzing multi-environment trial data. Crop Sci. 41:656–663. Yan, W., and M.S. Kang. 2003. GGE biplot analysis: A graphical tool for breeders, geneticists, and agronomists. CRC Press. Boca Raton, FL. Yaklich, E.W., B. Vinyard, M. Camp, and S. Douglass. 2002. Analysis of seed protein and oil from soybean northern and southern region uniform tests. Crop Sci. 42:1504–1515. Yaklich, R.W., and B.T. Vinyard. 2004. Estimating soybean seed protein and oil concentration before harvest. J. Am. Oil Chem. Soc. 81:189–194. Zhang, M., M. Kang, P. Reese, and H. Bhardwaj. 2005. Soybean Cultivar Evaluation via GGE Biplot Analysis. J. New Seeds 7(4):37–50.