In addition, the daily flows for each month in the MD year period are also available at the index site. The disaggregation problem considered in this paper then.
SPACE-TIME DISAGGREGATION OF STREAMFLOW DATA USING K-NEAREST NEIGHBOR PATTERNS AND OPTIMIZATION D. Nagesh Kumar, Civil Engg. Dept., Indian Institute of Technology, Kharagpur, India Upmanu Lall, UWRL, Utah State University, Logan, USA Michael Peterson, Keller-Bliesner Engineering, Logan, USA
ABSTRACT Disaggregated sequences that are statistically similar to observed streamflow records are very useful for analyzing multi reservoir operation policies and river basin management. There is renewed interest in disaggregation methods as climate related issues (regional ENSO forecasts or downscaling of Climate Change Scenarios) have come to the fore. Disaggregated streamflow should preserve statistical attributes of time series across multiple sites and time scales. A new algorithm for simultaneously disaggregating monthly to weekly or daily flows at a number of sites on a drainage network is presented in this paper. The continuity of flow in time across months at each site as well as the inter-site flow pattern is preserved. The disaggregated daily flows at the multiple sites are conditioned on the spatial (across site) pattern of monthly flows at the same sites. The probability distribution of the vector of disaggregated flows conditional on the multi-site monthly flows is approximated nonparametrically using the k-nearest neighbors of the monthly spatial flow pattern. A constrained optimization problem is solved to adaptively estimate the disaggregated flows in space and time for each such neighborhood. An application to data from a tributary of the Colorado River is used to illustrate the modeling process. The daily streamflow data available at the index site was disaggregated to obtain the streamflow data at four upstream sites conditioned on monthly data available at those sites. KEYWORDS Stochastic Hydrology, Nonparametric Methods, Streamflow disaggreagtion. INTRODUCTION Streamflow disaggregation is very useful for evaluating multi reservoir operation policies and for river basin management. There is renewed interest in disaggregation methods as climate related issues (regional ENSO forecasts or downscaling of Climate Change Scenarios) have come to the fore. The disaggregation models proposed by Valencia and Schaake (1973) have been used to divide annual flows into seasonal flows (Mejia and Rousselle, 1976; Srikanthan, 1978; Salas et al., 1980) and to divide aggregate basin flows (monthly or annual) into flows at individual sites (Salas et al., 1980). Stedinger and Vogel (1984) further extended this model to reproduce the correlation between disaggregated flow volumes at different time scales. Recent models include models proposed by Koutsoyiannis (1992), Bartolini and Salas (1993) and Koutsoyiannis and Manetas
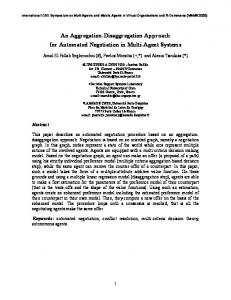
(1996). By and large, these approaches have focused on space or time disaggregation and on annual to seasonal or seasonal to sub-seasonal flows. Parametric assumptions of the probability distribution of the underlying streamflow are usually invoked. The disaggregated flows (monthly from annual sum or individual sites from index site) are obtained using the correlation structure of the respective time or space flow. An exception is the work of Lall et al (1996) and Tarboton et al. (1998). They proposed a nonparametric approach for space or time disaggregation based on kernel density estimation. A new algorithm for simultaneously disaggregating monthly to weekly or daily flows at a number of sites on a drainage network is presented in this paper. PROBLEM STATEMENT The setting for the problem considered is illustrated in Figure 1. An “index” gage is located on the main stem of the river system. Monthly and daily flows are available at this gage. A number (p-1) of stream gages are located on stream reaches influent into the index gage. A hypothetical gain/loss gage representing changes in total flow from the (p-1) upstream gages to the index gage is also considered. Gage 1 Gage 2 Index Gage
Gage i Gage (p-1)
Gage … Gain/Loss Gage (p) Figure 1. Generic Layout of Stream Gages on a River Basin for the Disaggregation Problem Historical daily and monthly flow data at all sites is presumed to be available for MK years. This data is used to estimate the statistical relationships for disaggregation. A second data set of length MD years is also available. This data corresponds to the period for which disaggregation of monthly to daily flows is needed. Monthly flow data are presumed to be available for each of the p upstream sites and for the downstream index site. In addition, the daily flows for each month in the MD year period are also available at the index site. The disaggregation problem considered in this paper then entails the temporal disaggregation of monthly to daily flows at the p sites (including the gain/loss gage) and the spatial disaggregation of the index site daily flows to the upstream sites. The generated daily flows should sum to the monthly flows at each site, and the daily flows across sites for a given day should sum to the daily flow at the downstream index site. The gain/loss site conceptually accounts for timing issues as well as ungaged tributaries, diversions or return flows in this setting. Also, we need to preserve continuity of flow in time across months and across sites. Let the monthly flow at the index station in month m be denoted as Qm and the daily flow on day j in month m as qjm. For the upstream stations to be disaggregated, denote monthly flow in month m at site i as Xmi and daily flow on day j in month m at site i as xjmi. Daily flow on day j in month m at site i as a proportion of the index site, is given by pjmi = xjmi/qjm (1) We need to generate daily flows xjmi for each site i, for every month m that belongs to the set MD. First, consider the summability conditions for each month m in the disaggregation period MD. We have p conditions (eqn. 2) requiring the daily flows over month m to sum to the recorded flow at Page 2 of 8
each of the p sites, and ndm conditions (eqn. 3) requiring the daily flows at all the p sites for any day to sum to the daily flow at the downstream. This results in (p+ndm) equations to solve for (p*ndm) unknowns. Usually, the number of unknowns will far exceed the number of equations, and the problem as stated is not well posed since many combinations of values for the xjmi will satisfy these equations. Further, these equations will need to be solved anew for every combination of flow values for any given month. nd m
∑x j =1
jmi
= Xmi
i = 1,..., p
(2)
jmi
= q jm
j = 1,..., nd m
(3)
p
∑x i =1
Equation (3) can also be written as p
∑p
jmi
=1
j = 1,...,nd m
(3a)
i =1
An optimization algorithm that seeks a solution to these summability equations in the disaggregation period MD, and simultaneously yields optimal "prediction" for the xm with reference to "similar" months in the period MK, is described in the next section. Here, "similar" is defined in terms of closeness of the ym for the month to be disaggregated in terms of the L1, L2, Mahalanobis or other distance metric to values of ym for the same calendar month in the MK period. MULTI-SITE DISAGGREGATION ALGORITHM The algorithm seeks to generate daily flows for a specific month m* in the period MD. The following key steps are followed: 1. For current month m*, identify calendar month mc 2. Define season window Mc for month mc (e.g., 1 or 3 months centered about mc). Only flow vectors from this season window in the past MK years of record are considered as representative of the current conditions. A seasonal window is used to ensure the selection of an appropriate seasonal pattern of monthly flows. 3. Identify spatial monthly flow patterns in the historical MK record that are "similar" to the current monthly flow pattern zm defined as (Qm*, Xm*1, i=1..p). Find the K nearest neighbors zm*k, k=1…K, of zm* in the vectors zm, m ∈ Mc ∈ MK , in the historical period of MK years. The nearest neighbors are identified based on a Euclidean or other distance metric applied to zm* and zm, m ∈ Mc ∈ MK . Lall and Sharma (1996) and Rajagopalan and Lall (1999) present time series resampling approaches using multivariate K-nearest neighbor density estimation approaches. They recommend a choice of K equal to the sqrt(n), where n is the sample size, to be effective as a rule of thumb. These K neighbors specify a conditioning slice of the multivariate density of zm defined in a neighborhood of zm*. The K neighbors are associated with month indices in the historical (MK) data set. After the neighbors are selected, the subsequent computations are performed with the same calendar month as mc selected from the seasonal window for each of the k neighbors. 4. Define an optimization problem to solve for the daily flow proportions pm* to minimize total weighted daily flow prediction error across all p sites for each of the K nearest neighbor months in the MK year historical period, while satisfying summability and continuity constraints for the current month m* (which is part of the period MD). This seeks to determine an optimal set of values of the pm* conditional on the current monthly flow pattern zm*. Page 3 of 8
The linear optimization problem solved for disaggregating the monthly flow for a month is now formally presented. The objective function is defined using a weighted L1 norm as : K nd m p Minimize ∑ ∑ ∑ w jki (u jki + v jki ) (4) = = = k 1j 1i 1 where the weight wjki = 1/djki, with djki = sqrt{(qjm*-qjk)2 + (Xm*i-Xki)2} and (ujki - vjki) is the error in the prediction of the observed daily flow xjki for site i on day j, neighbor month k in the historical data set MK. Here the error is defined as the difference of two positive variables, ujki and vjki. Consequently, the term (ujki+vjki) in objective function translates into an absolute error in the linear programming framework. The errors are defined in terms of the historical daily flow data at upstream sites (xjki) and index site (qjk) and the candidate value of the daily flow disaggregation proportion pjm*i through the equations: xjki-pjm*i qjk + ujki-vjki= 0 j=1…ndm; k=1…K; i=1…p, m ∈ Mc ∈ MK u jki ≥ 0; v jki ≥ 0 j = 1...nd m ; i = 1....p ; k = 1...K
(5) (6)
The algorithm presented here also considers the specification of a number of constraints to regularize the local regression solution. These include the set of equations 5 above that apply to the historical period MK. Additional constraints that may be specified are enumerated below. The summability constraints applied to month m* flows in period MD, across time and space are represented as: nd m
∑p j =1
jm *i
i = 1,...,p (7)
p
∑p
q jm* =Xm*i
jm *i
=1
j = 1,..., ndm*
i =1
Constraints can be included to maintain inter-site flow continuity. For instance, we could look at pairs of sites (e.g., i and o), and recognize that the difference in the flow proportions for any day in the calendar month mc between the pair of interest lies in a certain range historically (for the K neighbors) and restrict this range as: pclm*i,o ≤ p jm*i − p jm *o ≤ pcu m*i,o
i≠o, i=1,...,p, o=1,...,p, j=1,...,ndm*
(8)
The daily flow proportions for the (p-1) sites excluding the gain/loss site are restricted to lie between 0 and 1. The proportion for the gain/loss site is not restricted. j=1...ndm*, i=1...p-1 (9) 0 ≤ pjm*i ≤ 1 The allowable range of the pjm*i can be further restricted by examining the maximum range of these proportions in the period MK, for the seasonal window Mc. Suppose that the range of the daily flow for month mc at site i as a proportion of the index gage ranges lies between plm*i and pum*i in the historical set MK. Then it may be reasonable to replace (9) by the following constraint: pl m*i ≤ p jm*i ≤ pum*i j = 1...nd m* i = 1...p (9a)
Page 4 of 8
Summarizing, we find the “best” performing solution for the disaggregation problem by checking performance on months that were historically the most similar to the current month, while restricting the range of solutions using summability requirements and also a variety of other conditions applied to the month to be disaggregated that make sense operationally. The disaggregation model developed is presented in detail in Nagesh Kumar et al. (1999) along with other constraints that can be included in the optimization model and a discussion of their effect on the results obtained. The algorithm has been implemented using linear programming in LINGO (Language for INteractive General Optimization) as a general procedure for the monthly to daily disaggregation for multiple sites. A typical optimization problem solved will have ndm*p(1+2K) decision variables (including the error terms) and up to {ndm*(1+p+Kp+p(p-1)/2)+p} constraints (depending on which ones are actually used). MODEL APPLICATION Given the nature of the model presented, its attributes are best exhibited through an application to a real data set that motivated our formulation. The San Juan River originates in the San Juan Mountains of southern Colorado, USA. The river flows southwest into New Mexico, through Utah and ultimately into Lake Powell. In the extreme upper basin, the first major tributary to the San Juan River is the Navajo River. Streamflow gaging stations on the main stem of the San Juan River lie above and below the mouth of the Navajo River at Pagosa Springs and near Carracus, CO respectively. The U.S. Bureau of Reclamation required the extension and disaggregation of the natural flow series of the major rivers used in the San Juan River Basin Recovery Implementation Program. Monthly naturalized streamflow records were available for a number of gages on a tributary basin to the Colorado River. However, daily flows were available at these gages only for a subset of the record. Daily flows at an "index" site were available for the full record. The interest was in using the data at the index site to develop daily flow records for the full period at all gages upstream of the index site. The streamflow gage on the San Juan River near Carracas, Colorado (Station 09346400) was used as index station. Data from three upstream sites, (i) Station 09342500, San Juan River At Pagosa Springs, (ii) Station 09344400, Navajo River Below Oso Diversion Dam near Chromo, CO and (iii) Station 09345200, Little Navajo River Below Little Oso Diversion Dam near Chromo, CO, were used. A gain/loss site was added as the fourth site. The sum of flows at all these four sites is presumed to sum to the flow at the index site for any day. Estimated daily natural flows (Acre-feet) at all these sites were available for a twenty year period from 1972 to 1991. The data for the first 15 years was used for estimation and the last 5 years data were used for model testing. A three-month window was considered to choose "good" analogs of the seasonal flow pattern and to help ensure flow continuity across month boundaries. From the cross correlation among monthly flows at different sites and also cross correlation between daily flows (during the estimation period) it was observed that the sites are strongly correlated with each other excepting with the gain/loss site. As explained earlier, for a given month a three month window is chosen (centering around the current month in the testing period), and the K-nearest neighbors in the estimation period are selected based on Euclidean distance between the spatial monthly flow patterns for the corresponding season. Consider disaggregation of the monthly flows for June 1991, a month in the Page 5 of 8
5 year model testing period (MD). The three month season considered for selecting monthly flow patterns is May, June and July. Now, including the index site, we have 5 values for each month’s flows for each of the 3 months in the window. These 15 numbers are compared with the corresponding 15 flow values (same season, same site) for each of the years 1972-1986 in the model parameter estimation set MK. The K (e.g., 5) nearest neighbors of June 1991 in the historical data set are then selected as the years that are closest in terms of this 15 component distance metric to the May-July 1991 values. For this data set the years 1984, 1981, 1976, 1974 and 1980, were the years for the 5 nearest neighbors of June 1991. The optimization problem is then defined in terms of the performance of the daily disaggregation proportions for June 1991 flows in predicting the actual daily flows at each site for the June of each of these 5 years. Recall that a weighted prediction error criteria is used for the purpose. The weights to be used for the prediction error for each day’s flow at each site for each of the 5 past June’s selected are next calculated. The weight for a given day’s prediction at a given site is calculated as the inverse of the Euclidean distance for a scaled daily flow for that day at the index site in June 1991 and June of the year of the kth neighbor, and the monthly flow at the same site for June 1991 and the June for the kth neighbor. The estimated and observed daily flows for a wet (May-July), and a dry (Jan-March) season for 1991 for all 4 sites are shown in Figures 2 and 3 respectively. The general seasonal trends in the observed flows are reproduced quite well in both cases. Fairly significant differences in the estimated and observed flows are apparent for a few days, particularly during the late March snowmelt period where the large contribution of the ungaged gain/loss site dominates the calculations. Interesting differences for gage 09345200 are also evident for the wet season, where the observed flows appear to show evidence of flow regulation, that is captured somewhat differently by the disaggregated flows. The performance of the algorithm over all 5 years in the testing period (1988-1992) assessed through the correlation between the observed and estimated daily flows for the 5 year period is presented in Table 1. Correlations greater than 0.05 are statistically significant at the 95% level. A perusal of the diagonal elements of this table reveals that the daily flows estimated at each of the 4 sites correlate very strongly with those observed in this 5 year period. Similarly mean and standard deviations of the disaggregated flows compared very well with those of observed flows. Hence, a satisfactory reproduction of these statistics, and the high correlations between the estimated daily flows and the observed daily flows in the 5 year period reserved for algorithm validation provides an indication of the success of the algorithm. Table 1. Cross correlations among Observed and Estimated flows for the testing period (1988-92)
Gage 09342500 Gage 09344400 Gage 09345200 Gain/Loss site
Gage 09342500 0.98 0.96 0.70 -0.21
Gage 09344400 0.95 0.96 0.68 -0.25
Gage 09345200 0.69 0.65 0.80 0.10
Gain/Loss site -0.18 -0.22 0.16 0.84
Page 6 of 8
DISCUSSION AND CONCLUSIONS The disaggregation algorithm presented here represents an operational solution to a difficult statistical estimation problem. While classical disaggregation algorithms consider the minimization of a global total error, the framework presented here can also bound the pointwise error, and hence avoid the common problem of a solution set where the error is non-uniformly distributed over the solution space. The approach presented here does not make prior assumptions about the correlation structure or about the associated probability distribution of the streamflow data. Traditional algorithms consider the use of globally (in state space) estimated correlation matrices and other parameters. Here, the estimation process is very local, specific to each month's data that is processed, and through the selection of a local neighborhood in the multivariate state space. These features allow for considerable flexibility in adapting to complex functional relationships. These are typical attributes of a nonparametric function estimator.
Page 7 of 8
The example application presented demonstrated the utility of the algorithm developed. Various statistical attributes as well as attributes intuitively important to the user were effectively reproduced. The ability to show representative traces (e.g., those associated with historical nearest neighbors of the current month) of daily flows that may be representative of the current situation allows the user to judge whether or not the solution is likely to be good. The use of the linear programming framework allows the algorithm and its applications to be quite extensible and flexible. ACKNOWLEDGEMENTS The first author wishes to thank Department of Science and Technology, Govt. of India for awarding BOYSCAST fellowship to conduct this research at Utah Water Research Laboratory, Utah State University, Logan, USA. REFERENCES 1. Bartolini, P., and J.D. Salas (1993) Modeling of Streamflow Processes at Different Time Scales. Water Resour. Res., 29(8) , pp. 2573-2587. 2. Koutsoyiannis, D. (1992) A nonlinear disaggregation method with a reduced parameter set for simulation of hydrologic series. Water Resour. Res., 28(12), pp. 3175-3191. 3. Koutsoyiannis, D., and A. Manetas (1996) Simple disaggregation by accurate adjusting procedures. Water Resour. Res., 32(7) , pp. 2105-2117. 4. Lall, U., A. Sharma (1996) A nearest neighbor bootstrap for time series resampling. Water Resour, Res., 32(3), pp. 679-693. 5. Lall, U., B.Rajagopalan, and D. G. Tarboton, (1996) A nonparametric wet/dry spell model for resampling daily precipitation. Water Resour. Res., 32(9), pp. 2803-2823. 6. Nagesh Kumar, D., U.Lall and M. Peterson, (1999) Multi-site Disaggregation of Monthly to Daily Streamflow. Water Resour. Res., communicated. 7. Rajagopalan, B. and U. Lall (1999) A Nearest Neighbor Bootstrap for Resampling Daily Precipitation and other Weather Variables. Water Resour. Res., in press. 8. Salas, J. D., J. W. Delleur, V. Yevjevich, and W. L. Lane (1980) Applied Modeling of Hydrologic Time Series. Water Resour., Littleton, Colorado. 9. Srikanthan, R., Sequential generation of monthly streamflows. J. Hydrol., 38, pp. 71–80, 1978. 10. Stedinger, J. R., and R. M. Vogel (1984) Disaggregation procedures for generating serially correlated flow vectors. Water Resour. Res., 20(1), pp. 47–56. 11. Tarboton, D. G., A. Sharma and U. Lall (1998) Disaggregation procedures for stochastic hydrology based on nonparametric density estimation. Water Resour. Res., 34(1), pp. 107-119. 12. Valencia, D. R., and J. L. Schaake, Jr. (1973) Disaggregation processes in stochastic hydrology. Water Resour. Res., 9(3), pp. 580-585.
Page 8 of 8